

 PDF
PDF ePub
ePub Citation
 Print
Print


INTRODUCTION
Monitoring of cardiac output (CO) and invasive hemodynamic parameters is useful during major operation. For a long time, CO monitoring using thermodilution method with pulmonary artery catheter (PAC) has been considered as a “golden standard.” Although this method has been applied as a useful hemodynamic monitor in liver transplantation surgery, its invasiveness can be associated with increased morbidity and mortality, which may compromise its efficacy in clinical application.1234 For these reasons, Arterial pressure waveform analysis and esophageal Doppler were introduced and applied as less invasive methods for monitoring CO in patients undergoing surgery and ICU care.15 Thoracic impedance cardiography (ICG) is a non-invasive and easy-to-apply method for continuous CO monitoring that requires attachment of four patches to the skin of neck and thoracic wall. ICG evaluates CO by measuring changes in electrical resistance of the thorax during a cardiac cycle. However, the efficacy of ICG can be limited in certain types of surgery, since its measured CO values can interfere with several surgical manipulation, volume shift including acute bleeding, and electrocautery.67
Liver transplantation is a major surgery during which large hemodynamic changes may occur. Thermodilution with PAC is most commonly used during liver transplantation.8 Although ICG is non-invasive and easy to apply without training, the results regarding its efficacy and accuracy are conflicting. First of all, ICG has not been validated using thermodilution with PAC, which is regarded as a golden standard. Therefore, this study aimed to compare the accuracy and efficacy of ICG as a non-invasive cardiac function monitoring technique to those of thermodilution with PAC and arterial pressure contour.
MATERIALS AND METHODS
Patients and data collection
This retrospective study was approved by the Institutional Review Board (IRB) of Severance Hospital (IRB number: 4-2018-0560), and the need for written informed consent was waived by the IRB. Medical records of all patients who underwent living donor liver transplantation at Severance Hospital between January and April 2018 were reviewed in this study. Patients who underwent cardiac index (CI) measurements using thermodilution with PAC, arterial waveform analysis, and ICG were included. There were no exclusion criteria. Medical records were reviewed to obtain patients' demographic data, medical history, and cardiac function parameters.
Cardiac monitoring
In the continuous thermodilution technique, a PAC is equipped with an electrical filament wire version of the thermodilution catheter, which is positioned in the right ventricle and heats the surrounding blood intermittently.1 The temperature change in the blood ejected from the right ventricle is detected by a thermistor located at the tip of PAC floating freely in the pulmonary artery.6 Continuous thermodilution technique with PAC has time delays in CI measurements. PAC's electric filament wire heaters usually cycle every 40–60 seconds. It may take up to 12 minutes to fully register CI on the monitor.1 In arterial waveform analysis method, the area under the systolic portion of arterial pulse wave from the end of diastole to the end of ejection phase is related to stroke volume and CI.9 Arterial waveform analysis require calibration, usually with an indicator dilution technique; but recently, self-calibration software has been developed for FloTrac™/EV1000™ (Edwards Lifesciences, Irvine, CA, USA).1 Time for calculating CI depends on the method. FloTrac™/EV1000™ (Edwards Lifesciences) monitor calculates CI for 20 seconds. ICG estimates CI by measuring electrical resistance (impedance) changes across the thorax during cardiac cycle. A safe and unrecognizable low-voltage, high-amplitude current is introduced through the sensor, and voltage is sensed through the other sensor. The difference between the introduced voltage and sensed voltage indicates the amount of resistance (impedance) the electrical current encounters. Resistance to electrical current in the thorax changes in relation to the amount of blood in the aorta.1 A change in impedance is recorded, indicating changes in the blood flow in the chest.10 CI measurement time of Niccomo ICG monitor is determined by heart rate. In our study, CI measurement period was 16 beats. If the patient's heart rate is 100, CO measurement for about 9.6 seconds would be displayed on the monitor.7
Anesthetic management
During the study period, all patients were managed by standard anesthesia protocols. After preoxygenation, general anesthesia was induced with propofol, sufentanil, and inhaled desflurane. Rocuronium was used for neuromuscular block. Patients were intubated, and mechanical ventilation was instituted using volume-controlled ventilation at a tidal volume of 6–8 mL/kg with 50% oxygen and medical air. Respiratory rate was adjusted to within the target of an end-tidal carbon dioxide concentration of 35–40 mm Hg. Anesthesia was maintained with inhaled desflurane and a continuous infusion of sufentanil and cisatracurium. Vascular catheterization was performed in the right radial artery (BD Angiocath™ 20G, Becton Dickinson, Heidelberg, Germany), left femoral artery (Arrow pediatric jugular catheterization set 20G; Arrow International, Reading, PA, USA), and left femoral vein [7-French (Fr) double-lumen central venous catheter, Arrow Gard Blue; Arrow International]. A 9-Fr large bore central venous catheter (Advanced Venous Access, Edward Lifesciences, Irvine, CA, USA) was placed in the right internal jugular vein, and a PAC (Swan-Ganz CCOmbo V, Edward Lifesciences) was inserted.
Radial artery catheter was connected to FloTrac™/EV1000™ system device (Edwards Lifesciences). PAC was connected to Vigilance II Monitor (Edwards Lifesciences) to measure continuous CO/index by thermodilution technique. In addition, the electrodes of Niccomo™ ICG monitor (Medis, Ilmenau, Germany) were attached on the left side of the patient's neck and the midaxillary line of left chest at the level of xiphoid process. Then, four electrodes were connected to Niccomo™ device (Medis) to measure CO/index and hemodynamic parameters. After induction of anesthesia, simultaneously measured CIs were recorded in the patient's anesthesia records every hour until the end of operation.
Statistical analysis
The patients' demographic characteristics are presented as mean±standard deviation (SD), median (first quartile-third quartile), or number (percentage). The normality of continuous variables was tested using Kolmogorov-Smirnov test. Statistical analysis of CI was performed using intraclass correlation coefficient (ICC), and Bland-Altman analysis was used to assess the degree of agreement between the measured CIs provided by two of the three cardiac monitoring methods. ICC represents agreement classified as almost perfect (0.81–1.00), substantial (0.61–0.80), moderate (0.41–0.60), fair (0.20–0.40), and slight (<0.20).11 Bland-Altman analysis was used to calculate the mean and difference in each pair of measurements, with the mean being x-axis and the difference being y-axis. According to the mean and SD of the differences in CI, 95% of the differences were between mean±1.96 SD.12 In Bland-Altman analysis, the percentage error could be calculated by doubling SD of bias divided by the mean CI. When the percentage error was less than 30%, the two methods were considered clinically equivalent.913 All statistical analyses were performed using SAS (version 9.4, SAS Inc., Cary, NC, USA) and R version 3.3.0 (The R Foundation for Statistical Computing, Vienna, Austria).
RESULTS
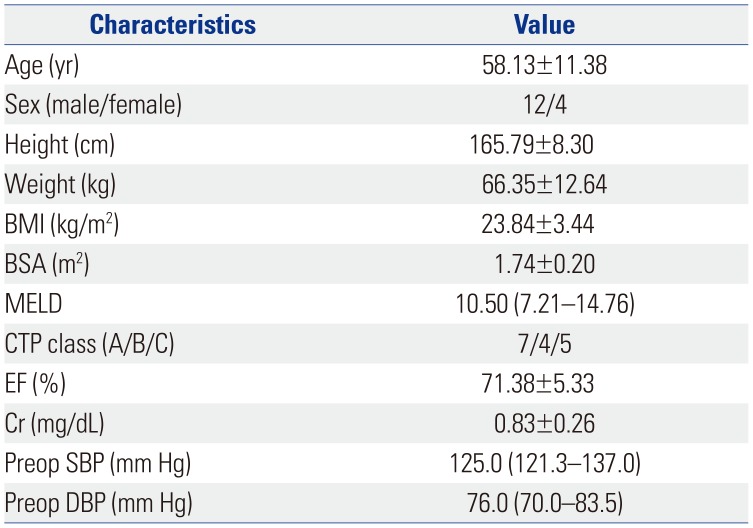
Sixteen patients with 220 paired CI were enrolled in this study. Demographic characteristics of the patients are shown in Table 1. Mean (±SD) CI of thermodilution with PAC was 4.4±1.21 L/min/m2, while that of arterial pressure waveform analysis was 4.0±1.06 L/min/m2 and that of ICG was 3.3±0.88 L/min/m2. The range of CO and CI measurements from thermodilution with PAC, arterial waveform analysis, and ICG were 3.7–16.7 L/min and 2.1–8.8 L/min/m2, 2.2–13.6 L/min and 1.6–5.5 L/min/m2, and 2.6–13.0 L/min and 1.6–5.5 L/min/m2, respectively.
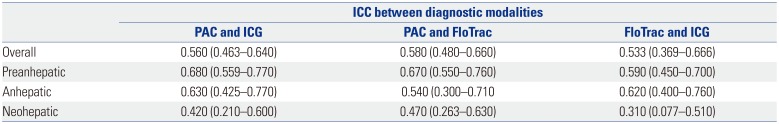
Moderate agreement was observed between two of the three methods when analyzed on the basis of ICC (Table 2). In subgroup analysis according to preanhepatic phase, anhepatic phase, and neohepatic phase, substantial agreement was observed between CI of thermodilution with PAC and ICG at preanhepatic and anhepatic phases, and between CI of thermodilution with PAC and arterial waveform analysis only at preanhepatic phase (Table 2).
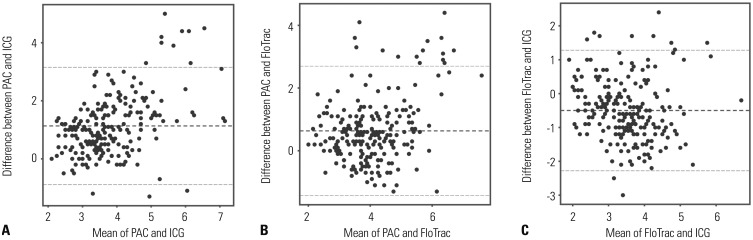
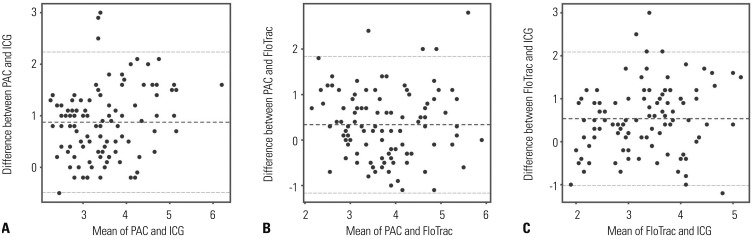
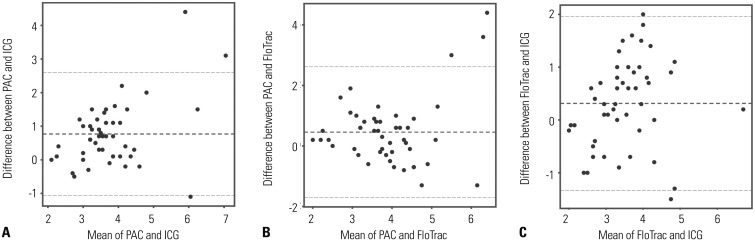
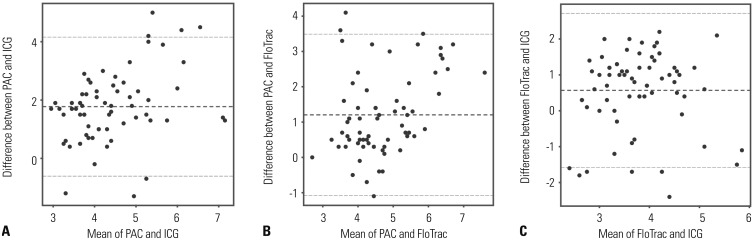
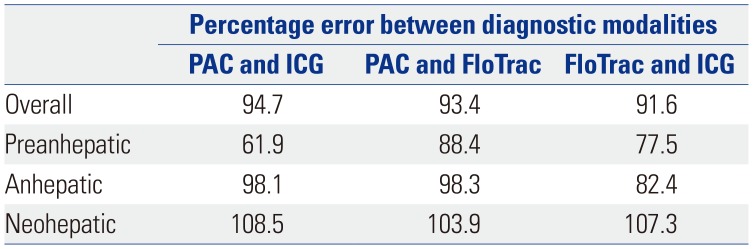
The bias of CI of thermodilution with PAC and ICG was 1.13 L/min/m2, and the lower and upper limits of agreement were −0.93 L/min/m2 and 3.20 L/min/m2, respectively. Percentage error was 94.7%, which exceeded the 30% limit of acceptance. The bias of CI of thermodilution with PAC and arterial pressure contour was 0.62 L/min/m2, and the lower and upper limits of agreement were −1.43 L/min/m2 and 2.67 L/min/m2, respectively, with a percentage error of 93.4%. The bias of CI of arterial pressure contour and ICG was 0.50 L/min/m2, and the lower and upper limits of agreement were −1.32 L/min/m2 and 2.32 L/min/m2, respectively, with a percentage error of 91.6% (Fig. 1). In subgroup analysis according to preanhepatic phase, anhepatic phase, and neohepatic phase, all of the percentage of error between diagnostic modalities were greater than 30% (Table 3, Figs. 2, 3, 4).
DISCUSSION
This is the first study to simultaneously compare ICG with thermodilution with PAC and arterial pressure contour during liver transplantation. This study showed that, although thermodilution, arterial pressure contour, and ICG showed similar moderate agreement, ICG and arterial pressure contour are not clinically equivalent with PAC in liver transplantation.
Traditionally, PAC has been used to measure invasive hemodynamic parameters in high-risk patients undergoing major surgery.14151617 However, PAC may be inaccurate if it is not positioned correctly, and it does not reflect the change in intravascular volume rapidly enough. In addition, risks of PAC insertion, such as pulmonary artery rupture and ventricular arrhythmia, have been reported.418192021 PAC is less frequently used than before, as minimally invasive monitoring tools can be used instead of PAC.2223 Arterial pulse waveform analysis is a less invasive CO measurement method. However, in patients with cirrhosis of Child-Pugh classes B and C, arterial pressure waveform analysis system had little correlation with thermodilution with PAC. In liver cirrhosis with Child-Pugh classes B and C, the degree of inaccuracy was proportional to the patient's systemic vascular resistance, indicating less correlation with PAC. Arterial pulse waveform analysis underestimated CO in liver transplant patients with CO exceeding 8 L/min.15 Despite these features, arterial waveform analysis has been increasingly used in various surgeries for monitoring cardiac function.
ICG involves the application of thoracic electrical bioimpedance (TEB) technology, which determines CO by measuring changes in TEB during the cardiac cycle. Electrodes are attached onto the root of the neck and thorax. A safe, undetectable, low-voltage, high-amplitude alternating current is introduced through the outermost sensor, and the voltage is sensed through the innermost sensor. The difference between the introduced voltage and the sensed voltage is the amount of resistance (impedance). Resistance (impedance) to the current in the thorax changes with the amount of blood in the aorta. ICG measures these changes over time as a volume waveform similar to an arterial pressure waveform.6 It has the advantage of being a non-invasive, cost-effective, operator-independent method that is also capable of stable measurements in both upright and supine positions. Non-invasive hemodynamic CO monitoring method can allow hemodynamic optimization strategies in low- or intermediate-risk surgical patients, or patients undergoing diagnostic or therapeutic procedures such as endoscopy or interventional radiology procedures.24 It can also enable continuous real-time monitoring of cardio-circulatory variations.25 The trending ability of continuous CO monitoring device may be more helpful in the management and optimization of hemodynamics, as the patient's hemodynamic status and response can change under major surgeries.26 Studies of ICG have reported conflicting results and are difficult to compare, since they have been performed using devices of different generations in patients with different characteristics, while also using different equations.27 The accuracy of ICG decreases when a rapid change occurs in abrupt hemodynamic loading.28
Time for calculating CO depends on the method. FloTrac™/EV1000™ monitor (Edwards Lifesciences) calculates CO for 20 seconds. CO measurement time of Niccomo™ ICG monitor (Medis) is determined by the heart rate. In the current study, the period for measuring CO was 16 heartbeats. Continuous thermodilution technique using PAC has a time delay in measuring CO. Electric filament wire heater of PAC is usually cycled every 40–60 seconds. It may take up to 12 minutes for CO to be fully registered on the monitor, as it is averaged with the goal of reducing noise and improving reliability.1 Therefore, the continuous thermodilution method may not detect sudden changes in CO compared to arterial pressure waveform analysis or ICG. In our study, the bias between arterial pressure waveform analysis and ICG, which have a relatively short time interval for measuring CI compared to PAC, was 0.50 L/min/m2. This bias was lower than that between thermodilution with PAC and the other two methods; bias between PAC and ICG was 1.13 L/min/m2, and that between PAC and arterial pressure waveform analysis was 0.62 L/min/m2. This result may have been due to the difference in the time of CO measurement among the three methods.
Since ICG reads electrocardiographic parameters and thoracic impedance through electrodes to measure CO, the CO values cannot be obtained while electrocautery is used. When the use of electrocautery is discontinued, the display of CO is delayed until a set number of heartbeats has passed.7 On the other hand, PAC and arterial waveform analysis are not affected by electrocautery. Therefore, the values measured by ICG around the use of electrocautery may be relatively unreliable; however, those measured by thermodilution or arterial pulse contour analyses may be more reliable during the use of electrocautery.
On Bland-Altman analysis, the percentage error of thermodilution with PAC and arterial waveform analysis was more than 30%, although ICC showed moderate agreement. However, both thermodilution with PAC and arterial waveform analysis are widely used in major surgeries, including liver transplantation. Thermodilution with PAC and ICG also showed a percentage error above 30%, and a moderate-to-substantial degree of agreement on the basis of ICC. Although both ICG and arterial waveform analysis are not clinically equivalent to thermodilution, ICG has a better correlation with thermodilution than arterial waveform analysis at preanhepatic and anhepatic phases. ICG might be more useful as a non-invasive cardiac function monitor than arterial waveform analysis in the case of high-risk patients undergoing minor surgery. More studies on these types of situations are required.
This study had some limitations. First, the number of patients was small (n=16). The median number of patients in recent studies on ICG was 28 (range 21–45). However, 220 paired CIs were included in our study, which was more than the median of data in other studies: 97 (interquartile range 36–158) pairs.29 Second, we used continuous thermodilution instead of intermittent bolus thermodilution. Although intermittent pulmonary artery thermodilution is often referred to as the clinical “golden standard,” its accuracy depends on operator variation, patient pathologies, and the indicator used. According to previous studies, continuous and intermittent thermodilution have shown acceptable limits of agreement during major surgeries.303132 Previous studies demonstrated that during liver transplantation, the correlation between intermittent and continuous thermodilution CO measurements was significant (r=0.87–0.92).3033 Therefore, continuous thermodilution in this study was appropriate for determining CO measurement. Third, there may be possible bias due to the discrepancy of measurement timing of three different modalities. Inconsistencies in timing during recording may occur, since one anesthesiologist records the CO calculated from the three modalities simultaneously on anesthesia record.
In conclusion, although neither method was clinically equivalent to thermodilution, ICG showed more substantial correlation with thermodilution method than with arterial waveform analysis. As a non-invasive cardiac function monitor, ICG would likely require further studies in other settings.
 XML Download