

 PDF
PDF Citation
 Print
Print


INTRODUCTION
Ovarian cancer is one of the leading causes of cancer-related morbidities in women, and the fifth leading cause of cancer-related death according to data from the National Center for Health Statistics [1]. More than three quarters of the total number of cases of ovarian cancer are diagnosed in advanced stages because of the ability of this disease to disseminate through the abdominal cavity without eliciting any specific symptoms [2]. Delayed detection and lack of specific screening tools are related to the poor outcome of the disease. Despite persistent efforts of many clinicians worldwide, the long-term overall survival (OS) of patients with ovarian cancer has not improved in the last few decades [3].
Human epidermal growth factor receptor-2 (HER2) is a member of the epidermal growth factor receptor (EGFR) family of transmembrane receptor tyrosine kinases. HER2 overexpression can trigger intracellular signaling pathways related to cell proliferation, differentiation, and survival [4], and is associated with poor prognosis in breast cancer; however, its role in ovarian cancer is controversial [567]. Trastuzumab (Herceptin®, Basel, Switzerland), a humanized monoclonal antibody (mAb) targeting HER2, induces internalisation and downregulation of HER2. This has been approved for treatment of breast cancers with HER2 overexpression, but its efficacy for ovarian cancer is yet to be confirmed [8]. HER3, another member of the EGFR family, has not been extensively studied due to its lack of kinase activity and dependency on other members of the EGFR family. However, after van der Horst et al. [9] demonstrated that the mAb against HER3 inhibited growth of trastuzumab-resistant breast cancer cell lines, the implication of HER3 overexpression is being studied widely. However, only few studies regarding HER3 expression in ovarian cancer exist, which differ in the extent of HER3 detection using immunohistochemistry (IHC) [101112].
In this study, the HER2/HER3 status in specimens of primary epithelial ovarian cancer was investigated objectively and their correlation with clinical features of ovarian cancer and disease outcome were determined
MATERIALS AND METHODS
1. Specimen collection and clinical data of patients
Ovarian cancer tissue was obtained from 105 patients who were evaluated with primary epithelial ovarian cancer. These patients underwent surgery from 2001 to 2005 at the Korea University Anam Hospital. Patients with double primary tumour, non-optimal surgery, neo-adjuvant chemotherapy, or recurrent ovarian malignancy were excluded. Patient information regarding clinical parameters and disease outcome was obtained from electronic medical records. The International Federation of Gynaecology and Obstetrics criteria were used for surgical staging. The study was approved by ethical committee of Korea University Medical Center Anam Hospital (No. 2017AN0374) and all patients provided written informed consent for biological studies.
2. Treatment of the disease
Treatment was initiated using primary debulking surgery. The surgery included total abdominal hysterectomy with bilateral salpingo-oophorectomy, bilateral pelvic and para-aortic lymph node dissections, omentectomy, and removal of all visible lesions. Adjuvant chemotherapy with six cycles of paclitaxel and carboplatin were administered to patients with stage Ic or higher stage of tumour, or with high grade histology tumours, such as clear cell carcinoma or malignant mixed Müllerian tumour.
3. Specimen preparation
Tissue specimens were formalin-fixed and paraffin-embedded after the surgery. Tissue microarrays (TMAs) were prepared using 4-µm-tissue from paraffin blocks of 105 ovarian tumour samples deposited in the Department of Pathology. Sample quality was assessed using haematoxylin and eosin staining of tissue sections. The TMAs included multiple sections from each tumour block and tissue of normal ovary, whenever possible.
4. IHC
Parallel sections from the same tumour block were used for IHC and in situ hybridization (ISH). HER2, HER3, PI3K, Akt, p-Akt, mTOR, p-mTOR, S6, and p-S6 protein levels were evaluated using standard IHC protocols of Cell Signaling Technology® (Danvers, MA, USA). After mounting on slides, the sections were deparaffinised and hydrated using a series of xylenes and alcohols. Supplementary Table 1 shows the detailed information regarding antibody-specific staining. For antigen retrieval using citrate, the slides were heated in a microwave submerged in citrate unmasking solution until boiling was initiated, and then incubated for 10 minutes at sub-boiling temperature (95°C−98°C). The slides were cooled on bench top for 30 minutes. When ethylenediaminetetraacetic acid (EDTA) was used for unmasking, the slides were heated submerged in EDTA unmasking solution in a microwave until boiling was initiated, and incubated further for 15 minutes at sub-boiling temperature. No cooling was necessary for these slides. Haematoxylin was used for nuclear counterstaining.
5. ISH
HER2 and HER3 amplifications were performed in all samples using silver ISH (SISH) and fluorescence ISH (FISH), respectively. DNA probes from Ventana® (Oro Valley, AZ, USA) and ZytoVision® (Bremerhaven, Germany) were directly labelled for detecting HER2 and HER3, respectively. The probes identified locus-specific sequences for the genes (17q12 and 12q13.2) and corresponding centromeres to detect gene amplification.
6. Evaluation of IHC and ISH
Protein expression was evaluated using a four-graded scale based on the revised guidelines of the American Society of Clinical Oncology/College of American Pathologists [13]: 1+, barely perceptible membrane staining in more than 10% cells; 2+, weak-to-moderate complete membrane with staining present in more than 10% tumour cells; 3+, strong complete membrane staining in more than 10% tumour cells. We classified 2+ as equivocal and 3+ as positive. An example of IHC evaluation is shown in Supplementary Fig. 1. For evaluating ISH, the ratio of detected gene to centromere ≥2.0 was considered as positive gene amplification and less than 2.0 as negative. These evaluations were performed independently by two different experienced pathologists.
7. Statistical analysis
Descriptive statistics was used to determine means and standard deviations for continuous variables. Mann-Whitney U test and students' t-test were used for determining differences between groups. The categorical variables were analysed using χ2 test or Fisher's exact test. Progression-free survival (PFS) was calculated from the time of surgery to the presence of disease progression. OS was defined as the time from surgery to the time of death. The survival analyses were calculated using the Kaplan-Meier method, and the log-rank test was used to confirm the statistical significance of differences between groups. Cox-proportional hazards for univariate and multivariate analyses were conducted to confirm the risk factors for poor prognosis. Statistical package for the social sciences 22.0 (IBM Analytics, Armonk, NY, USA) was used for the analysis.
RESULTS
1. Patient characteristics
The clinical characteristics of patients are shown in Table 1. The clinical stage was distributed equally in both early and advanced stages of cancer. The histological types of tumour were predominantly serous adenocarcinoma, followed by mucinous and endometrioid adenocarcinoma.
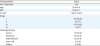
Table 1
Characteristics of 105 patients included in the study
2. Expression of HER2, HER3, and other markers
The protein levels and amplification of HER2 and HER3 are shown in Table 2. Most of the tumours showed concordant protein expression and gene amplification, with few exceptions. The concordance in the results obtained using IHC and ISH were 98.1% (103/105) for HER2 and 82.9% (87/105) for HER3. The expression of other markers is shown in Fig. 1. Several patients showed concordant expression of HER2 by both IHC and SISH, and even of HER3 by IHC. However, these patients showed negative HER3 status by FISH. The negative expression of p-Akt in IHC of all specimens is also noteworthy. IHC showed that the other markers were expressed in 9.5%–49.5% cases. Supplementary Fig. 2 shows the correlations between expressions of all markers included in the analyses. Expression levels of HER2 (IHC, SISH) and HER3 (IHC) correlated with each other and were concomitantly related to PI3K expression, although HER3 (FISH) did not show any correlation. Akt, mTOR, and S6 showed serial correlation with the HER pathway. However, we could not determine any relation between PI3K and other markers in the pathway.
Table 2
Results of IHC and in situ hybridization of HER2 and HER3

| HER2 | HER3 | ||||||
|---|---|---|---|---|---|---|---|
| IHC | SISH | IHC | FISH | ||||
| Expression | No. | Gene amplification | No. | Expression | No. | Gene amplification | No. |
| 3+ | 4 | + | 4 | 3+ | 12 | + | 1 |
| − | 0 | −* | 11 | ||||
| 1+ | 2 | +* | 1 | 2+ | 1 | + | 1 |
| − | 1 | − | 0 | ||||
| 0 | 99 | +* | 1 | 0 | 92 | +* | 7 |
| − | 98 | − | 85 | ||||
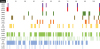
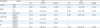
Fig. 1
Expression of all markers. In IHC of HER2 protein, 3+ and 1+ were marked with dark violet and violet, respectively. Dark green and bright green were used to show 3+ and 2+ on IHC of HER3 protein. In other markers, variable colours were used for protein expression or gene amplification. Empty slots are for negative findings.
FISH, fluorescence in situ hybridization; HER, human epidermal growth factor receptor; IHC, immunohistochemistry; SISH, silver in situ hybridization.
3. Survival analysis
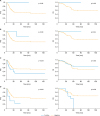
The median follow-up duration was 57.4 months. Disease progression had occurred in 47 (44.8%) patients and 33 (31.4%) had died at the time of analysis. Protein overexpression and amplification of HER2 did not influence disease progression or OS (Fig. 2). Similarly, HER3 expression assessed using IHC was not related to PFS or OS, and the positive result of HER3 by FISH showed correlation with poor PFS (p=0.035). The median progression interval was 16 months in the positive group vs. 32 months in the negative group. OS tended to be poor in the positive group, although it was not statistically significant (median OS: 51 months vs. 53 months, positive vs. negative). Other markers of the HER pathway were also analysed, and Akt, p-mTOR, and S6 overexpression were related to poor PFS (Supplementary Fig. 3). In addition, S6 was associated with poor OS.
Fig. 2
Survival analysis based on HER2 and HER3 expression levels. (A) HER2 expression determined using IHC. (B) Determination of HER2 amplification using SISH. (C) HER3 expression determined using IHC. (D) Detecting HER3 amplification using FISH.
FISH, fluorescence in situ hybridization; HER, human epidermal growth factor receptor; IHC, immunohistochemistry; OS, overall survival; PFS, progression-free survival; SISH, silver in situ hybridization.
4. Univariate and multivariate analysis
Univariate analysis of the potential prognostic factors revealed that elevated levels of cancer antigen-125 (CA-125), advanced stage of the disease, serous histology, and overexpression of S6 were associated with shorter PFS and OS (Table 3). HER3 amplification and positive Akt expression were also significantly related to poorer PFS. HER2 status (by either IHC or SISH) was not of prognostic value. All significant prognostic values were included in multivariate analysis, and increased CA-125 level, advanced stage, and positive HER3 status by FISH were still significantly associated with poorer PFS after adjusting other prognostic values (Table 4).
Table 3
Univariate analysis of clinical parameters
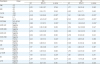
BMI, body mass index; CA-125, cancer antigen-125; CI, confidence interval; FISH, fluorescence in situ hybridization; HER, human epidermal growth factor receptor; HR, hazard ratio; IHC, immunohistochemistry; OS, overall survival; PFS, progression-free survival; SISH, silver in situ hybridization.
*p-value <0.05.
Table 4
Multivariate analysis of prognostic factors for PFS and OS
DISCUSSION
In this study, we evaluated HER2 and HER3 status in ovarian cancer using IHC and ISH. To the best of our knowledge, this is the first study investigating the correlation of their overexpression with survival of patients with ovarian cancer using two techniques. In our study population, the rate of HER2 positivity was 3.8% by IHC and 5.7% by SISH, which is similar to the results of previous studies [11141516]. The wide variation in HER2 positivity can be explained by differences in the detection techniques used (IHC or ISH) and sources of tissue (fresh or frozen, block or tissue microarray), and variations in IHC commercial products. In our study, HER2 status was not related to prognosis of ovarian cancer. Two previous studies that evaluated the correlation between HER2 status and survival of patients with ovarian cancer [617] showed no significant difference based on HER2 positivity. A recent meta-analysis reported poorer PFS and OS in HER2-positive tumours [18]; however, it included various types of detection assays and the method for survival analysis was inconsistent.
Regarding HER3 status, 12.4% specimens showed positive IHC staining and 8.6% showed amplification by FISH. Previous studies reported HER3 expression rate by IHC to be 3%–69% [101112] although no study had evaluated HER3 status using ISH in patients with ovarian cancer. Only one study has investigated the negative influence of HER3-positive status by IHC on survival of patients with ovarian cancer [10]. In our study, the HER3 status by IHC did not alter the prognosis of ovarian cancer. However, HER3 amplification in FISH was related to poorer PFS, and it was a significant risk factor even after adjusting for other parameters in multivariate analysis. The discordant expression of protein and gene can be explained by the dependency of HER3 protein level on HER2 status. Amin et al. [19] reported that HER3 signalling is regulated via redundant mechanisms in HER2-overexpressing breast cancer cell lines. Therefore, HER3 protein level might be altered by HER2 status independent of HER3 amplification. It is well-known that HER3 does not possess kinase activity and is dependent on other members of the EGFR family, mainly HER2 [2021]. These observations imply that the HER3 status may not always be coincident with protein expression. Possibly, the pathway of HER3 expression differs from that of other HER family members, which requires further investigations.
The HER pathway markers showed diverse expression rates, and markers functioning later in the pathway tended to be expressed more (mTOR, 47/105; p-mTOR, 52/105; S6, 52/105) than those functioning early (PI3K, 10/105; Akt, 24/105). This could be because the Akt-pathway is altered not only by HER family members, but also by other factors such as vascular endothelial growth factor, hepatocyte growth factor, platelet-derived growth factor, and insulin-like growth factor 1 [22232425]. However, the markers correlated with neighbouring markers within HER signalling pathway, except between PI3K and Akt. We also observed that HER3 status by FISH did not correlate with the expression of members of the PI3K/Akt/mTOR pathway, although HER3 expression by IHC and HER2 expression by both IHC and SISH showed association with PI3K. This also indicates that the pathway associated with HER3 activation and expression can be distinguished from that of HER2. Furthermore, p-Akt was not expressed in any sample, which is similar to that of another study showing that p-Akt expression was negative in all specimens of breast cancer [26]. The author of that study commented that excessive loss of phosphostaining can occur during the routine fixation of resected specimens. Specific manoeuvers might be necessary to allow rapid fixation of excised tissues and accurately determine expression in ovarian cancer samples.
Our study has several limitations. First, selection bias might exist because of the retrospective nature of the study design. The population of this study was not consisted of consecutive patients, so the distribution of disease stage does not follow that of real-world population. This could be due to the exclusion of non-optimally debulked cases in the selection of the materials. It also could be the reason that the relationship between HER2 expression and the disease outcome in this study is different from the result of previous meta-analysis [18]. Second, the block numbers that were positive for HER2 and HER3 are relatively fewer than those that were negative. However, we have used both IHC and ISH to reduce subjective interpretation of IHC. In addition, the IHC, SISH, and FISH analyses by pathologists can be considered objective because of the high concordance of HER2 expression with gene status. Third, we did not perform any molecular analysis of the pathway markers, and hence the discordant relationship between HER3 gene and protein expression levels cannot be explained. Additional experiments for defining the underlying mechanisms are currently underway. Finally, we used TMA blocks for analysis, and hence the characteristics of entire tumours cannot be extrapolated from these results.
Several clinical investigations have evaluated whether the anti-HER3 therapy can be effective in treating various types of malignancies. In addition to using mono-specific mAbs targeting HER3 [27], bi-specific antibodies [282930], bi-specific ligand traps for EGFR-HER3 [3132], HER3-locked RNA inhibitors [33], anti-HER3 vaccines [34], and small molecule inhibitors for pseudokinase HER3 [35] are being considered as feasible treatment modalities. Most studies using mAbs have targeted breast cancer and non-small cell lung cancer [36373839], whereas only one study evaluated seribantumab (MM-121, a human immunoglobulin antibody that targets HER3, blocks heregulin binding, and downregulates the receptor) in combination with paclitaxel in treating refractory ovarian cancer [40]. In that study, the addition of seribantumab to paclitaxel did not improve PFS; however, the patients were from an unselected population. Specific investigations comparing the efficacy of target treatment according to the status of HER3 expression would therefore be necessary.
In conclusion, this is the first study to evaluate HER2 and HER3 status using both IHC and ISH in ovarian cancer tissues. Amplified HER3 in FISH was associated with poor PFS, and this was a significant risk factor for shorter progression in multivariate analysis. Unlike HER2, HER3 showed discordance between gene amplification and protein expression. This implies that the HER3 signalling pathway can be distinguished from that of HER2, but further studies with larger samples, including additional molecular analysis, are warranted to determine the exact role of HER3 in ovarian cancer. The possibility of targeted therapy in patients with HER3 alteration should be evaluated for development of new treatment strategies for ovarian cancer.
 XML Download