

 PDF
PDF ePub
ePub Citation
 Print
Print


INTRODUCTION
Orthodontic-orthognathic surgery (OGS) is the primary treatment option for skeletal Class III patients with facial asymmetry. The goal of the treatment is not only to improve facial esthetics and functional occlusion, but also to achieve recovery of the stomatognathic system. Facial asymmetry is known to affect the function and structure of the stomatognathic system, and it causes imbalances in bite forces, electromyography (EMG) activity levels, muscular thicknesses, chewing patterns, and condylar paths.12345
Although OGS corrects the skeletal frame, it is unclear whether adaptation of muscles or jaw movements occurs directly as a result of the surgery. The muscles are detached and spontaneously reattached during surgery, causing reversible atrophy of the muscles, and they recover with morphological adaptation that includes changes in the muscle length or direction.6 However, it is not clear whether these morphological changes in the masticatory muscle simultaneously induce functional changes. A recent review article showed that masticatory efficiency at 3 months after surgery was greater than that observed preoperatively, and the increase was significant at 6 months after the surgery.7 However, the occlusal force was lower in Class III surgery patients than in normognathic patients even at 2 years after surgery. With respect to jaw movement, three-dimensional movement of the distal segment would inevitably lead to unpredictable movements of the condyles. Therefore, it is difficult to anticipate the exact changes in jaw movement patterns after OGS.
Several studies have evaluated the changes in muscle activity and jaw movement after OGS. Trawitzki et al.89 found an increase in the EMG activity of masticatory muscles after surgical corrections in Class III patients; however, the activity was still lower than that in subjects with normal occlusion at 3 years after OGS. Others also reported that the EMG activity levels of the masseter and temporalis muscles recovered to the presurgical levels at 6 months after OGS.1011 Previous studies have reported that surgical correction in skeletal Class III patients improved the balance of masticatory muscles on both sides and changed the temporalis-dominant pattern to the masseter-dominant pattern.1213 Wang et al.14 reported that the mandibular movement tracings in skeletal Class III patients changed to become similar to those in the control group 6 months after OGS. Kubota et al.13 also reported that OGS improved the masticatory chewing pattern in Class III patients. However, others have shown that there were no significant changes in the masticatory rhythm and chewing pattern after OGS in Class III patients.1516
To date, most studies focused on studying the functional recovery with respect to sagittal malocclusion, whereas very few studies have assessed the transverse malocclusion or asymmetry. Moroi et al.17 evaluated changes in the bite force and occlusal contact area after OGS in mandibular prognathism with and without asymmetry. The asymmetry group showed an improved balance in the bite force after surgery, but they also tended to show a delay in bite force recovery compared with that in the symmetry group.
The aim of the present study was to evaluate the changes in masticatory muscle activity and mandibular movement pattern after OGS in skeletal Class III patients with facial asymmetry. The hypothesis is that in Class III asymmetry patients, OGS interventions could improve muscle activity and jaw movement patterns, which eventually could yield similar results to those obtained in Class III patients without asymmetry.
MATERIALS AND METHODS
Subjects
Skeletal Class III adult patients who had visited the Kyung Hee University Dental Hospital for OGS treatment were enrolled. The inclusion criteria were as follows: 1) skeletal Class III patients with A point-Nasion-B point (ANB) < 0° requiring two-jaw surgery; 2) presence of all dentition; 3) absence of craniofacial deformities and systemic diseases; 4) no signs or symptoms of temporomandibular disorder; and 5) absence of centric occlusion (CO)-centric relation (CR) discrepancy.
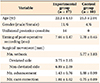
A total of 27 patients were recruited, and they were divided into two groups on the basis of the degree of facial asymmetry: the experimental group (n = 17 [11 male and six female]; mean age, 22.2 ± 4.1 years) who had a menton deviation of more than 4 mm, and control group (n = 10 [four male and six female]; mean age, 21.5 ± 2.0 years) with a menton deviation of less than 1.6 mm (Table 1). The sample size was determined with reference to Kubota et al.'s study.13
The study design was approved by the Institutional Review Board of Kyung Hee University Dental Hospital (IRB No. KHD IRB 1612-5), and all patients provided written informed consent. The demographic data are shown in Table 1. The T1 (7 to 8 months after OGS) time-point was selected because masticatory efficiency and jaw movement have been reported to recover at 6 months after OGS.10111213
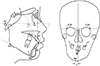
Cephalometric measurements
Lateral and posteroanterior cephalograms were acquired before treatment (T0) and T1. Five angular parameters and one linear parameter were measured (Figure 1). After OGS, sella-naion-A point (SNA), sella-nasion-B point (SNB), ANB, and lower incisor-mandibular plane angle (IMPA) changed significantly in both groups, while menton deviation significantly decreased in the experimental group (p < 0.001) (Table 2).
Electromyography analysis
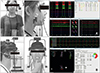
The EMG activity levels of both anterior temporalis muscles (TA) and superficial masseter muscles (MM) were calculated at T0 and T1 in four different states: resting, maximum clenching, anterior cotton roll biting, and posterior cotton roll biting. Before attaching the bipolar EMG electrodes to the muscles, the subject's skin was prepared by cleaning it with 70% isopropyl alcohol. All muscle electrodes and a reference electrode were connected to an EMG amplifier (BioEMG III™; BioResearch Inc., Milwaukee, WI, USA) (Figure 2A). In order to place the electrodes over the MM, the gonion (Go) and the body of the zygomatic bone were both identified by palpation. The muscle line was drawn joining Go to the mid-point between the lower posterior border of the zygomatic bone and the zygomatic arch. The reference point was identified at 40% of the length of the muscle line from Go. The electrodes for TA were placed just above the upper edge of the zygomatic arch, posterior to the vertical line (the bony prominence formed by the zygomatic process of the frontal bone and the posterior limit of the frontal process of the zygomatic bone), and anterior to the scalp.18
The raw data obtained from each muscle were converted into relative ratio parameters because EMG activity shows inter-individual variability.1 In order to quantify the asymmetric masticatory muscle activity, an asymmetry index was calculated for each subject from the averaged TA and MM potentials. The formula is as follows:

(control group)
R, Right; L, left

(experimental group)
N, Non-deviated; D, Deviated
Positive values of the asymmetry index indicated a stronger right-sided muscle activity in the control group or a stronger non-deviated side muscle activity in the experimental group.
The relative contributions of the TA and MM on both sides were evaluated using an activity index. The formula is as follows:

(both groups)
R, Right; L, left
Positive values of the activity index indicated MM-dominance and negative values indicated TA-dominance.
Jaw movement analysis
The mandibular incisor movements were recorded and digitized using a magnetic incisor-point tracker (JT-3D™; BioResearch Inc.) during a range of motion (ROM) test (maximum opening, protrusion, and lateral excursions) and during unilateral gum chewing. Electrognathography (EGN) was performed using a magnet attached to the labial vestibule below the mandibular incisors. The EGN headset was placed on the head and aligned to the magnet (Figure 2B).
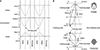
To record the excursive ROM of the mandible, the subjects were instructed to open the mouth as wide as possible; then to hold it (maximum opening); and then slide the mandible forward or laterally as far as possible (protrusion and lateral excursion, respectively). The average chewing pattern (ACP) was determined from records of 10 to 20 cycles of gum chewing. After softening one full stick of gum, the chewing patterns over 20 cycles were recorded on the left and right sides. The first cycle was automatically ignored because the bolus is usually excessively manipulated into position before the first closure. The partially automated analysis divided the chewing tracing into 15 individual chewing cycles, which were then averaged to create the ACP (Figure 3).
Statistical analysis
The normality of the data distribution was confirmed by using the Shapiro-Wilk test. Every variable was measured twice two weeks apart by the same examiner (H.S.P.). Intra-class correlation coefficients calculated at T0 and T1 for each variable ranged from 0.95 to 1.00. The intergroup differences in age and gender distribution were assessed using the independent t-test and chisquared test, respectively, and they were not statistically significant.
Intergroup comparisons of cephalometric measurements, EMG activities, and jaw movement variables were performed using the independent t-test or Mann-Whitney U test based on the normality of the data. Intragroup comparisons between T0 and T1 in both groups were performed using the paired t-test or Wilcoxon signed rank test based on the normality of the data. In the control group, the measurements on the left and right sides were pooled together because the differences between the two sides were not significant. A p-value < 0.05 was considered statistically significant.
RESULTS
Electromyography analysis (Table 3)
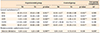
The EMG potentials of TA and MM after OGS showed no significant differences in the resting, clenching, and posterior cotton roll biting states in both groups. The activity index changed significantly only during anterior cotton roll biting in both groups (experimental group, p < 0.01 and control group, p < 0.05). In the control group, the TA potentials significantly decreased during anterior cotton roll biting (p < 0.01), which resulted in conversion of the activity index from a negative value to a positive one. The intergroup comparison showed that the changes in the asymmetry indices and activity indices were not significantly different between the groups.
Jaw movement analysis
Range of motion (Table 4)
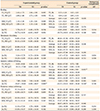
In the experimental group, the amount of maximum opening decreased significantly after OGS at the vertical, slant, and lateral to deviated side dimensions (p < 0.05, p < 0.01, and p < 0.05 respectively). The amount of protrusion and lateral excursion to the non-deviated side also significantly decreased (both p < 0.01). In the control group, only the amount of lateral excursion significantly decreased (p < 0.05). The intergroup comparison showed that the amount of lateral excursion to the non-deviated side was significantly greater than that in the control group at T0 (p < 0.01), and it decreased significantly after OGS (ΔT, p < 0.05).
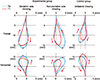
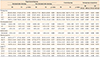
Average chewing pattern (Table 5 and Figure 4)
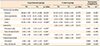
None of the variables showed differences after OGS in the control group and the deviated side in the experimental group. During chewing on the non-deviated side in the experimental group, the length of the turning point tended to be shorter and had significantly moved medially (p < 0.05). The intergroup comparison at T0 showed that all timing variables were significantly greater in the experimental group (p < 0.05). The vertical length of the turning point and the lateral width of the ACP were significantly greater during chewing in the non-deviated side in the experimental group than in the control group at T0 (p < 0.05).
DISCUSSION
Electromyography analysis
The differences in muscle activity between the non-deviated and deviated sides in asymmetry patients are a matter of debate. Some authors have reported that the MM on the deviated side was less active than that in controls,19 whereas others have reported greater EMG activities on the deviated side than on the non-deviated side.20 They also showed that the asymmetry indices were significantly greater in asymmetry patients than in controls.20
In skeletal Class III patients, the myoelectrical activity of TA and MM was lower than that in subjects with normal occlusion.892122 In our study, the mean EMG potentials of TA and MM were below 50 µV during the clenching and biting tests, whereas the normal value during clenching was over 100 µV. Seven to eight months after OGS, the EMG variables had returned to the preoperative levels; however, they did not reach the normal occlusion levels in both groups.
Regardless of the presence of skeletal asymmetry, skeletal Class III patients are known to have TA-dominant masticatory activities.89132122 This reflects the morphologic characteristics and the muscular action axis of skeletal Class III patients, who have well-developed mandibular bodies and rami.19 An increase in the gravitational components of the masticatory muscles may cause an increase in the TA activity in patients with Class III malocclusion or with a hyperdivergent pattern.23 In the present study, the TA-dominant masticatory activities, except in the anterior cotton roll biting, were maintained 7 to 8 months after OGS. On the other hand, Kubota et al.13 and Frongia et al.12 have reported that the activity indices shifted from TA-dominance before surgery to MM-dominance after treatment; these observations probably resulted from the longer follow-up periods than that in our study.
Anterior cotton roll biting is known to inhibit excess contraction of the elevator muscles.24 This is accordance with the Roth's power centric technique, in which the anterior teeth with the jig act as a fulcrum, the MM works dominantly, and the condyle seats in the CR position.24 The TA runs vertically and slightly posteriorly, whereas the MM acts vertically and anteriorly. Therefore, the more the occlusion is in the forward direction, the more active the MM becomes. The results of the anterior cotton roll biting test showed that the sagittal skeletal correction is likely to have greater influence on the activity index than the asymmetry correction.
Jaw movement analysis
The ROM almost returned to the presurgical level at 7 to 8 months after OGS in the control group, whereas it did not return completely in the non-deviated side in the experimental group. Interestingly, lateral excursion to the non-deviation side decreased significantly in our study. Internal rotation of the condyle and a decrease in the frontal ramal angle in the non-deviated side may limit the range of lateral excursion to the non-deviated side.2526 Teng et al.27 showed that the mandibular movement was about 77.5% to 145.7% of the presurgical levels at 6 weeks after OGS, and it reached or even exceeded the presurgical levels at 6 months after OGS when accompanied with physiotherapy, which would facilitate early recovery in the ROM and muscular balance between the deviated and non-deviated sides or the synergy between TA and MM.
In the ACP of the non-deviated side in the experimental group, the turning point significantly moved medially and the vertical length was shortened; these parameters became similar to those on the deviated side in the frontal and horizontal views. The grinding-type chewing pattern did not change. Ueki et al.16 have reported that there were no significant differences in the chewing path between the symmetry and asymmetry groups. Although Takeda et al.15 also reported no significant differences in the cycle time, they observed that the masticatory pattern changed from the reverse or chopping pattern to the grinding pattern in skeletal Class III patients with unilateral posterior crossbite.
The clinical implication of this study would be as follows: the skeletal Class III patients without asymmetry recovered their muscle activity, range of jaw motion, and ACP up to their presurgical level at 7 to 8 months after OGS. However, skeletal Class III patients with asymmetry showed unique characteristics for recovery of jaw movement to the non-deviation side. Both clinicians and patients should be aware of the fact that the range of jaw movement to the non-deviation side or the unilateral chewing trajectory on the non-deviation side would decrease. In addition, the asymmetrical activity of the muscles before surgery was maintained at 7 to 8 months postoperatively, which would result in unfavorable bone remodeling after surgery. In cases with significant muscular imbalance, adjunctive procedures such as botulinum toxin injection should be considered.
The limitations of this study are the small sample size and the relatively short follow-up period. Functional recovery of asymmetry patients should be evaluated with a larger sample size and long-term follow-up data in future studies.
CONCLUSION
• In skeletal Class III patients with facial asymmetry, the characteristics of EMG activity recovered to the presurgical levels within 7 to 8 months after OGS. The masticatory muscle activity changed to the MM-dominant pattern only during anterior cotton roll biting.
• The ROM including maximum opening, protrusion, and lateral excursion to non-deviated side did not fully return to the T0 level in the experimental group.
• The ACP on the non-deviated side was shorter and centralized after OGS.
 XML Download