

 PDF
PDF ePub
ePub Citation
 Print
Print


INTRODUCTION
Facial aesthetics play a key role in social communication and interaction among human beings.1 Therefore, patients with dental and/or skeletal malocclusion often seek improvements in facial aesthetics through orthodontic treatment. To achieve a better sagittal profile, extraction orthodontic treatment is performed to relieve lip protrusion, which has proven to be rather effective. Numerous studies have explained the effects of orthodontic treatment on the facial profile and confirmed the correlation between anterior teeth retraction and lip-protrusion reduction.234
In addition to the changes in sagittal lip position, the lip vermilion also shows morphological changes during retraction of anterior teeth. The lip vermilion is a prominent facial feature because of its vibrant color in contrast to facial skin and thus plays a key role in the frontal facial aesthetics.5 The lip vermilion shape and proportion are therefore aesthetic determinants for both orthodontists and patients.67 However, lip-protrusion reduction may occasionally not guarantee a facial aesthetic improvement from the frontal view. Unlike the position changes in lips, the specific relationship between lip vermilion morphological changes and incisor retraction has not been well explained yet. Since the lip retracts in extraction treatment, how will the vermilion shape change correspondingly? Will these morphological changes in the vermilion improve facial aesthetics?
Many scholars have noted the aesthetic importance of lip vermilion morphology and showed that the vermilion profile changes with changes in the incisor position by using two-dimensional (2D) methods.89 Nevertheless, the actual border of the lip vermilion cannot be seen from the lateral view, indicating the difficulty in describing lip vermilion changes using lateral cephalograms or photographs. In the study by Trisnawaty et al.,10 lip vermilion height and area were found to decrease significantly after extraction treatment using frontal photographs. However, the information provided by 2D photographs was quite limited. The lip vermilion changes are not confined to changes in height and projected area. Thus, it is difficult to describe the morphological characteristics and exposure of a tridimensional entity using bidimensional index. Furthermore, the shooting angle and head position greatly affect the measurement precision of 2D photographs. Thus, the lip vermilion needs to be studied three-dimensionally.
The tremendous progress in three-dimensional (3D) facial imaging devices and techniques has facilitated comprehensive and accurate measurements of 3D lip vermilion morphology. Using stereophotogrammetry, 3D measurements of aspects such as curve length, curvature, and superficial area can be easily obtained.11 A few studies analyzed the overall 3D facial structures of Asian adult females and demonstrated significant differences in lip vermilion curvature and shape between females who were considered to appear attractive and those whose appearance was considered average.712 Several studies have explored the facial soft tissue changes during orthodontic treatment by using 3D facial scanning and confirmed that the lip vermilion is the area that changes most after orthodontic treatment among the whole face.1314
In orthodontic treatment, it may be possible to improve facial appearance by improving lip aesthetics through anterior teeth movement, including anterior-posterior movement as well as incisor torque changes. However, the specific changes in the 3D morphology of the lip vermilion and the correlation between anterior teeth changes and lip vermilion changes have not been clearly defined in previous studies. Thus, it is difficult to predict the post-treatment vermilion morphology on the basis of an orthodontic treatment plan.
This study aimed to assess the 3D lip vermilion morphological changes after extraction and non-extraction orthodontic treatment in female adult patients by using 3D facial scans and explore the correlation between lip vermilion changes and incisor changes.
MATERIALS AND METHODS
Subjects
This was a retrospective study. The participants for this study were recruited from among consecutive patients during their initial visits to the Department of Orthodontics, Peking University School and Hospital of Stomatology, Beijing, China.
Inclusion criteria were as follows: (1) Chinese female adults aged 18 to 26 years at the beginning of the treatment; (2) A point-Nasion-B point angle > 0°; (3) overall good health; (4) body mass index in the range of 18 to 24 kg/m2; and (5) no obvious facial asymmetry.
Exclusion criteria were as follows: (1) Previous orthodontic treatment; (2) anterior or posterior crossbite; (3) cleft lip and palate or other craniofacial syndromes; and (4) defects of dentition.
The participants were divided into three groups according to the orthodontic treatment they required. Patients requiring the extraction of four first premolars (PM1) and orthodontic mini-implants for maximum anchorage control, as necessitated by lip protrusion, were enrolled as the maximum anchorage group (G1). Lip-protrusion patients requiring the extraction of four PM1 without mini-implants were enrolled as the moderate anchorage group (G2). Finally, patients requiring non-extraction treatment for mild crowding or mild spacing were enrolled as the non-extraction group (G3).
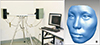
An initial sample of 18 patients in the G1, 16 patients in the G2, and 13 patients in the G3 was recruited after obtaining written informed consent. The study was reviewed and approved by the ethics committee of Peking University School and Hospital of Stomatology (IRB number: 201631134). Complete pre- and post-treatment records, including cephalometric radiographs, photographs, plaster models, and 3D facial scans acquired using a 3D structured light scanning system (accuracy, ± 0.05 mm, 3D CaMega; Boweihengxin Technology Inc., Beijing, China), were available for each patient (Figure 1A). The subjects were asked to relax their lips and surrounding muscles during facial scans.
All patients were treated with the same fixed appliances (0.022 × 0.028-inch bracket slot, Roth prescription; Xinya, Hangzhou, China) for at least 12 moths. Anchorage control in the G1 was achieved by self-tapping orthodontic mini-implant (1.6 × 11 mm; CB, Ningbo, China) inserted between the second premolar and first molar.
3D evaluation of lip vermilion was conducted using the reverse engineering software Rapidform 2006 (Inus Technology, Seoul, Korea) (Figure 1B).
Three-dimensional lip evaluation
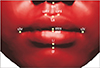
To ensure the accuracy of the measurements, the 3D facial scans were superimposed and the midsagittal plane was set first using the following steps: (1) Initial registration of pre- and post-scans was performed using five landmarks (bilateral outer and inner canthi points, and pronasale point). (2) Regional registration was accomplished on the basis of the frontal-nasal-zygomatic region. (3) The midsagittal plane was set on pretreatment images, which was perpendicular to the line connecting the bilateral outer canthi and passed through the pronasale point. Ten facial landmarks (Figure 2) were marked on the 3D image, including six landmarks on the midsagittal plane (subnasale [Sn], labiale superius [Ls], labiale inferius [Li], stomion superius [stos], stomion inferius [stoi], and the soft B-point [B']) and two bilateral landmarks (bilateral chelion [chr, chl] and bilateral crista philtra [cphr, cphl]). The face scan can be switched from the STereoLithography format (without color information) to the OBJ format (color information included) at any time in Rapidform 2009 software (Inus Technology) while identifying the 3D landmarks. The morphology and color contrast together may allow improvement of both the accuracy and reproducibility of 3D lip landmarks.
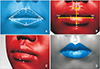
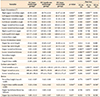
Nine angles and seven linear dimensions (including four curve length measurements and three straight-line distances) were measured on 3D images (Table 1 and Figure 3). The superficial areas of the upper and lower vermilion were measured (Figure 3D). Four ratios were calculated as follows: vermilion height/mouth width, Cupid's bow width/mouth width, upper lip fullness/lower lip fullness, upper lip area/lower lip area.
Cephalometric analysis
Lateral cephalograms were obtained before and after orthodontic treatment with the lips in the relaxed position. Dental position (U1-NA, L1-NB, U1-AP, L1-AP) and angulation (U1/NA, U1/SN, U1/PP, U1/FH, L1/MP, L1/NB, U1/L1) were evaluated on lateral cephalograms before and after treatment.
Statistical analysis
Data were analyzed using SPSS software (version 19.0; IBM Corp., Armonk, NY, USA). Each lip measurement was obtained by a single operator twice, and the average values were used. Ten facial scans were randomly picked and measured once again after 2 weeks by a single operator. Intraclass correlation coefficients of all the lip vermilion measurements were greater than 0.9. A normal distribution was confirmed using the Shapiro-Wilk test, kurtosis, and skewness. The paired t-tests were performed to evaluate the changes during orthodontic treatment. Analysis of variance (ANOVA) was performed to compare the pre- and post-treatment values among three groups. Pearson correlation coefficients were calculated to assess the association between incisal changes and vermilion changes. Stepwise regression analysis was used to determine the combination of variables that could predict lip vermilion morphological changes during orthodontic treatment.
RESULTS
Age and treatment duration
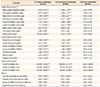
As shown in Table 2, the treatment duration in G1 and G2 was significantly longer than that in G3.
Pretreatment lip vermilion morphology
ANOVA showed a significant difference in pretreatment lip vermilion values among the three groups (Table 3). G1 had a significantly greater upper vermilion angle, vermilion height, vermilion fullness, Cupid's bow width, vermilion superficial area, vermilion height/mouth width ratio, and Cupid's bow width/mouth width ratio, followed by G2.
Lip vermilion changes
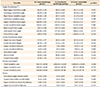
Lip vermilion changes that occurred during orthodontic treatment are shown in Table 4. As shown in Figures 4 and 5, vermilion measurements changed significantly in G1 and G2. The total vermilion area decreased by 20.84 ± 5.81% in G1 and 13.88 ± 2.52% in G2. No variable changed significantly in G3, as shown in Figure 6.
Post-treatment lip vermilion morphology
There was no significant difference in post-treatment vermilion dimensions among the three groups (Table 5).
Relationship between incisor position and lip morphology
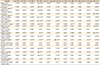
We found significant correlations between incisor changes and lip vermilion changes. As shown in Table 6, the changes in upper incisor inclination (U1/PP) showed the strongest correlation with vermilion angle change, central bow angle change, lower lip vermilion fullness change, and vermilion area change. Changes in the upper vermilion fullness and upper lip curve length were the most relevant to the incisor angle change (U1/L1), and the vermilion height change was the most relevant to upper incisor position change (U1-AP). Description of the variables used in this study are depicted in Table 6.
Prediction of lip vermilion changes
Stepwise regression models were set up at 5% level of significance to predict the vermilion changes using incisor change variables. Only regression models providing more than 45% of the vermilion variable changes were reported in Table 7.
DISCUSSION
In a previous study, lip vermilion dimensions were often measured on 2D frontal photographs. However, it is difficult to describe the morphological characteristics and exposure of the lip vermilion using bidimensional indexes. To truly reflect lip vermilion morphology, we introduced a series of 3D indexes. In the current study, the vermilion angles, height, fullness and surface area represented the actual exposure and richness of the lip vermilion, which decreased significantly after extraction of four premolars and retraction of incisors. The total vermilion surface area decreased from about 254 mm2 (20.84%) in the G1 to 161 mm2 (13.9%) in the G2, representing a significantly smaller lip vermilion after extraction treatment. This result was in accordance with clinical observation as well as previous 2D studies,10 in which vermilion height and area decreased significantly after orthodontic treatment, and can be easily explained. A significant increase in the upper lip curve length in the extraction cases suggested that lip tension reduced after treatment. It can be speculated that while retracting the incisor, the lips moved posteriorly and rotated inward, exposing less of the lip vermilion, since the anterior teeth retraction altered the tension of the lips. These results were consistent with the few previous studies exploring 3D lip vermilion changes during orthodontic treatment,1415 in which both backward and vertical movements of the lips were observed, and the lip vermilion area was demonstrated to be the most sensitive area in the whole face during extraction and non-extraction treatment. However, previous 3D studies paid more attention to the 3D changes in single landmarks and less attention to the changes in lip vermilion measurements and indexes. Therefore, 3D lip vermilion morphology changes have not been clarified in previous studies.
Vermilion height greatly affects the assessment of lip esthetics.56 In our study, we found that extraction patients tended to have bigger and thicker lip vermilion before treatment, which was reportedly less attractive in contrast to those in non-extraction patients.6 Previous 3D studies have found that the esthetic vermilion height of Asian adult females should be in the range of 15 to 19 mm.121617 Wong et al.17 analyzed the facial structures of Asian females using 3D facial data and reported the standard value of vermilion fullness: 8.5 mm for the upper lip and 9.4 mm for the lower lip. Our results suggested that extraction treatment might decrease the vermilion height and fullness toward the standard values, improving the facial aesthetics, and the post-treatment vermilion shape was approximately the same among all three groups.
Despite the lip exposure changes, the shape of the lip vermilion also changed. The vermilion height/width ratio decrease indicated that the lip vermilion changed from round to slender. Although a full and rounded vermilion is considered to be attractive, which could be related to age-related features that signal youthfulness and fertility,18 there was an upper acceptable limit of vermilion height-width ratio. The ideal vermilion height-width ratio in Chinese females ranged from 33% to 38% in previous studies.161920 In our present study, vermilion height-width ratio of extraction groups decreased into the aesthetic range, proving that extraction treatment probably had positive effects on lip proportion aesthetics. Furthermore, it is worth noting that the central bow angle significantly decreased toward the aesthetic standard values17 in extraction cases. Shi et al.21 evaluated the frontal photographs of Chinese females and found that the esthetic central bow angle should approach both sides of the Cupid's bow angles and the three angles' appearance should be bilateral symmetrical “M” type. According to our results, the Cupid's bow angles remained unchanged but the central bow angle decreased toward the Cupid's bow angle, which means that the superior border of the lip vermilion tended to be more harmonious after extraction treatment. This result also indicates that the central bow angle might be an important indicator in 3D facial aesthetic diagnosis as well as orthodontic treatment planning.
However, some indexes cannot be assessed in orthodontic treatment, even though they are crucial to the lip vermilion aesthetics. The appropriate ratio between the upper and lower lips is of great importance in facial harmonious beauty.1617 Kim et al.7 reported that the average upper-lower vermilion area ratio in frontal photographs of Miss Korea was approximately 0.75, which was obviously smaller than that in the general population (0.85). However, the upper/lower vermilion area and fullness ratio remained unchanged in our current study. We can speculate from our results that the upper/lower lip ratio is difficult to change by extracting four PM1. Although there is no comparability between our 3D measurements and Kim et al.'s 2D study,7 this is an indication that assessment of other extraction patterns, such as mono-maxillary extraction, might be needed when we attempt to improve the upper/lower lip ratio.
The non-extraction group we enrolled in this study showed mild spacing or mild crowding; thus, the changes in their anterior teeth position were minimal, so we can regard the non-extraction group as a control group. Thus, the conclusion that non-extraction treatment has little influence on lip vermilion is only suitable for cases with mild crowding or spacing. In Kim et al's study,22 incisor movement was stimulated by labial covered films, and a significant vermilion height increase was found, indicating that in the non-extraction cases with severe dentition crowding, the lip vermilion changes might be opposite to extraction cases when incisors flared.
The lip vermilion change was bigger in the G1 than that in the G2. Moreover, significant reductions in the Cupid's bow width and Cupid's bow width/mouth width ratio were only found in the G1, and the Cupid's bow width approached the aesthetic standard value12 through treatment. It seems that the vermilion changes vary considerably with the incisor variables.
Therefore, our study further investigated the relationship between incisor movements and vermilion morphology changes. Significant correlations were found between incisor changes and vermilion angles, fullness, and area and height changes. The results seemed inconsistent with Trisnawaty et al.'s study,10 which reported moderate correlation between lip vermilion height and incisor retraction, but no significant correlation between the lip area reduction in frontal photographs and incisor retraction in his study. However, 3D facial scans provided more comprehensive information over 2D graphs. The lip vermilion, in essence, is a curved surface; thus, the vermilion area value shows more sensitivity in 3D measurements, and that might be a reason why our present study produced different results. Among the incisor measurements, we found that changes in the upper incisor angle (U1/PP) were most relevant to vermilion angles, central bow angle, and surface area changes. The correlation coefficient between upper incisor angle changes and the vermilion area change was rather strong (upper vermilion area: 0.791, lower vermilion area: 0.671, and total vermilion area: 0.838), indicating a strong positive correlation between upper incisor torque change and vermilion area change. It is worth mentioning that the upper lip curve length, which is closely related to frontal aesthetic and the degree of lip incompetence, showed the strongest positive correlation with interincisal angle change (U1/L1) and no significant correlation with upper incisor sagittal position (U1-AP and U1-NA), which could be an indication that the upper incisor position change might have little effect on upper lip curve length, and the incisor torque change might be a determining factor of upper lip length change instead. With regard to lip vermilion fullness, bimaxillary incisor variables (U1/PP, U1/L1, L1-AP) showed rather strong correlations with vermilion fullness change. We could speculate that lip vermilion fullness was dependent on bimaxillary incisor changes over mono-maxillary incisor changes. The vermilion height and height-width ratio showed a stronger correlation with the distance from incisors to “A point-Pogonion (APo)-Line,” suggesting that the retraction of both upper and lower incisors may be associated with the thinning of lip vermilion. In general, upper incisor movement played a dominant role in the lip vermilion esthetics according to our results. As for the lower incisor measurement, L1-AP showed an apparently stronger correlation with the lip vermilion changes than other lower incisor indexes. This result indicated that the relative position of the lower incisor to the APo plane might be more important than its inclination when we evaluate the vermilion change. Proper positioning and inclination of the upper incisor may well be critical to vermilion attractiveness, which reminded us to pay close attention to torque control while upper teeth retraction in clinical practice.
The stepwise regression provided clinicians a reference to estimate the vermilion response using incisor factors and further confirmed the predominant role of the maxillary incisor change in determining both upper and lower vermilion changes in eight vermilion variables predicted by changes in upper incisor inclination (U1/PP), of which the total vermilion surface area was the most predictive factor among all variables. Based on our prediction models, appropriate control of upper incisor torque in orthodontic treatment is beneficial for improvement of lip vermilion aesthetics. In other words, the desired vermilion change (especially the vermilion area change) must be taken into consideration before moving anterior teeth. However, this result should be interpreted with caution, because none of the R-square values were greater than 0.8.
The limitation of the present study was the rather small sample size in each group. It might not be suitable to simply extend the results to other patients with different malocclusions or different treatment methods. To make predictions of vermilion esthetic changes according to incisor changes and extraction models, a larger sample size would be needed in further studies. Note that the treatment time discrepancy was obvious between non-extraction and extraction cases; thus, aging effects might have contributed to the marked differences in vermilion changes.23 Control groups of untreated patients might be needed in further studies. In addition, the masticatory muscle atrophy occurring over the treatment duration may also be a possible influencing factor, which requires further verification.
CONCLUSION
1. The lip vermilion was significantly smaller and thinner after extraction orthodontic treatment. The lip vermilion height, height-width ratio, and Cupid's bow angle decreased toward the esthetic standards. Non-extraction treatment had no influence on vermilion morphology.
2. The ratio between the upper and lower lip vermilion remained unchanged during non-extraction cases and the cases in which the first four premolars were extracted.
3. There were certain correlations between incisor changes and vermilion changes. Upper incisor changes played a dominant role in both the upper and lower lip vermilion changes. The changes of U1/PP (°), U1/L1 (°), U1-AP (mm) and L1-AP (mm) might have certain predictability to vermilion morphology changes.


 XML Download