

 PDF
PDF ePub
ePub Citation
 Print
Print


INTRODUCTION
Age-dependent decline in muscle mass and strength is one of the remarkable public health concerns due to its adverse consequences including functional limitations and disabilities, increased risk of falls in older people, morbidities and all-cause mortality [12]. Some related factors with impaired muscle strength are low physical activity, nutritional deficiencies and chronic diseases. Recently, the interaction between fat and muscle mass has attracted increased interest [34].
Excess body fat mass, known as overweight or obesity, is one of the major public health challenges which since 1980, adults aged 20 years and older in 199 countries and territories have been doubled [56]. Increasing central adipose tissue which is the most metabolically active adipose tissue may reduce a muscle function through a complex interplay of factors such as enhanced levels of inflammatory mediators and insulin resistance [7].
There is some evidence that muscle strength and low hand grip strength as a proxy for general muscle strength, have been inversely associated with age-related unhealthful weight gain, excessive abdominal fat and obesity-related comorbidities [891011]. However, in this area of investigation, there is a lack of consistency between studies. In two British cohort studies, grip strength was positively associated with body mass index (BMI), while it was negatively associated with central obesity measured using waist circumference (WC) [911]. The other adverse consequences of adipose tissue in the visceral area are the increasing risks of obesity-related metabolic disorders such as dyslipidemia, metabolic syndrome, type 2 diabetes and cardiovascular diseases [121314]. Some studies reported that there is a relationship between muscle/grip strength with blood lipid profile [1516]. A study on US and Chinese adults found a strong association between low grip strength and hypertriglyceridemia with a low level of high-density lipoprotein-cholesterol (HDL-C) [17]. However, a cross sectional study in urban and rural Ecuadorian adolescents concluded that there was a weak association between blood lipid profile (triglyceride [TG] and HDL) and physical fitness (grip strength as one of the physical fitness criterions) [18]. In a population-based study, a positive correlation between grip strength and low-density lipoprotein-cholesterol (LDL-C) was observed in men while a negative relation between grip strength and TG level was shown in women [15]. Also, according to the findings from the Hertfordshire cohort study and the European Youth Heart Study, a decrease in grip strength was associated with a significantly higher fasting TG [11]. Regarding the available epidemiological studies, grip strength may have a different association with different lipid profile components in various populations, highlighting the need for more studies to elucidate the relationship between grip strength and lipid profile.
Overall, muscular strength which declines with the age has been considered as a protective factor for health status [1719]. Hence, studies evaluating related factors with low grip strength which are involved in its unfavorable metabolic fate are necessary. To our knowledge the association between grip strength and obesity or serum lipid profile has not been reported in a large scale sample size in Iran. Moreover, due to the inconsistency between current studies in this area of knowledge, we aimed to examine the cross-sectional associations between grip strength and both obesity and serum lipid profile comprehensively in Ravansar cohort as a part of Prospective Epidemiological Research Studies in IrAN (PERSIAN) cohort study.
MATERIALS AND METHODS
Study design and subjects
This cross-sectional study was conducted based on baseline data on Ravansar Non-Communicable Disease (RaNCD) cohort study, in western Iran in 2018. It is a part of PERSIAN cohort conducting in different ethnicities of Iran in coordination with the Ministry of Health and Medical Education. In fact, 10,000 adults have been studied at RaNCD of whom 6,455 participants had completed data for grip strength and therefore were included in this research. All the participants met the inclusion criteria and provided oral and written informed consent.
Eligibility criteria in the cohort study comprised being in the age range of 35–65 years, permanent inhabiting the Ravansar region (Ravansar town and all villages in its vicinity), having Iranian nationality and having recorded data on hand grip strength measurements. Exclusion criteria were unwillingness to attend the study, living in Ravansar less than nine months a year, being a recent inhabitant of the Ravansar (less than one year), being unable to come to cohort center or to communicate with interviewers (due to mentally or physically disability, blindness, deafness, dumbness and affecting by any acute psychological disorder).
Socio-demographic and -economic characteristics such as age, sex, job, education, welfare and medical information (presence or history of chronic diseases including hypertension, diabetes, cardiovascular disease, stroke and cancer as well as used medications) were collected using digital questionnaires which were filled by an expert interviewer. Social class was generated using principal component analysis on data of durable goods, housing characteristics and other amenities. Also, information on individual habits (including cigarette smoking and alcohol consumption) were entered into a digital questionnaire. Details for rational and design of study have been published before [2021].
Ethics of human subject participation
Informed written consents were obtained from all the candidates who were willing to participate, and they were ensured that they could withdraw from the study at any time they wished. The research was registered (No. 94091) at the Research and Technology Deputy and was approved by the ethics committee of Kermanshah University of Medical Sciences under the code KUMS.REC.1394.487.
Physical activity
The standard physical activity questionnaire of PERSIAN Cohort was used to assess participants' physical activity level. The questionnaire consisted of 22 questions about the amount of daily activities of the person, and finally the data of the questionnaire were extracted and used based on the metabolic equivalent of task per hour per day (MET/h/day).
Anthropometric measurements
Anthropometric parameters including body weight, standing height, waist and hip circumferences were measured according to standard methods (Lohman, 1988). In order to measure the height of subjects, it was measured with BSM 370 (Biospace Co., Seoul, Korea) and then the height of the people was recorded on the Inbody 770 (Inbody Co., Seoul, Korea) based on centimeters. Body weight was measured using an Inbody 770 with a precision of 0.5 kg. In order to measure the height of subjects, it was measured with BSM 370 (Biospace Co). Also body fat percentage, skeletal muscle mass and soft lean mass, fat free mass and visceral fat area were measured.
Waist and hip circumferences were measured using a non-stretchable tape to the nearest 0.1 cm. Waist to hip ratio (WHR) was calculated through dividing WC based on (in cm by hip circumference in cm. Clinical categories of BMI based on the World Health Organization were classified as underweight, normal weight, and overweight, obese.
Visceral fat measurements
Visceral fat was measured using a body analyzer, InBody 770 device (Inbody Co.).
Blood sampling and biochemical assays
After 8–12 hours of fasting, 7 mL of blood samples were collected into the clot tubes. After centrifugation for 10–15 minutes at 4°C, serum samples were stored at −80ºC until bioanalysis. Serum concentrations of lipid profiles (TG, total cholesterol, LDL-C and HDL-C) were measured using commercially available kits according to the manufacturer's protocol.
Hand grip strength
Hand grip strength used as a proxy for overall muscle strength was measured in kg using a hand-held hydraulic hand grip dynamometer (Model SH5003; SAEHAN Corporation, Masan, Korea,). The dynamometer was calibrated according to the manufacturers' manual. The measurement was taken with right/dominant hand when the participant was sitting and the elbow was at 90º of flexion. The participant was asked to squeeze the handle with maximal effort for 10 seconds. The measurement was repeated after 30 seconds and the latter was recorded as hand grip strength.
Chronic diseases status
Diabetes mellitus defined as fasting blood sugar ≥ 126 mg/dL (7 mmol/L) and/or positive history of relevant medicine use (insulin and/or oral hypoglycemic agents). According to criteria recommended by Eighth Report of the Joint National Committee on prevention, detection, evaluation, and treatment of high blood pressure, this study considered participants with a systolic blood pressure ≥ 140 mmHg, diastolic blood pressure ≥ 90 mmHg and/or those with a currently of using antihypertensive drugs as hypertensive. The prevalence of cancers and stroke was assessed using standard cohort questionnaire and self-declaration. The prevalence of cardiovascular diseases was determined by the medical history and medication it consumes.
Statistical analyses
Analysis was done using STATA software version 14.2 (StataCorp, College Station, TX, USA). The significance level was set at 0.05. Data were presented as mean ± standard deviation and percentage (frequency) for quantitative and qualitative variables, respectively, by sex specific standard cutoff point of BMI.
The relationship between obesity and grip strength was first explored using analysis of variance and, χ2 by standard cutoff point of BMI and linear regression by sex-specific quartiles of BMI. All analyses were adjusted for height and age. Height is an important non-modifiable determinant of grip strength due to its correlation to lean mass and representation of skeletal size. Final models were also adjusted for age, height, social class, cardiovascular disease status (yes or no), stroke status (yes or no), cancer status (yes or no), smoking status (current, former, or never), and alcohol intake (yes or no).
Before doing the regression test, we divided the total population into four groups, which in each population group was approximately equal and we compared the BMI and waist size in these four groups. These potential confounding variables were identified a priori from the existing literature [9]. Using similar regression models, the association between grip strength and sex-specific quartiles of WC was also examined. Regression coefficients represent the differences in grip strength in quartiles 2, 3 and 4 of the exposure variable compared to quartile 1.
RESULTS
The mean age of participants was 47.4 ± 8.4 years, of whom 3,610 (56%) were male and 2,845 (44%) were female. In all four subgroups of BMI, the most variables such as WC, WHR, muscular strength, visceral fat, and lipid profile were significantly different between male and female subjects (Table 1). The mean BMI and muscle strength of participants was 27.2 ± 4.6 kg/m2 and 33.3 ± 11.5 kg, respectively. A wide range of BMI was observed in men and women, however, only 1.9% of the women and 2.8% of the men had a BMI < 18.5. Among the subjects, 31.5% of women and 15.6% of men had a BMI ≥ 30.
Table 1
Characteristics of men and women participating in the study
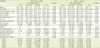
Values are presented as mean ± standard deviation or percentage (number).
BMI, body mass index; TG, triglyceride; HDL-C, high-density lipoprotein-cholesterol; LDL-C, low-density lipoprotein-cholesterol; WC, waist circumference; CVD, cardiovascular disease.
*Using analysis of variance and χ2 test.
![]()
The average physical activity in men was 42.86 ± 9.70, and in women 39.87 ± 5.11 MET/h/day. The average total calorie intake in men was 3,673.21 ± 1,634.73, and in women 2,752.98 ± 1,013.78 kcal/day.
TG, total cholesterol, and LDL showed a significant increase in the four groups (underweight to obese) with increasing BMI such that underweight subjects was at the lowest level and obese subjects at the highest level. Muscle strength of the participants in the first group and fourth group was at a minimum (21.55 ± 5.97 kg) and maximum (24.8 ± 5.6 kg), respectively (p < 0.001) (Table 1).
Social class was divided into five groups in this study, and overweight and obesity were more prevalent in the higher classes. That is, the highest number of men and women in terms of BMI were in the overweight and obese and the lowest number in normal and underweight.
A significant increase was observed in hypertension in women (p < 0.001) and men (p < 0.001) with increasing BMI. The prevalence of diabetes in both sexes was higher in overweight and obese than that in normal and underweight (Table 1).
The findings showed that muscular strength was increased with increasing BMI. After controlling the confounding effect of age, the mean muscular strength was increased in obese (BMI ≥ 30) group, compared to underweight (BMI < 18.5) group in women by 2.59 (95% confidence interval [CI], 1.16, 4.02) kg. After controlling the effect of age and height, the mean muscular strength was increased in BMI ≥ 30 group compared to BMI < 18.5 group in women by 2.43 (95% CI, 1.06, 3.80) kg while the corresponding values were 7.05 (95% CI, 4.95, 9.51) kg and 6.60 (95% CI, 4.66, 8.54) kg, respectively in men. In the multivariate regression analysis, there was a 6.24 (95% CI, 3.58, 8.90) kg difference between BMI in group BMI < 18.5 and BMI ≥ 30 in men, which was 3.30 (95% CI, 0.96, 5.63) kg in women (Table 2).
Table 2
Difference in mean of grip strength (kg) over quartiles of BMI and WC in men and women participating in the study
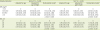
Values are presented as regression coefficient (95% confidence interval). WC quartiles, men: < 94 cm, 94–99.5 cm, 99.5–106 cm, > 106 cm; women: < 81 cm, 81–88.5 cm, 88.5–97 cm, > 97 cm.
BMI, body mass index; WC, waist circumference; Q, quartile.
*Only participants with complete data for all co-variables are included in analyses; †Adjusted for age, height, socioeconomic status (I, II, III, IV, V), prevalent cardiovascular disease (yes, no) prevalent stroke (yes, no) prevalent cancer (yes, no), smoking status (current/former, never), alcohol intake (yes, no).
![]()
Muscular strength was increased with increasing WC in both sexes. The multivariate regression analysis also showed a 2.04 (95% CI, 1.12, 2.97; p < 0.001) kg of muscular strength difference between group Q4 and Q1 in men, which was 1.25 (95% CI, 0.51, 1.98; p = 0.009) kg in women (Table 2).
Every kg increase in visceral fat decreased the mean muscular strength in men by −0.042 (95% CI, −0.058, −0.025) kg, and in women by −0.026 (95% CI, −0.036, −0.015) kg, which was significant in both sexes (p < 0.001). Every percent increase in percent body fat (PBF) decreased the mean muscular strength in men by −0.242 (95% CI, −0.327, −0.158) kg, and in women by −0.170 (95% CI, −0.231, −0.109) kg, which was significant in both sexes (p < 0.001). Every kg increase in fat free mass increased the mean muscular strength in men by 0.476 (95% CI, 0.367, 0.584) kg, and in women by 0.330 (95% CI, 0.235, 0.426) kg, which was significant in both sexes (p < 0.001). Muscular strength had a positive relationship with skeletal muscle mass and soft lean mass in both sexes, and by their increase, muscular strength increased significantly. Lipid profile was increased with the increased muscle strength, which had significant changes in LDL-C and cholesterol in men (Table 3). Mean muscular strength in both sexes showed an increasing trend in terms of BMI and WC although this trend was not significant (Figure 1).
Table 3
Individual effects of lipid profile and body composition on grip strength in men and women
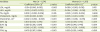
CI, confidence interval; LDL, low-density lipoprotein; HDL, high-density lipoprotein; TG, triglyceride; SSM, skeletal muscle mass; SLM, soft lean mass; PBF, percent body fat; FFM, fat free mass.
*Adjusted for age, height, socioeconomic status (I, II, IIINM, IIIM, IV, V), BMI, prevalent cardiovascular disease (yes, no) prevalent stroke (yes, no) prevalent cancer (yes, no), smoking status (current/former, never), alcohol intake (units per week).
![]()
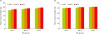 | Figure 1Mean of grip strength by tertile of BMI and WC in men and women. Mean of grip strength (kg) increases with increasing WC in all of the BMI in men (A) and women (B). Bars indicate 95% confidence intervals. Mean of grip strength adjusted for age and height. BMI tertiles, men: < 25.4 kg/m2; 25.4–28.1 kg/m2; > 28.1 kg/ m2; women: < 24.2 kg/m2; 24.2–27.7 kg/m2; > 27.7 kg/m2. WC tertiles, men: < 96.1 cm; 96.1–103.7 cm;> 103.7 cm; women: < 83.5 cm; 83.5–93.8 cm; > 93.8 cm.BMI, body mass index; WC, waist circumference.
|
DISCUSSION
The present study showed that muscular strength increased significantly with increasing BMI in men and women. Furthermore, the relationship between muscular strength and BMI in men was more significant than that of women. This relationship was stronger in the obese group compared to the normal weight and overweight groups, which is consistent with previous studies [922]. The prevalence of diabetes and hypertension in the third and fourth quartiles of BMI was reported more often than in the first and second quartiles. The increase in muscular strength in these quartiles can be explained as these patients were treated after diagnosis and might have had better life style according to the physician's recommendation.
Studies have shown that an excessive amount of fat tissue is a probable contributor to accelerated muscle strength loss. In other words, body fat distribution changes with the age; a decrease in subcutaneous fat tissue and an increase in central and ectopic fat tissues, including fat deposition in muscle occurred with age. Infiltration of fat in the muscle is related with reduction in muscle strength [723].
Another important finding of this study was that muscular strength was increased by increasing WC, which is contradicted with findings of Keevil et al. [9]. The reason for this contradiction may be related to the high level of physical activity of the subjects in the present study because subjects are living in the agricultural area. Our participants were Kurdish people living in western Iran, who have different lifestyles and difficult occupations such as farming, animal gardening, and heavy works that require high level of physical activity, in case of overweight; they have a strong muscular strength. Having high muscular mass and strong muscular strength may be a protective in both overweight and obese participants beside having physically active lifestyle. Using muscular mass and muscular strength alongside with BMI measurement may help to identify overweight and obesity risk factors. Additionally, different associations with health endpoints have been observed depending on the site of fat accumulation. Increased abdominal fat has been most closely associated with health outcomes such as the metabolic syndrome, cardiovascular disease and death [1113].
Although this study did not show a causal relationship due to its cross-sectional nature, numerous studies in adults have shown a positive relationship between BMI and hand muscular strength, which confirms the findings of this study. This does not apply to those with strict and limited diets [924]. The findings showed that muscular strength was positively correlated with fat free mass, skeletal muscle mass, and soft lean mass in both sexes. On the other hand, muscular strength was decreased by increasing visceral fat and body fat percentage. A study in the US reported that muscular strength decreased by increasing excessive body fat and excessive abdominal fat [8]. Bisschop et al. [4] showed that increased visceral fat is positively associated with increased metabolic risks such as metabolic syndrome and its components. Therefore, improving muscular strength and reducing metabolic risks can be achieved through appropriate strategies to reduce visceral fat and body fat mass. Of the suggested strategies are to do appropriate and continuous physical activity and to include protein foods in the daily diet [38].
Surprisingly, an investigation in Germany reported that visceral fat distribution distinctly influences muscle strength of the upper and lower extremities in women. In fact, although it was observed that increased fat mass had a negative effect on muscle strength in both sexes while increased WHR positively affected knee extension strength but did not affect grip strength in women. However, this correlation was not shown in men [25].
There was a positive relationship between BMI and lipid profile in this study. TG, total cholesterol, and LDL increased significantly with increasing BMI in men and women. Muscle strength showed a direct but insignificant relationship with lipid profile. Studies in Switzerland and Japan showed that muscular strength was inversely correlated with LDL, while no relationship was found with other lipid profiles (HDL, TG, cholesterol) [1526]. Considering that participants in this study are living in a region with a high physical activity due to employment in agriculture and horticulture, they may eat more foods due to increased appetite and blood sugar loss after work, and thus receive more calories and lipid, which will result in increasing blood lipids. In addition, in this area, animal oils are used extensively. A study in the UK reported that decreased muscle strength was associated with increased TG, hypertension and WC, and hand muscular strength was associated with metabolic syndrome and its components. Also, low muscle strength was a marker of sarcopenic obesity [11]. These results indicated that muscular strength has a complex relationship with lipid profile. High muscular strength and low lipid profile indicate an ideal condition, while low muscular strength and low lipid profile indicate a health risk for the individual. These findings should be confirmed in further studies. We conducted the analysis for men and women separately in this study. The two sexes had no difference in terms of the relationships. However, differences in muscle strength increased by BMI were about 2 to 3 times more in men than in women. These results are consistent with Keevil et al. [9] and the reason for these gender differences being stronger in men is the greater muscle bulk in men and the difference in levels of adipokines in men and women [27].
One of the limitations of the study was its cross-sectional nature that might cause errors in the obtained relationships, and a longitudinal study can help confirm these relationships. Missing data was another weakness of this study. One of the strengths of this study was the large sample size, the measurement of various obesity markers, and the control of possible cofounding factors that could cause problems in the analysis.
CONCLUSION
The results showed that hand muscle strength was increased with increasing the components of body composition such as WC, BMI, fat free mass, skeletal muscle mass, and soft lean mass. However, there was an inverse relationship between muscle strength and visceral fat and PBF. The lipid profile also had a positive correlation with hand muscular strength although this relationship was insignificant. Muscular strength can be an appropriate indicator for predicting some of the problems associated with body composition disorders. This, of course, requires further studies of a longitudinal nature.
 XML Download