

 PDF
PDF ePub
ePub Citation
 Print
Print


INTRODUCTION
Pediatric malnutrition is defined as underweight, overweight or hindered height growth [1]. Underweight, stunting, wasting, and low body mass index (BMI) for age are common in developing countries [2]. One out of every 4 children who were under 5 years old (151 million) were stunted in 2017 and the rate is increasing globally [3]. In 2016, World Health Organization (WHO) reported that, the prevalence of wasting and severe wasting was 52 and 17 million, respectively, among children under 5 years old [4]. According to WHO reports, underweight is the most important single risk factor for a wide series of diseases in developing countries [5]. On the other hand, in 2016, 41 millions of children under 5 years old were overweight globally [3]. Obesity and overweight are associated with noncontagious diseases in adolescence and death in later ages in life [6]. School performance of malnourished children is weaker, compared to their normal classmates and malnourished children may lose much job opportunities in their later life [7]. In addition, childhood stunting is responsible for 1 percent of height growth retardation in adolescent and lead to decrease in economic productivity [8]. According to the latest report of United Nations Children's Fund, each year, three millions of under 5 years old children die because of under-nutrition globally [3] and malnutrition costs 3.5 trillion USD yearly (2.1 trillion USD for under-nutrition and 1.4 trillion USD for overweight and obesity) [7].
According to the WHO report, Iran, as a developing country, faced 4.6% underweight, 7.1% stunting and 4.8% wasting, among children in 2004 [9]. Other researches also showed that 12% of boys and 22.5% of girls in preschool ages were overweight or obese in Iran [101112]. The latest comprehensive study on Iranian nutritional status in 2012 National Iranian Micronutrients Status (NIMS) showed that, in Golestan province, the prevalence of moderately underweight (4.6%) was less than the national mean (5.1%) and the prevalence of wasted children of under 6 years old (8.4%) in this province was higher than the national mean (6.3%). Furthermore, the prevalence of stunted children in Golestan province (3.4%) was the same as national mean in Golestan province, the prevalence of children of under 6 years old, who were at risk for overweight, overweight or obese (respectively 7.0%, 2.3%, and 1.4) was reported to be lower than the nationwide prevalence (respectively 7.9%, 3.6%, and 2.0%) [13].
Although various studies have been done in different regions of Iran, most of them were limited in sample size and recent data is not available. In addition, most of the researches have been performed on children under 2 years old or more than 5 years old. Although, NIMS reported considerable prevalence of different aspects of malnutrition in children under 2 (8% stunted, 3.3% underweight, 2.8% overweighed, and obese Iranian children) and more than 6 (4.9% stunted, 6.5% underweight, 5.6% overweighed, and obese Iranian children) [13], it did not study children between 2–5 years old. Iran's health system monitors the growth of each child participant, regularly in the first 2 years of his/her life and the next necessary check performs on the sixth year [14]. So, it is important to investigate children's growth between these 2 stages of children's lifetime and surely it is easier to treat malnutrition in younger ages. So, this study aimed to report anthropometric indices, as surrogate estimates for assessing malnutrition in children of 2–5 years in Golestan province of Iran.
MATERIALS AND METHODS
Subjects
The data used in this paper was retrieved from a national study which assessed the prevalence of obesity and overweight among 2–5 years old children in 8 provinces of Iran. Total of 1,382 children aged 2 to 5 years (709 boys and 673 girls) from 2 rural and 2 urban areas (2 townships) of Golestan province were selected by door-to-door visits using a randomized-clustered sampling to measure their weight and height.
General characteristics and anthropometric measurements
This study was started on April, 2015 and finished on June, 2015. Data were collected during 2 months and data were processed and analyzed in 1 month to estimate the prevalence of underweight, stunting, overweight and obesity. Signed consent was provided by parents of all children additionally signed an information form. The protocol of this study was approved by the Department of Community Nutrition of the Iran's Ministry of Health and ethic center of Islamic Azad University (IR.IAU.SRB.REC.1396.62).
In urban areas the population were divided into several blocks then the clusters were selected. In rural areas, clusters were chosen from health documents of the rural healthcare offices. The questionnaires have been completed by mothers or babysitters, then weight and height of children were measured by a trained researcher.
The sample size of each township was calculated by the following formula:

To estimate the sample size, we used the lowest prevalence of obesity and overweight among 6 years old children according to NIMS (5.7%) and d = 2.1%, 1−α = 95%, design effect = 1.5; so, the sample size was calculated 703. We used 705 children by multiplying the total number of clusters and the number of children in each cluster.
All healthy Iranian children of 2–5 years old, settled in specified areas could participate in this study. Subjects with the following criteria were not included: none Iranian children, children who lived in dormitories or nurseries, households without any responder after 3 times of referring and families that the mother had any inveterate diseases. Exclusion criteria included households that completed less than 80% of each questionnaire. The collected data included demographic information of households, information about children and their anthropometric measurements. A trained researcher, measured weight by ± 0.1 kg error and height to the nearest 0.1 cm while children were less-dressed and barefooted. According to the WHO standards, status of weight was determined by classifying the children's BMI for age into 5 groups; underweight (< −2 Z-score), normal weight (−2 ≤ Z-score < +1), at risk for overweight (+1 < Z-score < +2), overweight (+2 < Z-score < +3) and obesity (+3 < Z-score) and height for age was divided into 3 groups; stunting (< −2 Z-score), normal height (−2 ≤ Z-score < +2) and tall (+2 ≤ Z-score) [15]. Weight and height were measured by a digital scale and stadiometer (SECA 769 portable scale and stadiometer; SECA, Hamburg, Germany) which was calibrated to zero.
Statistical analysis
Data entering was checked in 2 steps. Initially, questioners checked the answers to lower the number of missing questions and outlier data. Then, a data entry staff entered data into Anthro version 3.2.2 (Department of nutrition, WHO, Geneva, Switzerland) to determine the status of anthropometric indices in each child. Statistical packages for the social sciences (SPSS version 24.0 for windows; IBM Corp., Armonk, NY, USA) was used and a staff checked the correctness of entered data. The quantitative data was reported as means (± standard deviation). Prevalence data was presented as percentages and compared by using χ2. The p-values < 0.05 have been considered as significant.
RESULTS
The number of boys and girls participated in this study were 709 (51.4%) and 673 (48.6%), respectively. The number of participants in urban areas was 751 (54.4%) and that in rural areas was 631 (45.6%). Tables 1 and 2 show the characteristics of the 2–5 years old children and their families.
Table 1
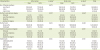
Life style characteristics of Iranian children in different areas of Golestan province

Data are shown as mean ± standard deviation or number (%). The χ2 test was used to compare life style characteristics among boys and girls and p < 0.05 was reported to be statistically significant. Independent t-student test was used to compare mean ± standard deviation in quantitative continuous data.
*The p value explains the significance of difference between boys and girls within urban or rural areas.
![]()
Table 2
Demographic characteristics of Iranian children's family in different areas of Golestan province
Values are presented as number (%). The χ2 test was used to compare the prevalence of anthropometric indices among boys and girls and p < 0.05 was reported to be statistically significant.
*The p value explains the significance of difference between boys and girls; †0.05 ≤ p < 0.1 reported to be marginally significant.
![]()
As results in Table 1 show, in urban areas the number of girls who use dietary supplements was high in comparison with boys while in rural areas the number of boys who used supplements was higher than their female peers. According to the questionnaires completed by mothers, breastfeeding was the most common way of feeding in both genders and areas and there was not any significant difference between boys and girls in each area (p = 0.155 in urban areas and p = 0.958 in rural areas). Furthermore the number of meals and the meal distribution after lactation period is important and there was not any significant difference in having breakfast, as reported by mothers (p = 0.405 and p = 0.730 for urban and rural areas, respectively) and in number of meals (p = 0.734 for urban and p = 0.461 for rural areas) and snacks (p = 0.574 for urban and p = 0.758 for rural areas) between boys and girls in both areas. Playing outdoor, video games, watching television, and sleeping are the most common factors contributing to determine the daily physical activity level in 2–5 years old children which all of them were assessed in the current study. There were no significant difference in the duration of sleep, video games and watching TV between 2 genders in urban and rural areas (p = 0.738 and p = 0.558, p = 0.614 and p = 0.974, p = 0.728 and p = 0.240, respectively) while the duration of playing outdoor was significantly different between boys and girls in selected cities and villages (p = 0.038 and p = 0.002, respectively).
Table 2 shows the demographic characteristics of the families, including the number of family members and parents' educational degree and job. Most families had less than 5 family members and the number of family members were not significantly different between boys and girls in each area (p = 0.973 for cities and p = 0.691 for villages). The parents' educational degree was higher in urban areas in comparison with rural zone. Most of parents in rural areas were not graduated from high school while most of mothers in urban areas had a high school diploma. There was a marginally significant difference in terms of literacy status among mothers of boys and girls in rural areas of Golestan (p = 0.063) but we did not notice any significant difference among fathers in urban and rural areas (p = 0.101 and 0.219, respectively) and urban mothers (p = 0.207; Table 2).
In this study the percentage of stunting among boys settled in selected towns was more than rural participants. The percent of stunted and tall children were higher in urban areas in comparison with rural areas. There was no significant difference in terms of height status between genders in both urban and rural areas (p = 0.620 and p = 0.690, respectively). The percentage of boys with underweight and at risk for overweight were higher than girls in both rural and urban areas. There was a marginally significant difference between boys and girls in terms of weight status in urban areas and total province (p = 0.067 and p = 0.073, respectively), but it was not significant in rural areas (p = 0.847; Table 3).
Table 3
Status of height and weight of Iranian children in different areas of Golestan province

Values are presented as number (%). The χ2 test was used to compare anthropometric indices among boys and girls and p < 0.05 was reported to be statistically significant.
*The p value explains the significance of difference between boys and girls; †0.05 ≤ p < 0.1 reported to be marginally significant.
![]()
DISCUSSION
This study presented the data of anthropometric indices of 2–5 years old children who settled in randomly selected towns and villages of Golestan province. The results of this study—including the prevalence of underweight, overweight, obesity, stunting, demographic, and socio-economic information—were reported to the Department of Community Nutrition of Iran Ministry of Health and Medical Education for further investigations to carry out proper actions to control nutritional issues in children in Golestan province.
Our results showed that 6.1% of children who participated in our study were stunted. In line with our findings WHO/Info reported that 6.8% of Iranian children were stunted in 2011 [16], which confirmed that no eye-catching difference was observed. A lower prevalence (3.5%) of moderate stunting was also reported by NIMS in 2012, in 6 years old Iranian children and 4.6% in Golestan province [13]. Several studies have shown that different micronutrients may play an important role in height growth of children. Hence, micronutrient deficiency for any reason can lead to stunting. Stuijvenberg et al., [17] reported a lower intake of calcium, vitamin D, riboflavin, and vitamin B12 in stunted 2–5 year old children. Another study by Bueno et al., [18] supported these findings about vitamin D and calcium intake. Furthermore, lower sun exposure may lead to vitamin D deficiency, which is probably related to stunting [19]. As cloudy and rainy weather is the dominant weather in Golestan, this condition may cause lower serum levels of vitamin D and also stunting at final stage. The NIMS (2012) reported that the prevalence of vitamin D deficiency was about 51.3% among 6 years old children in Golestan and similar provinces [13]. Another probable reason for micronutrients deficiency is malabsorption due to parasitic infections. According to some studies, children who lived in Golestan province faced moderate risk of intestinal parasite infection which may be another reason for micronutrients deficiency -especially zinc and iron- and finally that may result in stunting [202122]. Most of the people in Golestan province are farmers and their intake of micronutrients is limited to the products that are cultivated locally, which may be deficient in term of some micronutrients, like iodine and selenium that may be linked to skeletal growth [2324] This poor content of micronutrients in locally-produced agricultural products must also be noted as a probable reason for stunting among children in Golestan province.
NIMS reported that the prevalence of underweight was 5.1% and 4.6% in 6-years old children in Iran and Golestan province, respectively. Our study showed that the prevalence of underweight was about 5.5% among 2–5 years old children, which this difference does not seem to be significant. During the past decades, the major health problem in children was undernourishment and it was the main reason for most under 5 year's old deaths in developing countries [25]. Data from several studies showed that, the prevalence of under nutrition has been decreased along with an increase in the prevalence of overweight and a decline in mortality rate of under 5 years old children [13]. Our study showed that the risk of overweight among 2–5 years old children was 12.7% in Golestan. Since NIMS reported that 7.0% and 7.9% of 6 years old children were at risk for overweight in Golestan and Iran, respectively [13], the observed increase in a short period of time may warn us about a probable problematic situation with pediatric and adulthood overweight and obesity in near future and its serious complications. This overweight and obese population may be more susceptible to noncontagious diseases such as hyperinsulinemia, hypertension, atherosclerosis, and type 2 diabetes [26], which can lead to more disability and death in lower ages [27] and impose an economic burden to the health system. This rapid growth in rate of the risk of pediatric overweight may be caused by the nutritional transition that has changed the food habits of people who live in developing countries [28], like Iran. Due to this nutritional transition, people eat more fatty, fried and processed foods and have less dietary fiber as vegetables and fruits in their daily diet [29]. Also, dairies and fruits have been substituted with sweetened and fried snacks [30]. Children also prefer fast foods and sweetened drinks instead of traditional foods. Beside of the nutritional transition, during the urbanization, the mean hours of physical activity has been decreased and children do less exercise and play with computer and watch TV more than before [30]. So, the balance between energy intake and consumption is disturbed and may lead to overweight and obesity.
Our findings showed that in urban areas, the number of overweight or obese children in boys is higher than those in girls and the difference between boys and girls in weight status is marginally significant (p = 0.067) that can be confirmed by same results in 6 years old children in NIMS [13]. The intake of dietary fiber, body composition, the amount of food in each meal and different ways of training are probable reasons for the difference between genders. A study showed that girls consume more fruits and vegetables than boys do [31], so boys consume less dietary fiber which can reduce the density of calorie in food, decline the rate of food transition, and results in more satiety [32]. As another reason for the observed difference between boys and girls and in line with our findings, Hosseini et al., [33] reported that boys were significantly heavier than girls were in children under 2 years old. Some other studies showed that boys were born in higher weight and they were heavier than girls were till the second year of life [34]. In addition, studies reported that mothers restricted the food intake in girls while, they were less desirous to restrict their boys' diet [3536]. Furthermore, we suggest that it is probably more difficult for mothers to control their boys' diet in comparison with girls due to cultural and behavioral differences, so these factors may be probable reasons for higher body weight in boys in comparison with girls in the same age. These reasons are probable but strong hypotheses for pediatric risk for overweight.
Our study showed that boys spent significantly more time on playing outdoor in comparison with girls did, so as researchers in another study observed less hours of outdoor play in under 5-year-old girls in comparison with same-age boys maybe because of cultural issues [33]. Food restriction, TV time and the type of training, may have stronger effects on weight in comparison with the difference of the duration of playing outside. So, it may be the probable reason for the observed contrast between the prevalence of risk for overweight and the duration of playing outdoor between 2 genders in cities.
WHO reported that 40% of under 6 months children were particularly breastfed globally [37] and also the mean rate of breast feeding in Iran was reported 53.0% in 2015 [16]. Fortunately, the results of present study showed that 75.0% of 2–5 years old children in Golestan province were breastfed in their first 19.5 months of their life which is obviously higher than global and national means and may be in relation with the fact that more than 90.0% of mothers in our study were housewives and could spend more time on their infants' care and also we cannot ignore the effect of cultural and religious emphasis on breastfeeding and health related educations by the health care staff in recent years.
Our results showed that 89.5% of children were using dietary supplements and 83.2% have breakfast regularly in Golestan province. Most of families had 4–5 family members (57.4%) in rural areas but in cities most of them have less than 6 members and there was not a visible difference between the number of families with less than 3 members (48.2%) and 4–5 members (49.1%) in urban areas. In towns most of mothers had high school diploma (49.9%) while most mothers in rural areas were not graduated from high school (56.8%). Educational degree of most of the fathers was diploma or less (77.4%) in cities and less than diploma (62.1%) in villages. Academic education among parents was more prevalent in cities (41.1%) in comparison with villages (10.6%), which might be due to better educational opportunities in cities. This information showed higher educational status in families settled in urban areas but occupational status was the same in both areas.
The large sample size was the most important strength of this study but diet diversity and dietary intakes were not assessed. Also, it would be better to investigate children's food habits which are related to anthropometric indices. Authors suggest other national researchers studying on reasons of high overweight risk among preschoolers and also a periodic evaluation of their nutritional status.
CONCLUSION
In conclusion, it is necessary to pay special attention to the anthropometric health related parameters of children in Golestan province especially in 2–5 years old children, because of their vulnerability to malnutrition and the chance for correcting their nutritional problems. This group of children can be the most appropriate group to receive intervention for preventing overweight and obesity in adulthood in order to decrease the burden of non-contagious diseases in future generations.
 XML Download