

 PDF
PDF ePub
ePub Citation
 Print
Print


INTRODUCTION
Percutaneous transthoracic needle lung biopsies (PTNBs) are useful procedures for patients with pulmonary lesions considered to be malignant. The accuracy of PTNBs for diagnosis of malignancy has been reported to be high as 90–99% (12345678). However, diagnostic failures often occur, and they hinder proper and timely management of patients. Diagnostic failures of PTNBs can be divided into false-positive and false-negative results and non-evaluable results due to insufficient specimens (34).
When biopsy results are non-evaluable due to insufficient specimens, the uncertainty over diagnoses remains unsolved, and additional medical procedures are required to confirm diagnoses. Therefore, non-evaluable results due to insufficient specimens should be considered as diagnostic failures irrespective of whether the final diagnosis is benign or malignant. According to the intention-to-diagnose principle, non-evaluable results due to insufficient specimens should be counted as false-negative findings when calculating sensitivity and false-positive findings when calculating specificity (9). Thus, an understanding of the actual, realistic diagnostic accuracy of PTNBs is essential for deciding whether to perform a biopsy or not. However, there is a possibility that the sensitivity and specificity of PTNBs are overestimated because the majority of the studies did not follow the intention-to-diagnose principle (9). Indeed, previous studies excluded non-evaluable results (148), regarded non-evaluable results as negative results (7), or did not mention how they handled non-evaluable results (56) when they calculated the diagnostic accuracies.
To date, multiple studies have measured the diagnostic accuracy of PTNBs and investigated the risk factors for diagnostic failures (1234567810). Nonetheless, the generalizability of these studies is limited, because the majority were single-center studies (12346810), had small numbers of patients (124810), and limited patient inclusion to specific groups using particular guiding modalities (1234567810), biopsy needles (1236710), and lesion sizes (24). Moreover, the results of previous studies were inconsistent in relation to the effects of lesion size (368), lesion location (346), lesion depth (26), lesion type (610), biopsy needle (14), number of tissue samplings (36), and final diagnosis (348) on diagnostic failures. Therefore, this study aimed to measure the diagnostic accuracy based on the intention-to-diagnose principle and identify risk factors for diagnostic failure of PTNBs in a multi-institutional setting.
Go to : 
MATERIALS AND METHODS
Study Design and Study Population
This retrospective multi-institutional study was conducted by the Korean Registry of Percutaneous Transthoracic Needle Lung Biopsy group. Eight teaching hospitals in metropolitan Seoul (six tertiary and two secondary hospitals, with a median bed number of 979, ranging from 555 to 2320) participated in this study. The study was approved by the Institutional Review Board of each institution, and the requirement for informed consent was waived.
We enrolled all consecutive patients at least 20 years of age who had undergone PTNBs from January 2010 to December 2014. During this period, 10568 consecutive PTNBs were performed in 9823 patients. Among the 10568 PTNBs, 1184 biopsies were excluded because they did not fulfill the predefined criteria for determining the final diagnosis (n = 590) or were repeat biopsies or re-biopsies of the same target lesion (n = 594). Finally, the remaining 9384 PTNBs on 9239 patients were included. In two recent studies, we used the same patient cohort to report the malignancy risk of non-diagnostic results from PTNBs and complications of PTNBs by using CT-guidance modalities (1112). Unlike these previous studies, the current study primarily focuses on measuring diagnostic accuracy and identifying risk factors for diagnostic failures of PTNBs.
Procedures
The biopsy procedures were performed in accordance with the routine clinical practice at each institution. The attending physicians requested the biopsy, and the final decision to perform PTNB was made at the discretion of dedicated thoracic radiologists in each institution. The selection of guiding modality and biopsy needle was made based on each institution's resources, preference of the performing thoracic radiologists, and target lesion characteristics. Most procedures were performed by attending radiologists. In cases wherein the procedures were performed by radiology residents or fellows, attending radiologists closely supervised the procedure. On-site cytopathology technologists were not available at any hospital.
Data Collection
Site investigators and trained research assistants recorded the variables related to patients, target lesions, and biopsy procedures. The patient variables were age, sex, familial history of lung cancer, smoking history (never smoker, former smoker, or current smoker) (13), and the presence of pulmonary emphysema on CT images. The target lesion variables included size (long-axis diameter on axial CT images), type (solid or subsolid), location (upper and middle lobes or lower lobe), and depth (distance from the pleura to the target). The procedure variables included biopsy needle (fine needle aspiration [FNA] or core needle biopsy [CNB], or combined), guiding modality (fluoroscopy, conventional CT, CT fluoroscopy, cone-beam CT [CBCT], or ultrasonography), and the number of tissue samplings.
The original pathological reports of the PTNBs were also recorded. PTNB results were categorized as positive, negative, or non-evaluable due to insufficient specimens based on the original pathological reports, while the reference standard results were blinded. Malignancy, atypical cells suggestive of malignancy, atypical cells suspicious for malignancy, and atypical cells of indeterminate malignancy were considered positive, on the basis of our previous work (11). Specific benign, nonspecific benign pathological results, and atypical cells favoring benignity were considered negative. Non-evaluable results due to insufficient specimens was considered when the original pathologic reports indicated that the specimen was inadequate or insufficient for pathologic diagnosis.
Reference Standards
For each lesion, the final diagnosis was categorized as malignant or benign by site investigators using predefined criteria. The reference standard for each target lesion was identified as follows (36). First, the diagnosis was based on a surgical pathologic report if the lesion was surgically resected. Second, it was based on pathologic analysis of a non-surgical biopsy of the lesion if it revealed a malignant or specific benign result. Because atypical cell results were not considered as specific diagnoses, a final diagnosis was not determined based on the atypical cell results. Third, the lesion was identified as benign when its diameter decreased by 20% or more or its size was stable for at least two years without treatment. Fourth, the lesion was identified as malignant when the clinical behavior showed obvious malignant processes. Lesions that did not fit the criteria were classified as having incomplete reference standards, and they were excluded from this study.
Statistical Analyses
The sensitivity, specificity, positive predictive value (PPV), and negative predictive value (NPV) for the diagnosis of malignancy were calculated with 95% confidence intervals (CIs) on a per-lesion basis. According to the intention-to-diagnose principle, non-evaluable results due to insufficient specimens were considered as false negatives when calculating sensitivity and false positives when calculating specificity (9).
All biopsies were categorized as diagnostic successes or diagnostic failures. Diagnostic successes consisted of the true-positive and true-negative results. Diagnostic failures consisted of the false-positive, false-negative, and non-evaluable results due to insufficient specimens. To determine the risk factors for diagnostic failures, univariable and multivariable analyses were performed by using a generalized linear mixed model. The institutions were entered into the model as a random effect to account for the clustering effect. In the univariable analyses, variables related to the patients, target lesions, and biopsy procedures, a final diagnosis of benignity/malignancy, and final diagnosis of lymphomas were tested based on clinical contexts. Significant variables with p values less than 0.05 in the univariable analyses were used as input variables for the multivariable analysis to identify independent risk factors. Because missing data consisted of only 3.3% (308 of 9384) of biopsy cases, multivariable analysis was performed based on a complete-case analysis. P values less than 0.05 were considered statistically significant. All statistical analyses were performed using STATA 15.0 (StataCorp, College Station, TX, USA).
Go to :
RESULTS
Patient Demographics and Biopsy Procedures
The patient demographics and biopsy procedure characteristics grouped by institution are presented in Table 1. Mean patient age was 65 years (age range, 20–99 years) and the proportion of women was 38.0% (3510 of 9239). The main guiding modalities were fluoroscopy (used in two institutions), conventional CT (three institutions), CBCT (two institutions), and CT fluoroscopy (one institution).
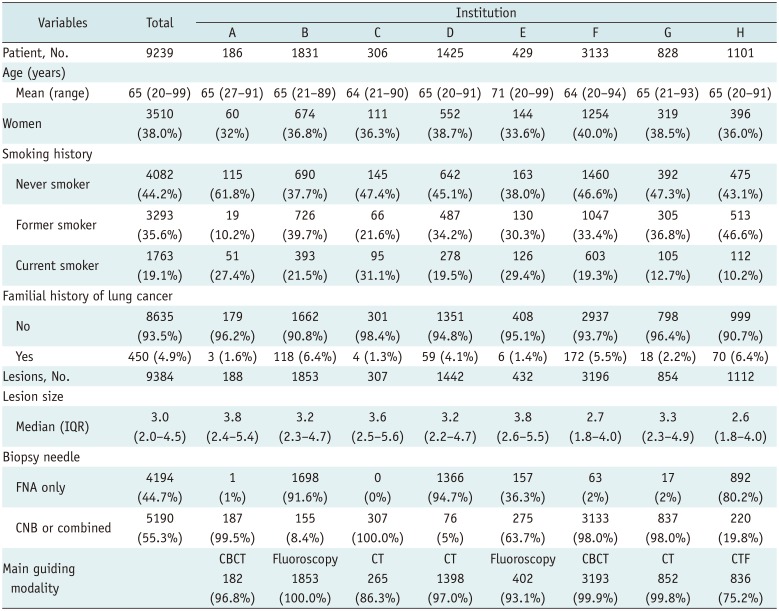
Table 1
Patient Demographics and Biopsy Procedure Characteristics
![]()
Diagnostic Accuracy
Of the 9384 biopsies, 6774 (72.2%) showed positive results, 2170 (23.1%) showed negative results, and 440 (4.7%) were non-evaluable due to insufficient specimens. As for the final diagnosis, 7268 lesions were confirmed as malignant and 2116 lesions were confirmed as benign. Therefore, the overall accuracy, sensitivity, specificity, PPV, and NPV for diagnosis of malignancy were 91.1% (8553 of 9384; 95% CI, 90.6–91.7%), 92.5% (6723 of 7268; 95% CI, 91.9–93.1%), 86.5% (1830 of 2116; 95% CI, 85.0–87.9%), 99.2% (6723 of 6774; 95% CI, 99.0–99.4%), and 84.3% (1830 of 2170; 95% CI, 82.7–85.8%), respectively.
The diagnostic categories and accuracy stratified by lesion size, lesion type, lesion depth, biopsy needle, and guiding modality are presented in Tables 2 and 3. Target lesions ≤ 2 cm in size had a sensitivity, specificity, PPV, and NPV of 88.4% (1508 of 1705; 95% CI, 86.8–89.9%), 85.0% (599 of 705; 95% CI, 82.1–87.5%), 98.8% (1508 of 1527; 95% CI, 98.1–99.2%), and 82.8% (599 of 723; 95% CI, 79.9–85.5%), respectively. The sensitivity, specificity, PPV, and NPV of subsolid pulmonary lesions were 86.1% (304 of 353; 95% CI, 82.1–89.6%), 85.7% (42 of 49; 95% CI, 72.8–94.1%), 99.0% (304 of 307; 95% CI, 97.2–99.8%), and 60.0% (42 of 70; 95% CI, 47.6–71.5%), respectively.
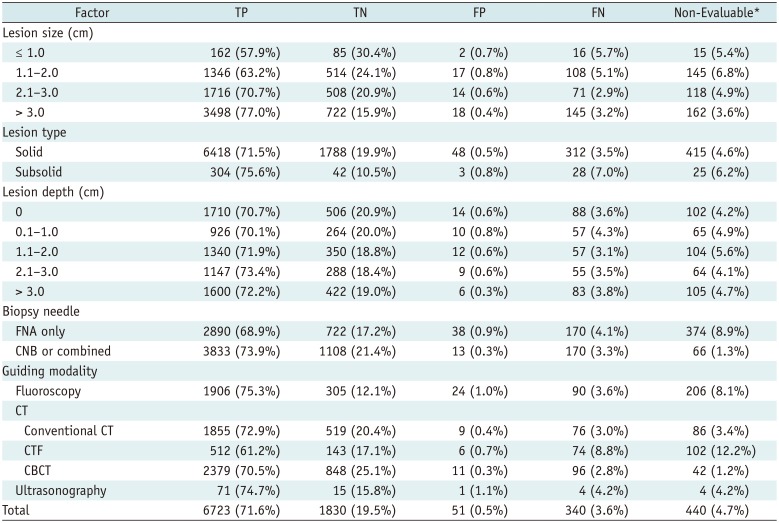
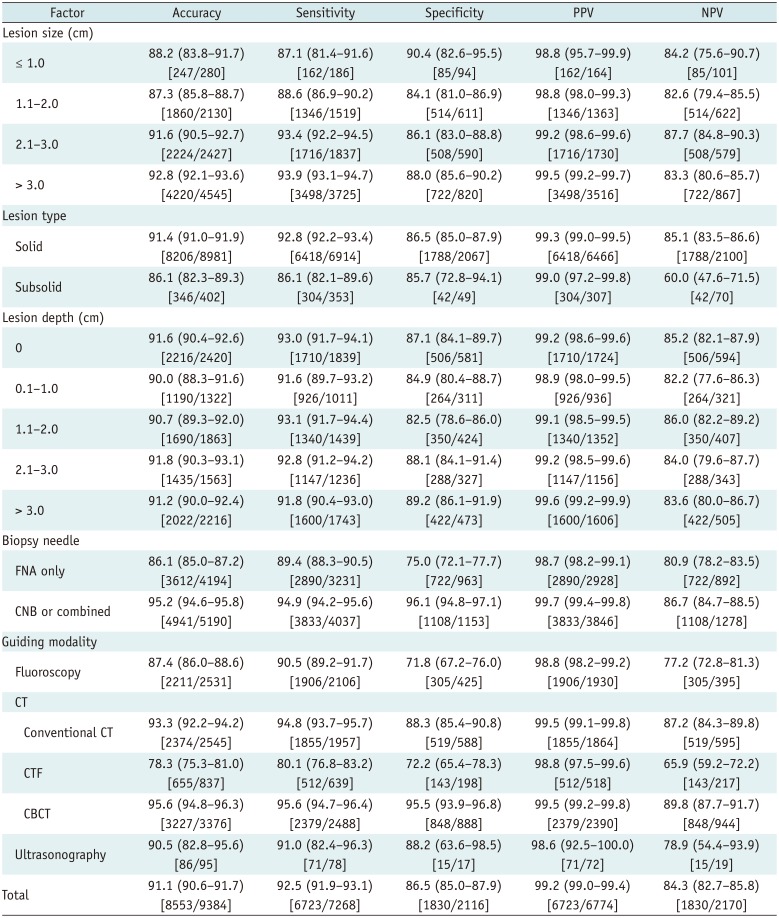
Table 2
PTNB Diagnostic Categories for Diagnosis of Malignancy Stratified by Lesion Characteristics, Biopsy Needle, and Guiding Modality
![]()
Table 3
PTNB Accuracy for Diagnosis of Malignancy Stratified by Lesion Size, Lesion Type, Biopsy Needle, and Guiding Modality
![]()
In comparison with FNAs, the use of CNBs resulted in a lower proportion of non-evaluable results due to insufficient specimens (1.3% with CNBs and 8.9% with FNAs). The sensitivity, specificity, PPV, and NPV of CNB were 94.9% (3833 of 4037; 95% CI, 94.2–95.6%), 96.1% (1108 of 1153; 95% CI, 94.8–97.1%), 99.7% (3833 of 3846; 95% CI, 99.4–99.8%), and 86.7% (1108 of 1278; 95% CI, 84.7–88.5%), respectively. The sensitivity, specificity, PPV, and NPV of FNA were 89.4% (2890 of 3231; 95% CI, 88.3–90.5%), 75.0% (722 of 963; 95% CI, 72.1–77.7%), 98.7% (2890 of 2928; 95% CI, 98.2–99.1%), and 80.9% (722 of 892; 95% CI, 78.2–83.5%), respectively.
Diagnostic Failures and Risk Factors
The proportions of PTNBs with diagnostic successes and diagnostic failures were 91.1% (8553 of 9384; 95% CI, 90.6–91.7%) and 8.9% (831 of 9384; 95% CI, 8.3–9.4%), respectively. The diagnostic success group (n = 8553) consisted of 6723 true-positive and 1830 true-negative results (Fig. 1). The diagnostic failure group (n = 831) consisted of 51 false-positive, 340 false-negative results, and 440 non-evaluable results due to insufficient specimens. There was one patient who had false-positive PTNB among the 6222 PTNBs that showed malignancy. Although non-small cell carcinoma was suggested on PTNB, this patient was finally diagnosed as having a benign disease (pulmonary actinomycosis).
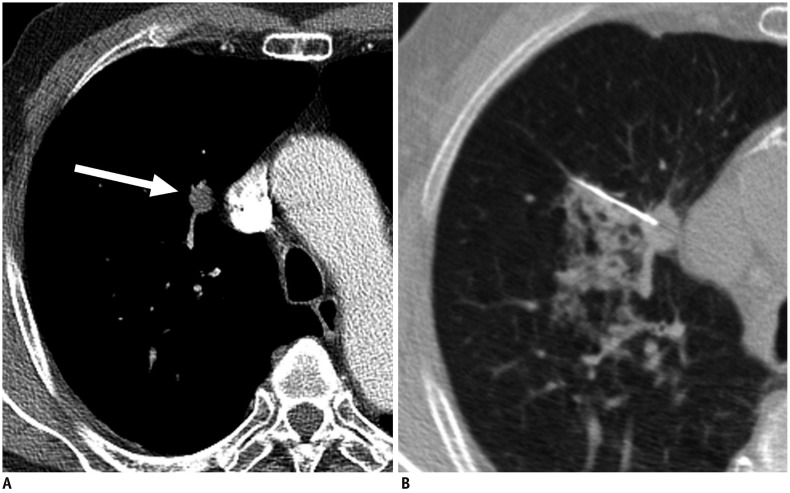 | Fig. 1Axial CT images in 78-year-old man with history of esophageal cancer.
A. Contrast-enhanced chest CT image shows 1.3-cm solid nodule in right upper lobe (arrow). B. CT-guided PTNB was performed by using 22-gauge aspiration needle, and pathologic examination showed adenocarcinoma of pulmonary origin (true-positive result). Patient underwent right upper lobectomy, and lesion was confirmed to be adenocarcinoma in pathologic examination. PTNB = percutaneous transthoracic needle lung biopsy
|
The diagnostic failure and success groups showed differences related to patient age, the presence of emphysema, lesion size, lesion type, biopsy needle, guiding modality, tissue sample numbers, final diagnosis of benignity/malignancy, and final diagnosis of lymphomas (all p values < 0.05) (Table 4). Lesion depth and lesion location did not significantly increase the risk of diagnostic failure. In the multivariable analysis, independent risk factors for diagnostic failures were lesion size ≤ 1.0 cm (adjusted odds ratio [AOR], 1.86; 95% CI, 1.23–2.81; p = 0.003), lesion size of 1.1–2.0 cm (AOR, 1.75; 95% CI, 1.45–2.11; p < 0.001), subsolid lesions (AOR, 1.81; 95% CI, 1.32–2.49; p < 0.001), FNA only (AOR, 2.43; 95% CI, 1.80–3.28; p < 0.001), final diagnosis of benign lesions (AOR, 2.18; 95% CI, 1.84–2.58; p < 0.001), and final diagnosis of lymphomas (AOR, 10.66; 95% CI, 6.21–18.30; p < 0.001). CBCT (AOR, 0.31; 95% CI, 0.13–0.75; p = 0.009) and conventional CT-guidance (AOR, 0.55; 95% CI, 0.32–0.94; p = 0.03) reduced diagnostic failures when compared with the use of fluoroscopy.
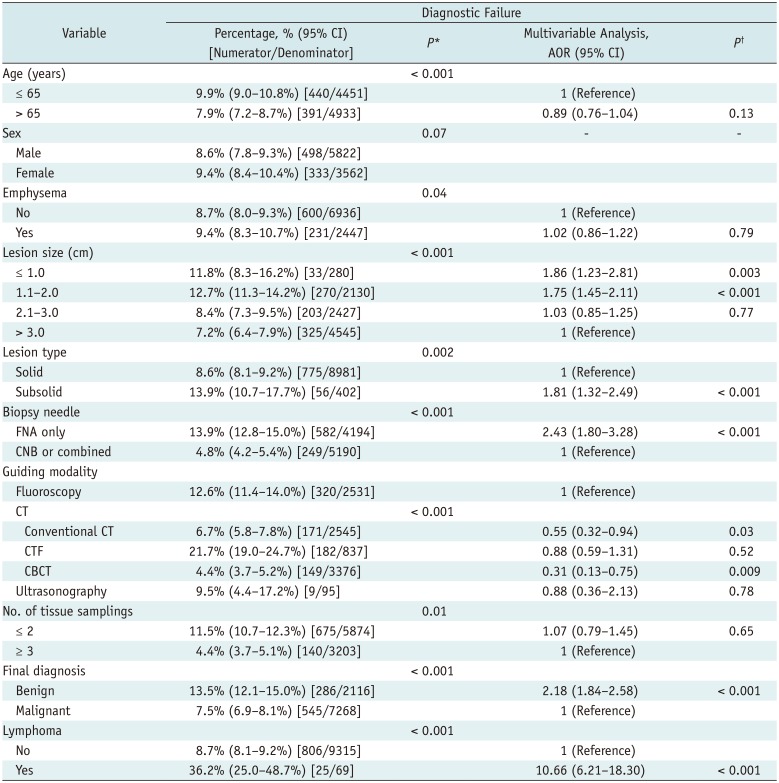
Table 4
Diagnostic Failures and Their Risk Factors
![]()
A final diagnosis of lymphoma was associated with the highest proportion of diagnostic failures (36.2%, 25 of 69). Among the 29 lymphoma cases in which FNAs were performed, nearly half (n = 15) showed nonspecific benign results, two cases showed non-evaluable results due to insufficient specimens, and six cases showed atypical cell results. Only six were confirmed as lymphoma with FNA (Fig. 2). However, diagnoses were made in 75% (30 of 40) of lymphoma cases with CNB.
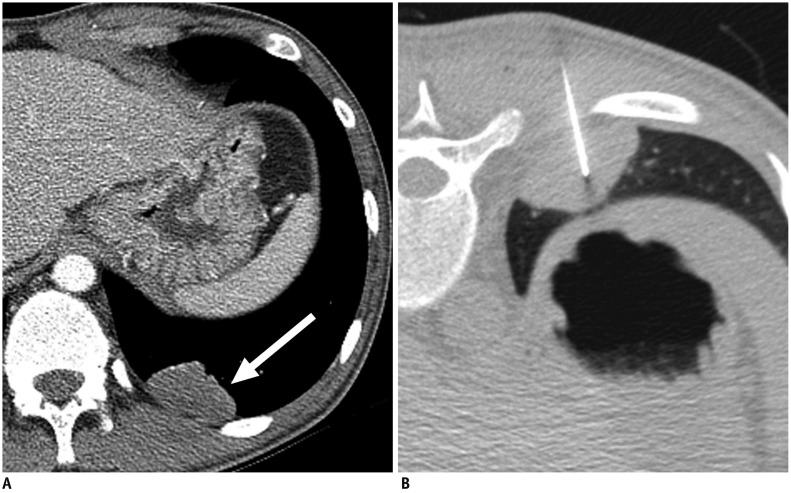 | Fig. 2Axial CT images in 21-year-old man diagnosed with acquired immunodeficiency syndrome.He was referred for incidentally detected pulmonary mass during treatment of Pneumocystis jiroveci pneumonia.
A. Contrast-enhanced chest CT image shows 4.0-cm mildly enhanced mass in left lower lobe (arrow). B. CT-guided PTNB was performed by using 22-gauge aspiration needle, and pathologic examination showed chronic inflammation (false-negative result). Patient underwent left lower lobectomy, and lesion was confirmed to be malignant lymphoma in pathologic examination.
|
Go to :
DISCUSSION
In this study, we measured the diagnostic accuracy in terms of the intention-to-diagnose principle and identified the risk factors of diagnostic failures in our dataset, which has the largest number of patients yet recorded in the literature. Overall, the accuracy, sensitivity, and specificity of PTNB for the diagnosis of malignancy were 91.1%, 92.5%, and 86.5%, respectively. Diagnostic failures occurred in 8.9% of the PTNB cases. The risk factors for diagnostic failures were target lesion size ≤ 2 cm, subsolid lesions, FNA only, a final diagnosis of benign lesions, and final diagnosis of lymphomas. Conventional CT and CBCT significantly lowered the proportion of diagnostic failures, when compared with fluoroscopy.
The specificity of PTNBs was 86.5%, which is much lower than the previously reported values of 98–100% (345678). We think that the specificity in the previous studies was overestimated because the specificities in these studies were calculated by excluding the non-evaluable results (458) or regarding non-evaluable categories as negative results (714). In this study, however, the specificity was calculated according to the intention-to-diagnose principle by including non-evaluable results due to insufficient specimens as false positives (9).
In a previous multicenter study (7), the NPV was only 51% when nonspecific benign pathologic results and non-evaluable results due to insufficient specimens were regarded as negative results. Because the clinical meanings of nonspecific benign pathologic results and non-evaluable results due to insufficient specimens might be substantially different in actual clinical practice, we did not consider non-evaluable results due to insufficient specimens as negative results. Indeed, the proportion of final diagnosis of malignancy was much higher among the non-evaluable results due to insufficient specimens (46.6%) than that among the nonspecific benign results (21.3%). When we measured the NPV in the nonspecific benign category, the NPV was 78.7%.
Target lesion size ≤ 2 cm and the presence of subsolid pulmonary lesions were risk factors for diagnostic failures. These findings are consistent with studies that reported smaller lesions were associated with higher diagnostic failures (368), although the diagnostic accuracy of PTNBs in target lesions ≤ 2 cm in size remained at a relatively high level. Target lesions over 3 or 5 cm in size were not associated with high diagnostic failures in our study, in contrast to the previous studies (315). Careful selection of the target area might have prevented diagnostic failures for large lesions with necrosis. With subsolid lesions, the NPV was only 60.0%, and the proportion of diagnostic failures increased to 13.9%. Because part-solid nodules have a high probability of malignancy (16), our results support direct surgical resections in part-solid nodules based on CT assessments (17).
Although there was no control over the biopsy needle selection, the strength of our study was that the accuracies of FNA and CNB were compared in a multi-institutional setting. Since only small tissue samples can be obtained with FNA, each institution's FNA accuracy may vary depending on the target lesions' characteristics, aspiration techniques, the presence of on-site pathologists, and the experience levels of the interpreting pathologists (18). In this study, CNB showed a much lower proportion of non-evaluable results due to insufficient specimens than did FNA, and FNA was found to be an independent risk factor for diagnostic failures. The specificity of PTNBs was significantly higher with CNB (96.1%) than with FNA (75.0%). CNB can be a better option than FNA to reduce the risk of diagnostic failure of PTNB, especially for lung lesions with a high risk of diagnostic failure. Although we did not include the results of the molecular analysis in this study, CNB has been preferred over FNA to obtain adequate tissue for molecular analysis (1920). However, it should be noted that CNB has been associated with higher complication rates (21). Radiologists should choose the type of biopsy needles carefully in a given case, considering the possible impact of diagnostic failure and occurrence of complications.
The guiding modality is usually determined on the basis of accessibility, target lesion characteristics, and operator preferences. Each modality has its advantages and disadvantages; it is difficult to identify a single modality of choice for PTNBs. In this study, biopsies performed under CBCT were associated with the lowest percentage of diagnostic failures. However, there was no significant difference between CBCT and conventional CT. Because of the flexibility of CBCT with regard to orienting detectors around patients, this technique has shown high diagnostic accuracy even with small lesions (5). Nonetheless, radiologists are exposed to fluoroscopic radiation during CBCT-guided biopsy. Conventional CT is accessible in most institutions and does not expose radiologists to radiation. However, conventional CT may be related to more patient radiation exposure than CBCT (22). The guidance under CT fluoroscopy did not show higher diagnostic performance when compared to fluoroscopy. We speculate that the high proportion of diagnostic failures under CT fluoroscopy may be institution-specific and related to lesion characteristics and aspiration techniques, but not an issue with CT fluoroscopy (11).
This study had the following limitations. First, it was retrospective, and the biopsy practice pattern differed across institutions depending on preferences, resources, and operators' experience. There was no control over the biopsy decision processes. Second, pre-test probabilities of malignancy and detailed biopsy indications were not evaluated in this retrospective study. However, the majority of the PTNBs were performed for the diagnosis of lung lesions considered to be malignant. Third, diagnostic failures or accuracies could not be evaluated in patients with incomplete reference standards for final diagnosis, although the proportion of such patients was small (5.9%). Fourth, technical failure cases, operator-related factors, and procedure times were not evaluated. Fifth, no institution had on-site pathologists.
In conclusion, the accuracy of PTNB for diagnosis of malignancy was fairly high in our large-scale multi-institutional cohort. The identified risk factors for diagnostic failure may help reduce diagnostic failure and interpret the biopsy results.
Go to :
 XML Download