

 PDF
PDF ePub
ePub Citation
 Print
Print


INTRODUCTION
Diffusion-weighted imaging (DWI) of acute cerebral ischemia can indicate the infarct core, which strongly correlates with the final infarct volume (12). Accurate segmentation of acute ischemic lesions on DWI is crucial for evaluating patients and guiding treatment options. However, the performance of the currently available automated segmentation methods remains insufficient relative to manual segmentation by experts, which is still considered the ground truth, even though automatic segmentations have been repeatedly tried (345678910111213). Previously developed automated segmentation methods have generally shown lower accuracy than the ground truth methods, and in cases where these methods had higher accuracy, the validation was only performed on small datasets (91112). High signal intensity on DWI images with a b-value of 1000 (b1000) and low signal intensity on apparent diffusion coefficient (ADC) maps are well-known features representing acute infarction (1415). However, automatic segmentation based on thresholding of signal intensities seems to have limitations, since the signal intensities change over time in acute infarction and also vary across different magnetic resonance machines (216). Therefore, manual segmentation still plays an important role as the reference standard for definition of the maximal visual extent of high signal intensities on b1000 images, with the ADC images serving as a reference to avoid regions of T2 shine-through artifacts (317).
A deep learning algorithm using convolutional neural networks (CNNs) was recently introduced and applied to the segmentation of acute cerebral ischemia (3). The results from this deep learning algorithm were higher than those achieved with previous methods such as ADC thresholding and conventional machine learning. Using 741 subjects, Chen et al. (3) showed a mean accuracy of 0.67 (for the Dice coefficient), achieving accuracy values of 0.83 in larger lesions. The CNN simulates the organization of the animal visual cortex, which consists of multiple layers of neuronlike computational connections with minimal step-by-step processing, and deep learning algorithms with CNNs are suitable for classifying images in a large image repository (18). Deep learning using a CNN may be a promising method for the automatic segmentation of acute cerebral ischemia, showing the advantages and characteristics of end-to-end training and feature learning that automatically and adaptively enable the learning of hierarchical representations of patterns from low- to high-level features because acute cerebral ischemic lesions are often non-dominant and multiple with indistinct boundaries, and co-exist with other artifacts in images (318).
Therefore, we hypothesized that a deep learning algorithm using CNN could achieve higher performance than conventional methods in the automatic segmentation of acute cerebral ischemic lesions, and in this study, we intended to develope a deep learning algorithm using CNNs to segment such lesions on DWI and to compare our CNN-based method with conventional methods using thresholding-based segmentation, and with a widely used commercial algorithm.
MATERIALS AND METHODS
Study Population
This retrospective study was approved by our Institutional Review Board, which waived the requirement for informed consent. A total of 429 patients (men:women, 269:160; mean age, 72 years; age range, 24–98 years) who were registered on our stroke registry between September 2005 and August 2015 were retrospectively enrolled. These patients on the registry visited the emergency room because of symptoms of acute ischemic stroke and underwent magnetic resonance imaging (MRI) including DWI for hyperacute to acute infarction.
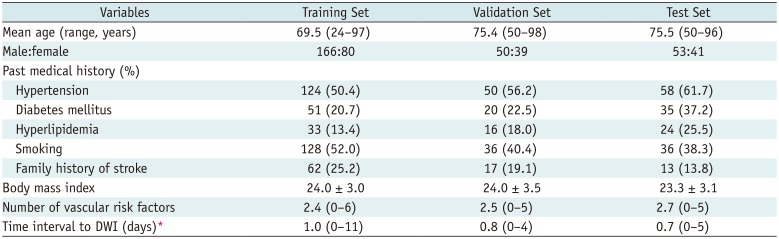
The demographic and clinical data of the patients were collected, including age, sex, body mass index, hypertension, diabetes mellitus, hyperlipidemia, obesity, alcohol and smoking history, activity and family history of stroke, and past medical history such as heart disease, history of stroke, and National Institutes of Health Stroke Scale rating (Table 1).
Imaging Acquisition
MRI was performed with various machines, including 1.5T (Magnetom Avanto, Siemens Healthineers, Erlangen, Germany; Genesis Signa, GE Healthcare, Milwaukee, WI, USA; Intera, Philips Healthcare, Best, Netherlands) and 3T scanners (Ingenia CX, Philips Healthcare; Achieva, Philips Healthcare). The parameters for the DWI sequences included the following: repetition time, 3000–8000 ms; echo time, 56–103 ms; flip angle, 90°; matrix, 256 × 256–512 × 512; FOV, 220 × 220–250 × 250 mm; number of excitations, 1–6; number of slices, 20–45; and slice thickness, 3–5 mm; b-value, 1000 s/mm2.
CNN Algorithm
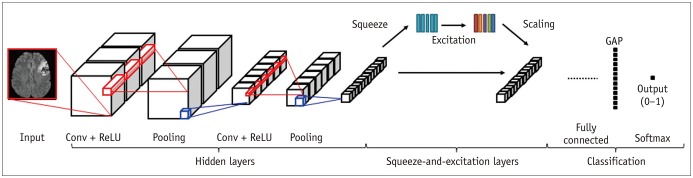
The CNN algorithm was constructed by adding squeeze-and-excitation blocks to two-dimensional (2D) U-Net with squeeze-and-excitation blocks (U-Net) and 2D DenseNet with squeeze-and-excitation blocks (DenseNet) architectures (19). U-Net and DenseNet are well-known CNN algorithms in the semantic segmentation of medical images (2021). The squeeze-and-excitation blocks capture dynamic and non-linear channel relationships using squeeze-and-excitation operations (22). The squeeze operation generates channel-wise descriptors that use global average pooling to represent the global information of each channel in feature maps. The excitation operations consist of fully connected layers and a rectified linear unit (23). The squeeze-and-excitation blocks were added to skip connections and dense blocks in U-Net and DenseNet, respectively. In the encoder-decoder model, all three types of blocks (encoder, bottleneck, decoder) were followed by a squeeze-and-excitation block (19). Finally, a U-Net with squeeze-andexcitation blocks (U-Net), a DenseNet with squeeze-and-excitation blocks (DenseNet), and an ensemble of U-Net and DenseNet with squeeze-and-excitation blocks (ensemble of U-Net and DenseNet) were constructed for semantic segmentation of acute ischemic lesions (Fig. 1). Linear intensity normalization was performed to generate arbitrary signal intensity values in standardized intensity ranges from b1000 images (24) before the deep learning performed using the CNN algorithm.
Image Analysis and Processing
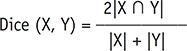
Two experienced neuroradiologists with 5 years and 8 years of experience, respectively, working in consensus manually drew regions of interest (ROIs) for acute ischemic lesions on DWI. The ROIs were drawn on whole DWI slices, based on the maximal visual extent of high signal intensities on the b1000 images, with the ADC images serving as reference to avoid regions of T2 shine-through artifact. These ROIs formed the ground truth data (17). These ground truth masks were accomplished using in-house software running under ImageJ. Two DWIs for the ground truth and algorithm masks were co-registered with non-rigid methods in each individual subject. The Dice indices were calculated between the ROIs from the ground truth and algorithms based on the following formula:
Deep Learning and Statistical Analysis
The datasets were divided into training (n = 246), validation (n = 89), and test (n = 94) sets based on random sampling. The Dice index (as an overlapping index) was used for evaluation of the algorithms. The CNN algorithms were trained and developed using the training and validation sets. The algorithms (U-Net, DenseNet, and an ensemble of U-Net and DenseNet) were then tested with the separate test set (processing time, 12 s per imaging slice), and the results were compared with those of two in-house thresholding algorithms and a commercial ADC thresholding algorithm (OleaSphere, Olea Medical, La Ciotat, France). The first in-house thresholding algorithm, referred to here as ADC-b1000, automatically segments acute ischemic lesions using ADC thresholds, and then adjusts them according to the b1000 signal intensity. The second in-house thresholding algorithm (b1000-ADC) automatically segments acute ischemic lesions according to b1000 signal intensity thresholds, and then adjusts them according to the ADC map. In the segmentation using b1000 signal intensities, we computed the global mean and standard deviation (SD) (i.e., µWM and SDWM) for b1000 intensities of every voxel within the normal white matter (WM) regions. We performed a three-dimensional connected component analysis and computed the mean b1000 value for each infarct component. Then, we determined the component having a mean b1000 value greater than or equal to the threshold value T (T = µWM + 1.5 × SDWM). Normalized absolute thresholding was applied to the segmentation using ADC values. For a given ADC map of each subject, we first constructed a quantile curve of ADC intensities within the brain mask. From the quantile-intensity curve, we found an intersection point between two tangent lines with maximum and minimum differential coefficients. The ADC maps were normalized by dividing the intensities on the ADC map by the intensity at the intersection point. Next, the normalized ADC map was thresholded using the optimal absolute threshold value of 0.835. The comparisons with the commercial ADC algorithm were performed using only 75 patients from the test set (from the test set of n = 94) due to segmentation failure using the commercial ADC algorithm. Paired t tests were used to compare the Dice indices from the CNN and conventional algorithms according to infarct volumes and numbers, b1000 signal intensities, time intervals to DWI, and DWI protocols. Permutation tests and 5-fold cross-validation were also performed in the entire sets, including training, validation, and test sets. The infarct volumes in the test set were divided into two groups: small lesions < 10 mL, and large lesions ≥ 10 mL. The number of infarcts (determined as the multiplicity parameter) in each subject was analyzed according to connected component labeling, with three classes being defined (≤ 5; 6–10; ≥ 11). The b1000 signal intensities were divided into three groups (< 50; 50–100; > 100). The time intervals to DWI were divided into three groups (< 6 hours; 6–24 hours; > 24 hours from the symptom onset). The correlation coefficients (r) between the infarct volume defined by each algorithm and the ground truth values were also calculated. All statistical analyses were performed using the statistical software packages MedCalc for Windows (version 15.0, MedCalc Software, Ostend, Belgium) and SPSS (version 20.0, IBM Corp., Armonk, NY, USA). Two-sided p values less than 0.05 were considered to indicate statistical significance.
RESULTS
Performance of the CNN Algorithm for Segmentation of Acute Cerebral Ischemia
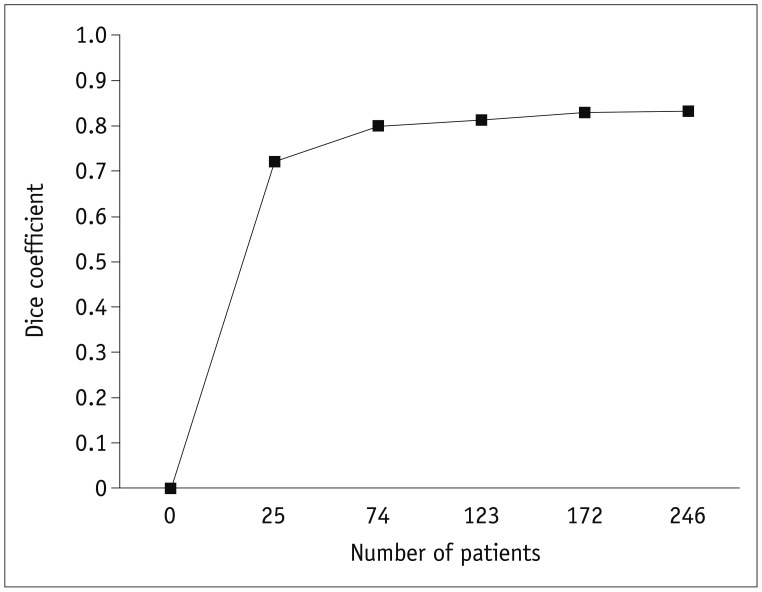
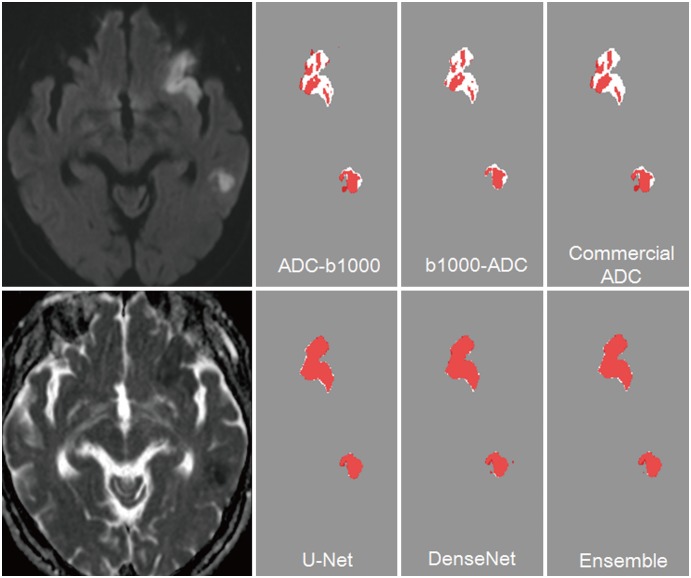
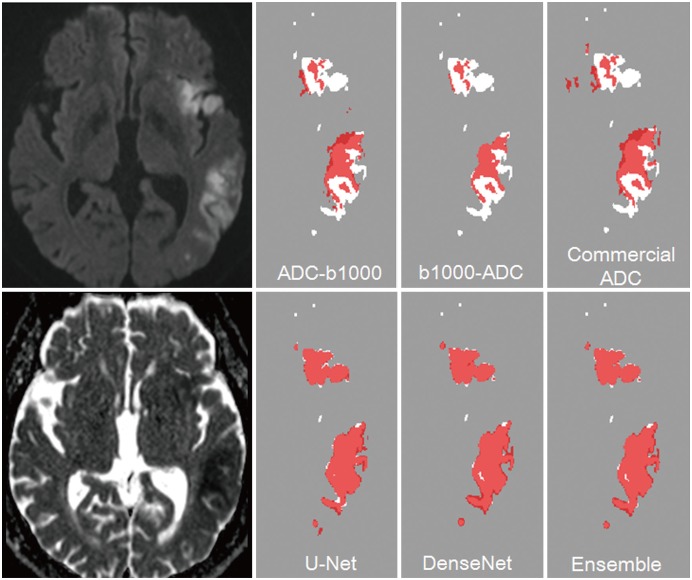
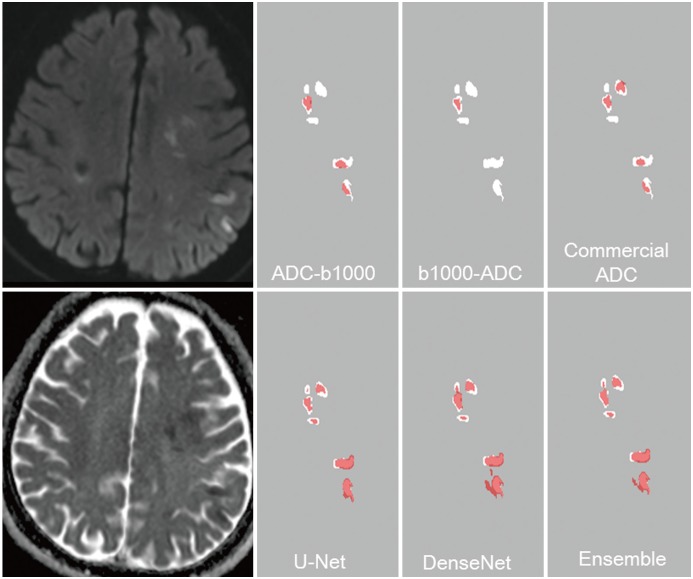
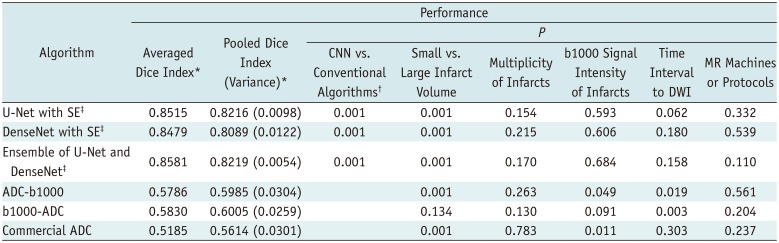
The segmentation performances are presented in Table 2. The Dice indices show a plateau from the 70th cumulative percentile (n = 172) (Fig. 2). Representative cases are presented in Figures 3 and 4. The Dice indices were as follows: U-Net, 0.85; DenseNet, 0.85; ensemble of U-Net and DenseNet, 0.86. The Dice indices for small and large lesions, respectively, were 0.81 and 0.88 with U-Net, 0.80 and 0.88 with DenseNet, and 0.82 and 0.89 with the ensemble of U-Net and DenseNet. There were no significant differences (p > 0.05) in the Dice indices of the CNN algorithms in relation to the multiplicity of infarcts, the b1000 signal intensities, the time intervals to DWI, and DWI protocols. However, there were significant differences (p < 0.01) in the Dice indices of the CNN algorithms between small and large lesions (Fig. 5).
Performance Comparisons between CNNs and Conventional Algorithms
The Dice indices for the conventional methods were as follows: ADC-b1000, 0.58; b1000-ADC, 0.58; commercial algorithm, 0.52. The CNN algorithms were superior to the ADC-b1000, b1000-ADC, and the commercial algorithm (p = 0.001). The Dice indices for small and large lesions, respectively, were 0.50 and 0.63 with ADC-b1000, 0.54 and 0.61 with b1000-ADC, and 0.41 and 0.58 with the commercial algorithm. There were significant differences (p < 0.01) in the Dice indices of the conventional methods between small and large lesions, except in the b1000-ADC method.
The correlation coefficients for the infarct volume between the algorithms and ground truths were 0.78 (95% confidence interval [CI], 0.68–0.85) for ADC-b1000, 0.75 (CI, 0.65–0.83) for b1000-ADC, 0.7 (CI, 0.56–0.80) for the commercial algorithm, 0.99 (CI, 0.98–0.99) for U-Net, 0.98 (CI, 0.97–0.99) for DenseNet, and 0.98 (CI, 0.98–0.99) for the ensemble of U-Net and DenseNet.
DISCUSSION
In this study, the CNN algorithms showed superior performance to the conventional methods in the segmentation of acute cerebral ischemia. The CNN algorithms showed Dice indices of ≥ 0.85, which were significantly better than those for the conventional segmentation methods, which showed Dice indices less than 0.6. The high segmentation performance of > 0.8 achieved with the CNN algorithms was preserved in subjects with small lesions and scattered infarcts, irrespective of the multiplicity of infarcts or their b1000 signal intensity. Therefore, we believe that the CNN algorithm could replace the conventional methods for automated segmentation of acute cerebral ischemia.
Automatic segmentation for acute cerebral ischemia is still challenging, even though previous reports have presented promising performances. Thresholding-based algorithms were preferentially considered in conventional methods because of the distinct high signal intensity of DWI and low ADC values in hyperacute to acute cerebral ischemia. Commercial software such as ‘Rapid Processing of Perfusion and Diffusion’ (RAPID) and OleaSphere adopt technical means based on low ADC values. However, the optimal ADC cutoff values for acute cerebral ischemia can vary, even though a cutoff value of 600 × 10−6 mm2/s is generally used (6). Therefore, other automatic segmentation methods have been developed, including machine learning approaches. Although another previously studied automatic segmentation method for DWI of acute cerebral ischemia presented a high diagnostic performance with a Dice index of 0.89 (13), the patient numbers used for the validation were very small (n = 10). Other previous segmentation methods have been subject to similar limitations, with the studies focusing on the development of new methods with insufficient validation and using low numbers of subjects in the training and validation sets. These studies and their Dice indices and patient numbers are as follows: Prakash et al. (9), Dice index = 0.6, n = 13; Maier et al. (11), Dice index = 0.65, n = 37; Mah et al. (4), Dice index = 0.79, n = 38; Mohd Saad et al. (10), Dice index = 0.84, n = 30; and Charoensuk et al. (8), Dice index = 0.85, n = 6. In the studies that were validated by substantial numbers of subjects, the newly developed segmentation methods seemed to require further development, as indicated by the following performances: Peng et al. (12), Dice index = 0.76, n = 98; Chen et al. (3), Dice index = 0.67, n = 741; and Boldsen et al. (5), Dice index = 0.61, n = 108. The common limitations of these segmentation methods make them difficult to apply in actual clinical practice. In this study, however, we validated the segmentation method with 426 subjects and obtained good segmentation performance with a Dice index above 0.85.
Chen et al. (3) recently reported the segmentation performance of a CNN algorithm tested on a large group of subjects (n = 741) with acute cerebral ischemia. They presented a mean Dice index of 0.67 for the segmentation performance over the total subject group. They developed a CNN algorithm involving two processes: using an ensemble of N adapted DeconvNets (EDD net) to optimize lesion segmentation, and then removing false positives from the detected lesions with a MUlti-Scale Convolutional Label Evaluation Net (MUSCLE net). The EDD Net was developed from the DeconvNet (25), which is one of the generic CNN architectures for semantic segmentation (3). In this study, we developed a segmentation method using U-Net and DenseNet (which are also well-known generic sematic segmentation algorithms), combining them with squeeze-and-excitation networks. U-Net adopts U-shaped symmetric architectures with an encoder to capture the context and a decoder to enable precise localization with upsampling operators; this enables precise segmentation tasks, even with small training images (20). DenseNet is also an effective semantic segmentation algorithm with high performance that requires fewer parameters than traditional networks. DenseNet connects each layer to every other layer in a feed-forward fashion and adopts multiple densely connected patterns, the so-called “dense blocks” (26). We developed the modified CNN by combining squeeze-and-excitation with two useful and effective CNN segmentation algorithms. However, one of the major difficulties in applying these segmentation methods to medical imaging is the loss of fine-grained information as a result of pooling in an encoding layer. To alleviate this problem, methods for enhancing the relationship with features significantly increased performance by introducing skip connection. The squeeze-and-excitation operations may help improve segmentation for discontinuous or small lesions, such as acute ischemic lesions, on DWI. Therefore, our proposed method is regarded as a fully CNN for segmenting size-invariant infarct lesions.
Chen et al. (3) reported segmentation performances of 0.61 for small lesions and 0.83 for large lesions. Our CNNs showed a high segmentation performance of 0.8 even in small lesions. Furthermore, the degree of DWI signal intensity and scattered lesions did not affect the segmentation performance. In addition, the DWI protocols in this study varied considerably because of the retrospective study design and substantial outside images. However, the segmentation performances were preserved across the different protocols and machines.
The conventional segmentation methods showed inferior results to the CNN algorithms. The threshold-based methods and commercial version showed Dice indices of 0.58 and 0.52, respectively. Although the threshold-based methods were in-house algorithms, their performance outcomes were higher than those reported by Boldsen et al. (5). They reported Dice indices of 0.4 (threshold-based methods using DWI signal intensity) and 0.3 (threshold-based methods using ADC values) in 108 patients with acute cerebral ischemia (5). In this study, the commercial ADC algorithm showed a strong correlation with the ground truth data in terms of volume, as did the RAPID system in a previous study (6). Therefore, the conventional algorithms evaluated in this study had similar or superior segmentation performance to the conventional algorithms described in previous reports. Nevertheless, the CNN algorithms showed superior segmentation performances to the conventional algorithms.
This study is subject to several limitations. First, the CNN algorithm was validated in only a single referral center using a retrospective registry. Therefore, the CNN algorithm requires external validation with prospectively enrolled patients or a strictly controlled registry. Second, although we tried to enroll as many patients as possible and demonstrated the saturated performance of the CNN algorithm as the patient number increased, further data may be warranted. Third, inter-observer variability was not evaluated in this study, even though the achieved Dice index of 0.84 is within or out of the range indicating inter-observer variability. Further investigations regarding the reproducibility of this new algorithm are therefore warranted.
In conclusion, the CNN algorithm for automatic segmentation of acute ischemic lesions on DWI achieved Dice index values greater than or equal to 0.85 and showed superior performance to conventional algorithms. Our segmentation method showed a stable segmentation performance across the various DWI protocols, even in subjects with small and scattered lesions, and irrespective of the multiplicity or b1000 signal intensity of the infarcts.
 XML Download