

 PDF
PDF ePub
ePub Citation
 Print
Print


Introduction
The genus Phlomis, perennial herbs of the Lamiaceae family, consists of more than 100 species distributed throughout Asia, Africa, and Europe.12 Phlomis umbrosa Turcz. [Korean name as Han Sok-Dan] is distributed in several countries of the Southeast Asia. The roots of P. umbrosa (Phlomidis Radix) have been traditionally used for treatment of the hemorrhage, bronchitis, and cold.3 Previous phytochemical investigations of the genus Phlomis have shown that they contain phenolics, iridoids, flavonoids, phenylethanoids, lignans, neolignans, diterpenoids, alkaloids and essential oils.45 The separation and determination of the active constituents in medicinal plant extracts represent a viable method to achieve standardization and quality control. However, multifarious constituents in the complex extracts of Phlomis species have not been quantitated. Additionally, there is no report about the anti-oxidant and cytotoxic properties of the major constituents from the roots of P. umbrosa.
Nowadays, the chaotic use of two similar Korean traditional medicinal drug names between Sok-Dan (Dipsaci Radix, the roots of Dipsacus asperoides) and Han Sok-Dan (Phlomidis Radix, the roots of P. umborosa) has become a problem for affecting national health. However, the efficacies of these two traditional drug species are quite different.6 Concretely, Dipsasi Radix is used as a traditional medicinal plant for strengthening bone and healing fracture, whereas Phlomidis Radix has no effect on bone growth.78 Therefore, that is necessary to clarify for the avoidance of misusage between two herbs. There are several studies using HPLC development method to find bioactive constituents from medicinal plants. The aims of this study were focused on the isolation and the development of new HPLC analytical method for the major compounds from the roots of P. umbrosa. Additionally, their anti-oxidant activity was evaluated based on above developed method. Furthermore, the cytotoxic activity was also examined.
Experimental
General experimental procedures
Unless specified, all used reagents were of analytical grade. The nuclear magnetic resonance (NMR) spectra were measured in methanol-d4 on an Oxford AS 400 MHz instrument (Agilent, Santa Clara, CA, USA). Column chromatography was performed on silica gel (Merck, Darmstadt, Germany; 63 – 200 µm particle size). Fractions were monitored by thin layer chromatography (TLC), and spots were visualized by spraying with ethanol containing 10% H2SO4, followed by heating. Gilson semi-preparative HPLC systems were carried out with an UV detector and an Optima Pak C18 column (10 × 250 mm, 10 µm particle size, RS Tech. Corp., Korea). The quantitative analyses were conducted on an HPLC chromatography (Waters, Houston, TX, USA) and a Kinetex C18 column (4.6 × 250 mm, 5 µm particle size; Phenomenex, Torrance, CA, USA). Data handling was managed by Empower v.3.0 software.
Plant material collection
Five plant materials of P. umbrosa were identified and authenticated by Prof. Byung Sun Min. Samples 1 – 5 were marked as PU1 – PU5. Sample PU1 (Yeongwol-gun, Gangwon-do) was collected in March 2016, and used for isolation and validation. Four comparing samples (PU2 – PU5) were harvested in August 2016, at different geographic regions in Korea (PU2: Uiseong-gun, Gyeongsangbuk-do; PU3: Andong-si, Gyeongsangbuk-do; PU4: Yeongcheon-si, Gyeongsangbuk-do; PU5: Taebaek-si, Gangwon-do). The voucher specimens (PU1 – PU5) of the plants were deposited in Herbarium at College of Pharmacy, Catholic University of Daegu, Korea.
Isolation of the chemical constituents
The dried roots of P. umbrosa (PU1, 500 g) were extracted with standing 80% ethanol (10 L× 3 times) at 80 ℃ for 5 h. The combined water extract was filtered and concentrated in vacuo to afford water crude extract (180 g). This extract was then suspended in water (6 L) and partitioned between H2O and n-BuOH to give the n-BuOH fraction (82 g). The n-BuOH fraction was chromatographed by using a silica gel column (63 – 200 µm particle size, 10 × 120 cm), eluting with a CH2Cl2/MeOH/H2O gradient system (10: 1:0.1 to 1:1:0.1, each 5 L) to yield six combined fractions (PU1 – PU5) according to their TLC profiles. Fraction PU3 (2.3 g) was purified by using a semi-preparative Gilson HPLC system [RS Tech Optima Pak C18 column (10 × 250 mm, 10 µm particle size); mobile phase ACN-H2O containing 0.1% formic acid (10 – 30% for 50 min); UV detection at 247 nm] to give compounds 4 (5.1 mg), 5 (100 mg), 6 (72 mg), 7 (5.5 mg), 8 (6.7 mg), 9 (6.0 mg), and 10 (8.3 mg). Similarly, fraction PU5 (2.8 g) was also purified by HPLC using a gradient solvent system ACN-H2O containing 0.1% formic acid (2:98 to 30:70 for 40 min) with UV detection at 247 nm to give compounds 1 (15 mg), 2 (110 mg), and 3 (10.2 mg).
Preparation of calibration standards solutions
Standard stock solutions were prepared separately for each analytical standard and internal standard (IS) in 2 mL MeOH at 1000 µg/mL and diluted with MeOH to obtain appropriate concentrations for content determination. The solutions were transferred to 10 mL glass brown vials, sealed using elastic plastic film (Parafilm, Chicago, IL, USA) and stored in a refrigerator (4 ℃) for analysis.
HPLC instrument and chromatographic conditions
The quantitative analyses were conducted on an HPLC chromatography (Waters, Houston, TX, USA) equipped with an autosampler, degasser, quaternary solvent pump, and photodiode array detector (PDA). Separation was carried out on a Kinetex C18 column (4.6 × 250 mm, 5 µm particle size; Phenomenex Torrance, CA, USA) protected by a C18 RP guard column (10 × 3.2 mm, particle size 5 µm). The flow rate for mobile phase was set at 1 mL/min and the injection volumes were 10 µL. UV detection was recorded at the wavelengths of 233 and 327 nm. The mobile phase consisted of solvent A (H2O containing 0.1% formic acid) and solvent B (ACN), and gradient elution was conducted as follows: 7 – 35% (B) for 30 min.
Method validation
The validation parameters of the developed HPLC-PDA method for the roots of P. umbrosa were linearity, limit of detection (LOD) and limit of quantitation (LOQ), accuracy, precision, stability, and robustness. Accurately weighed 10 markers were dissolved in methanol 1000 µg/mL to make stock solutions, which were then diluted to produce eight different concentrations for each marker. Linearity was determined by plotting the measurements of area peak ratios (analyte/IS) versus concentrations of analytical standards. The sensitivity was expressed by the LOD and LOQ. The LOD represents the lowest concentration that can be reliably determined at a signal-to-noise (S/N) ratio of 3. The estimate for the LOQ was calculated using S/N ratio of 10. Intra-day (n = 5) and inter-day (n = 5) precisions and accuracies were evaluated by analyzing sets of five independent samples at the low, mid, and high concentration levels. The precision was expressed as RSD% and the accuracy was expressed as bias. The stability of analysis of isolated compounds was tested by analyzing the sample solution of roots of P. umbrosa through storing extract solution in the dark at 4 ℃ and room temperature (25 ℃). The two samples were analyzed in triplicate at 0, 1, 3, 7, 15, and 30 days separation.
Determination of DPPH-HPLC assay
The anti-oxidant activities of marker compounds in methanol extract were carried out using a DPPH-HPLC assay9 with a slight modification. Briefly, 180 µL of DPPH solution (0.32mM in methanol) was added to 30 µL of the methanol extract of P. umbrosa roots (0.5 g/25mL). After incubation for 15 min in a darkroom, the solution was analyzed by an HPLC using the developed method. The mixture of sample solution (30 µL) with methanol (180 µL) was used as a control. UV detection was recorded using the above analytical HPLC condition at the wavelength of 247 nm. The decreases in peak areas are expressed as a quantitative reduction. The peak area reduction (PAR, %) was calculated as follows: (Aa − Ab) / Aa × 100%, where Aa and Ab are the HPLC peak areas of the compound incubated without and with the DPPH methanol solution, respectively.
Radical scavenging assay (DPPH)
The DPPH assay was performed to determine the free radical scavenging activity of isolated compounds. Briefly, a 0.20 mM solution of DPPH was previously prepared in methanol, after that 150 µL of this solution was mixed to 50 µL of each compounds at various concentrations (50, 25, 5, 1 µg/mL) in methanol. After 15 min incubation in the dark room, the decrease in the absorbance of the solution was measured on a Titertek microplate reader at 517 nm (Multiskan MCC/340, MKII Microplate Reader). L-Ascorbic acid was used as the positive control. DPPH inhibitory activity was expressed as the percentage inhibition (%) in the above assay system, and was calculated as [1 − (As − Ab / Ac)] × 100%, where As is the absorbance of DPPH solution (150 µL) with the sample solution (50 µL); Ac is the absorbance of the DPPH solution (150 µL) with methanol (50 µL); Ab is the absorbance of methanol (150 µL) with the sample solution (50 µL). The results were expressed as IC50 (50% inhibitory concentration) values.
Cell lines and culture
Human promyelocytic leukemia (HL-60) cells, human cervical adenocarcinoma (HeLa) cells, and MCF-7 (human breast adenocarcinoma) cells, were obtained from the America Type Culture Collection (ATCC) and cultured as per the guidelines supplied. The cells were maintained in RPMI or IMDM (Gibco BRL, NY, USA) (containing: 10% fetal bovine serum, 2% penicillin, 100 µg/mL streptomycin, and 2mM L-glutamine) at 37 ℃ in a 5% CO2 incubator.
Cytotoxic activity assay
The cytotoxic activity was tested on MTT assay.10 Viable cells were plated at a density 1 × 10⁴ cells/well into 96-well microtiter plates and then incubated at 37 ℃ in a 5% CO2 incubator. The cells were further treated with test sample at different concentrations (1, 5, 25, and 50 µM) added in DMSO-dissolved stock solution and the final DMSO concentration was not over 0.1%. The cells were cultured for 48 h, and they were then incubated with MTT (a 5 µg/mL final concentration) for 4 h. After centrifuging for 5 min at 1500 rpm, the medium in plates was removed, and resulting formazan crystals were dissolved in DMSO. The optical density was measured on a Titertek microplate reader at 570 nm (Multiskan MCC/340, MKII Microplate Reader). The cytotoxicity was expressed as IC50 (50% inhibitory concentration) value.
Statistical analysis
Tests were conducted in the means triplicate assays ± standard deviation. The statistical significance was determined by using SPSS software (Version 22.0, SPSS Inc. Chicago, IL, USA). Statistical significances were defined at p ≤ 0.05.
Optimization of chromatographic condition
The isolated compounds (1 – 10) were first tested for purity. All the compounds were evaluated with above 98% pure by using HPLC/PDA system; therefore, their absorbance was measured. Compounds 1 – 3, and 5 provided the same absorbance characteristics with a maximum at 233 nm meanwhile compounds 4 and 6 – 10 also displayed the same absorbance characteristics with a maximum at 327 nm within the range 190 – 400 nm in UV scanning. Hence, the wavelength of 233 nm was used for compounds 1 – 3, and 5, and the wavelength of 327 nm was used for compounds 4 and 6 – 10. The mobile phase comprising methanol and water containing 0.1% formic acid system was initially tried to develop a separation method. However, that system was unsatisfactory for separating major components. Acetonitrile (A) and water containing 0.1% formic acid (B) system were used to improve the separation. Finally, a simple gradient solvent system elution method from 93:7 (B) to 65:35 (B) for 30 min was used. Isochlorogenic acid with a retention time of 19.5 min was selected as an internal standard. Ten marker compounds were well separated without overlapping of adjacent peaks. The chromatographic peaks of the analytes in the sample solution were determined by comparing their retention times with those of the individual standards, and were confirmed by spiking the samples with the individual compounds.
Optimization of sample preparation condition
Sample preparation: The dried roots of P. umbrosa were grinded for 5 min and were then sieved through a 250 µm sieve to ensure required sample homogeneity. The mixtures of solvent systems were used as following: 95%, 75%, 50%, 25% ethanol and 100%, 75%, 50%, 25% methanol for extraction solvents. The P. umbrosa samples (0.5 g) extracted with 25 mL of above solvents for 30 min at room temperature in an ultrasonic bath. As a result, the best compound peak area/I. S. areas were obtained at sample 100% methanol used. Therefore, 100% methanol was selected for extraction solvent. In comparison between ultra-sonication and reflux method using 100% methanol extraction solvent, the sample assay results were superior after extraction with sonication than with reflux. The time needed for complete extraction was determined with five lengths of time (30, 45, 60, 75, and 90 min) in 100% methanol via sonication at room temperature. The extraction time for 60 min yielded similar sample assay results as 75 min. Thus, the compounds were thoroughly extracted when the time was 60 min.
Linearity
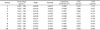
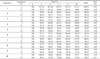
The linearity of the developed method was validated by analyzing eight concentrations of each analytein the range of 0.625 to 500 µg/mL. The concentration range is generally chosen as per International Conference on Harmonization guidelines. Triplicate analysis for each analyte was carried out. The linearity regression parameters of the calibration curves with correlation coefficients ranging between 0.9982 and 0.9997 are listed in Table 1. The LOD of these isolated constituents were determined to be 0.013 to 0.430 µg/mL and the LOQ was 0.042 to 1.435 µg/mL indicating that the developed method for the roots of P. umbrosa exhibited good sensitivity.
Precision and accuracy
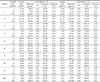
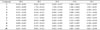
The accuracy of the developed HPLC method was determined by analyzing the known amounts of analytes spiked into methanol extract solution of the roots of P. umbrosa. After addition of known amounts of each analyte to the previous methanol extract, solution recovery studies were examined. The results were shown in Table 2. The method precision was measured by six successive injections, and the precisions were less than 3.28% in intra-day and 4.83% in inter-day. The accuracies of the method were in the range 84.87 – 105.08% in intra-day and 80.56 – 111.34% in inter-day. The method validation indicated that the regression equations of the marker compounds were linear and this method was precise, accurate, and reliable for quantitation of the 10 marker compounds (1 – 10).
Stability
The stability of the analytes at room temperature was measured at 0, 1, 3, 7, 15, and 30 days. Under lightless temperature (25 ℃) and 4 ℃, all marker compounds (1 – 10) displayed stable with recovery ranging from 97.39 to 100.93%. The results were shown in Table 3.
Result and Discussion
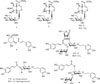
Chromatographic separation and purification of n-BuOH fraction from the roots of P. umbrosa led to the isolation of 10 compounds (1 – 10). These compounds (1 – 10) were identified as lamalbid (1),11 sesamoside (2),12 shanzhiside methyl ester (3),12 chlorogenic acid (4),13 barlerin (5), 11 forsythoside B (6),14 1′-O-β-(3,4-dihydroxyphenyl)-ethyl-4′-O-caffeoyl-α-L-fucopyranosyl-(l → 3′)-β-D-glucopyranoside (7),15 verbascoside (8),1 isoverbascoside (9),16 alyssonoside (10)14 by comparison of their 1H and 13C NMR with those reported data (Fig. 1).
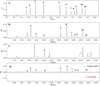
A gradient RP-C18 HPLC system was performed for the simultaneous quantitative determination of 10 compounds (1 – 10). The contents of isolated constituents from the roots of P. umbrosa were listed in Table 4. The major constituents in five different samples were compounds 2, 5, and 6 at the concentrations of 0.855 ± 0.05 to 1.732 ± 0.014, 0.505 ± 0.02 to 0.937 ± 0.03, and 0.349 ± 0.07 to 2.111 ± 0.025% on dry weight basis, respectively. To elucidate the chemical constituents between D. asperoides and P. umbrosa, the D. asperoides samples were also analyzed by the developed method. The results exhibited that all the marker compounds (1 – 10) in the D. asperoides samples disappeared in the chromatogram (Fig. 2C) except for compound 4 (0.919 ± 0.002%). This evidence indicated that such misusage between Phlomidis Radix and Dipsaci Radix was incorrect.
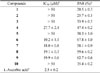
The potential anti-oxidant activities of marker compounds in the methanol extract were simply identified by the DPPH-HPLC. The peak areas of anti-oxidants will decrease or disappear in the HPLC chromatogram after spiking with DPPH. In our results, the peak areas of all 10 peaks were decreased after spiking with DPPH (Fig. 2). When 10 compounds exist together, phenylethanoid (4 and 6 – 9) first react with DPPH. Particularly, phenylethanoid compounds, 4 and 6 – 9, significantly reduced the peak areas with PAR values ranging from 47.4 ± 0.2 to 67.8 ± 1.0% (Table 5). Compound 6 displayed the highest DPPH-radical scavenging activity with PAR value of 67.8 ± 1.0%. Compounds 7 – 9 showed considerable scavenging capacities with PAR values of 58.1 ± 0.9, 59.6 ± 0.2, and 62.7 ± 0.6%, respectively. While phenylethanoid compound 10 exhibited the weakest one (PAR = 35.4 ± 0.2%). In contrast, iridoid compounds, 1 – 3 and 5, displayed low DPPH scavenging capacity with PAR values ranging from 20.5 ± 0.3 to 38.3 ± 1.0%. All these results are in agreement with the individual compounds tested where compound 6 showed the highest anti-oxidant capacity.
DPPH assay was used to determine the anti-oxidant capacities of isolated compounds (1 – 10). The results were reported in Table 1. Most of phenylethanoid compounds (4 and 6 – 9) displayed high anti-oxidant capacities with IC50 values of 27.7 ± 2.4, 10.2 ± 1.1, 18.0 ± 0.8, 19.1 ± 0.3, and 19.9 ± 0.6 µM, respectively. L-Ascorbic acid was used as the positive control with IC50 value of 2.5 ± 0.2 µM. In contrast, iridoid compounds (1 – 3 and 5) and phenylethanoid compound 10 were inactive (IC50 values > 50 µM) (Table 5). DPPH free radical scavenging method is often used for evaluating the anti-oxidant potential of a compound or an extract. This is a rapid, simple, and widely used method to test the anti-oxidant activity. DPPH can accept an electron or hydrogen radical to become a stable and diamagnetic molecule. In general, the compounds possessing potent hydrogen donors are capable for reacting with DPPH radicals. The compounds with several hydroxyl groups could serve as hydrogen donors. Therefore, compounds 4 and 6 – 9 having several hydroxyl groups in aromatic ring may display stronger DPPH radical scavenging activities.
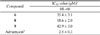
The cytotoxic activity of the isolates (1 – 10) was evaluated against HL-60 as well as MCF-7 and Hela cell lines. The inhibitory process was assessed by MTT assay. According to the results, compounds (6, 8, and 9) significantly showed cytotoxic effects against HL-60 cell lines with IC50 values of 35.4 ± 3.1,18.6 ± 2.0, and 42.9 ± 3.0 µM, respectively. Whereas, iridoids (1 – 3 and 5) and phenylethanoids (4, 7, and 10) were inactive (IC50 values > 50 µM). These compounds were also tested against MCF-7 and HeLa cell lines. Nevertheless, all the isolates displayed very weak or inactive (IC50 value > 50 µM) (Table 6).
Four iridoids (1 – 3 and 5) and six phenylethanoid derivatives (4, 6 – 10) were isolated from the roots of P. umbrosa. Particularly, a new analytical HPLC/PDA method has been developed, validated, and successfully applied to determine the 10 marker compounds (1 – 10) in the roots of P. umbrosa. In DPPH assay, compounds 4 and 6 – 9 showed considerable anti-oxidant effects. In addition, these compounds were also evaluated and exhibited significant peak area reduction by using the DPPH-HPLC system. All the isolated compounds were further tested in cancer cell lines (HL-60). Compound 8 displayed significant cytotoxic activity against HL-60. Compounds 6 and 9 showed moderate cytotoxic effects against HL-60. These results suggested that roots of P. umbrosa may be a potent functional food or pharmaceutical ingredient as an anti-oxidant.
 XML Download