

 PDF
PDF ePub
ePub Citation
 Print
Print


INTRODUCTION
Chronic spontaneous urticaria (CSU) is defined as the occurrence of spontaneous wheals, angioedema, or both for more than 6 weeks.1 The EAACI/GA2LEN/EDF/WAO guidelines recommend modern, second-generation, H1-antihistamines as the first-line therapy. If the symptoms are inadequately controlled after 2-4 weeks, up-dosing second-generation H1-antihistamines up to 4-fold is recommended.1 For antihistamine-unresponsive CSU, omalizumab and cyclosporine A (CsA) are recommended as add-on therapy. However, CsA is an off-label use for urticaria.
CsA, a potent immunosuppressive drug, inhibits TH cells by blocking the production of inflammatory cytokines. The complex between CsA and cyclophilin inhibits the phosphatase activity of calcineurin, which down-regulates the transcription of cytokine genes (interleukin [IL]-2, IL-2; IL-3; IL-4; and tumor necrosis factor alpha [TNF-α]).2 In vitro studies showed that pre-incubating leukocytes with CsA inhibited histamine release after stimulation with sera from CSU patients.3 CsA has been shown to reduce histamine, leukotriene, and prostaglandin release by mast cells and basophils both in vitro and in vivo.4 Harrison et al.5 showed that CsA inhibited the IgE-mediated histamine release from mast cells by a concentration dependent effect. Grattan et al.6 reported a reduction in serum histamine-releasing activity and the autologous serum skin test (ASST) response after CsA treatment. Also, CsA reportedly reduces serum levels of IL-2R, IL-5, and TNF-α.7 These findings support the hypothesis that the mechanisms of CsA in CSU may involve effects on activated T cells, basophils, mast cells, and perhaps other cells.
A meta-analysis study showed overall response rates of CSU to CsA treatment of 54%, 66%, and 73% at 4, 8, and 12 weeks, respectively.8 There are increasing reports of potential factors of CsA treatment response. The study of reliable factors could lead to a personalized approach and would serve as an objective follow-up for patients. We then performed a systematic review to identify factors which may potentially predict a favorable response to CsA treatment for CSU.
MATERIALS AND METHODS
The systematic literature review was done according to the Preferred Reporting Items for Systematic Reviews and Meta-Analysis recommendations.9
Search strategy and eligibility criteria
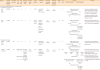
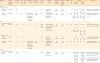
A literature search of electronic databases (PubMed, Medline, Web of Science, EMBASE, and The Cochrane Library) was performed using the term “chronic spontaneous (or idiopathic) urticaria and ciclosporin (or cyclosporine or cyclosporin).” Then all articles that related to factors predicting the response to CsA treatment in patients with CSU were later selected. CsA either the microemulsion formulation (Neoral, Novartis, Basel, Switzerland and generic euivalents) or the original formulation (Sandimmun, Novartis, Basel, Switzerland and generic euivalent) was included in this study. The eligibility criteria for included reports were: i) randomized controlled trials (RCTs) and non-RCTs; ii) CSU patients treated with CsA; and iii) any reported factors that were or were not significantly associated with a response to CsA treatment. In vitro studies, review articles, case reports, case series, comments, and replies were excluded. Non-English articles and non-full-text publications were excluded. The remaining articles were initially screened by 2 independent reviewers (K.K. and C.S.), who subsequently obtained full texts and reviewed them for eligibility. Thirteen relevant articles were systematically reviewed (Figure).
 | FigureFlow diagram of literature review in this study. Thirteen studies met the inclusion criteria and were included in our systematic review.CsA, cyclosporine A; CSU, chronic spontaneous urticaria; RCT, randomized controlled trial; ASST, autologous serum skin test; BHRA, basophil histamine release assay; CRP, C-reactive protein; ESR, erythrocyte sedimentation rate; ANA, antinuclear antibody; TA, thyroid autoantibody; Ig, immunoglobulin; CIC, circulating immune complex; IL, interleukin; TNF-α, tumor necrosis factor alpha.
*For analysis of relationship between clinical factors—including prior histories of urticaria, disease severity and disease duration—4 studies were included13162223; †For the correlation between histamine-releasing activity and CsA response in CSU, 8 studies were included614151618192123, involving the ASST,6151618192123 and BHRA61416; ‡Three studies showed a correlation between coagulation and inflammatory factors and the CsA response, involving D-dimer,13 CRP,131722 and ESR13; §Autoantibodies, including ANA,1622 TAs,131622 and other autoantibodies2223 were shown in 4 studies; llFour studies showed a correlation between cytokines and the CsA response, involving immunophenotypical lymphocytes (CD3, CD4, CD56, CD57, CD19, CD19+CD5+, and CD19+CD23+)20; Igs, C3, C4, and CICs20; serum IgE22, 23; IL-2; IL-5; and TNF-α.7
|
Data extraction and bias assessments
The data extraction was independently conducted by 2 reviewers. The following characteristics were identified in each study: i) the first author's name and the publication year; ii) study design; iii) number of CsA-treated patients and controls; iv) number of studied patients; v) CsA dose and treatment duration; vi) severity and treatment-response assessment; and vii) predicting factors for a CsA response. Discrepancies were resolved by consensus discussion between the authors. In the case of RCTs, the quality and risk of bias were assessed using Cochrane Collaboration's tool for assessing the risk of bias,10 and for non-RCTs, the Methodological Index for Non-Randomized Studies (Supplementary Table S1).11 The studies identified as being relevant to a CsA response in CSU were assessed for their evidence levels using the Grading of Recommendations Assessment, Development and Evaluation system.12
RESULTS
Literature search results
A total of 13 studies (404 patients with CSU and 200 healthy patients) met the eligibility criteria and were included in our systematic review (Figure).671314151617181920212223 There were 1 RCT6; 8 open-labelled, prospective studies713151718202123; and 3 retrospective studies.141622 One study was an RCT at first, but was subsequently switched to an open-labelled, prospective study because of control failures.19 The quality and risk of bias of the studies included were shown in Supplementary Table S1.
Potential factors for response to CsA treatment
We classified factors into 5 categories: clinical factors, histamine-releasing factors, coagulation and inflammatory factors, autoantibodies, and cytokines. Because 1 study might report more than 1 outcome, so each study might be shown in more than 1 table.
Clinical factors (Supplementary Table S2, Table 1)
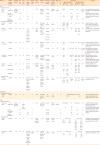
Table 1
Study characteristics of included articles: clinical factors
| Study (yr) | Treatment (marketed formulation of CsA) | Concomitant medication | Total case (No.) | Study case (No.) | CsA dosage (mg/kg/day) | Treatment duration (wk) | Severity assessment | Definition of response | Percentage of responses (duration)* | Percentage of complete responses (duration)† | Relapse (%) | Drop out (%) | Outcome | Conclusion | |||||
|---|---|---|---|---|---|---|---|---|---|---|---|---|---|---|---|---|---|---|---|
| Before CsA treatment | After CsA treatment | ||||||||||||||||||
| Prior history of urticaria, disease severity, or disease duration | |||||||||||||||||||
| Open-labelled prospective study | |||||||||||||||||||
| Endo et al. (2019)23 | CsA (N/A) | N/A | 34 | 34 | 3 | 4 | UAS7‡ | -Good clinical response: UAS7 ≤ 6 at wk 4 | 38 (overall) | 38 (overall) | 0 | 0 | Baseline disease severity | There was no significant association between clinical response to CsA and baseline disease severity or duration (P = 0.081, P = 0.165, respectively). | |||||
| UAS7‡ (mean ± SD) | |||||||||||||||||||
| 33 (range 20–42) | N/A | ||||||||||||||||||
| Disease duration | The change in UAS7 before and after treatment with CsA was significantly different (P < 0.0001). | ||||||||||||||||||
| Duration of urticaria (median, wk) | |||||||||||||||||||
| 72 | - | ||||||||||||||||||
| Asero (2015)13 | CsA (N/A) | N/A | 29 | 29 | 4 | 12 | 5-point response score§ | -Remission: complete absence of symptoms | 86 (overall) | 59 (overall) | 24 | N/A | Baseline disease severity | Baseline UAS and disease duration were not associated with the clinical response to CsA (P = 0.906 and 0.252, respectively). | |||||
| -Good: 50%–80% improvement | UAS∥ (mean ± SD) | ||||||||||||||||||
| -Partial: some benefit | 4.3 ± 0.5 | N/A | |||||||||||||||||
| Response rate, No. (%) | |||||||||||||||||||
| - | -CR: 17 (58.6%) | ||||||||||||||||||
| -PR: 8 (27.6%) | |||||||||||||||||||
| -NR: 4 (13.8%) | |||||||||||||||||||
| Disease duration | |||||||||||||||||||
| Duration of urticaria (mean, wk) | |||||||||||||||||||
| 136 | - | ||||||||||||||||||
| Response rate, No. (%) | |||||||||||||||||||
| - | -CR: 17 (58.6%) | ||||||||||||||||||
| -PR: 8 (27.6%) | |||||||||||||||||||
| -NR: 4 (13.8%) | |||||||||||||||||||
| Retrospective chart review | |||||||||||||||||||
| Santiago et al. (2019)22 | CsA (N/A) | N/A | 34 | 34 | 3 | 12 | UAS7‡ | -Good clinical response: UAS7 ≤ 6 at wk 12 | 53 (overall) | 53 (overall) | 0 | 0 | Baseline disease severity | No associations were found between response to CsA and disease severity and disease duration. | |||||
| UAS7‡ (median, range) | |||||||||||||||||||
| 30 (range 27.25–35) | N/A | ||||||||||||||||||
| Disease duration | |||||||||||||||||||
| Duration of urticaria (median, wk) | |||||||||||||||||||
| 256 | - | ||||||||||||||||||
| Hollander et al. (2011)16 | CsA (N/A) | N/A | Disease severity | 1 (increased 25–50 mg every 2–4 wk after remission, kept stable for 6 months, then weaned off) | 20.8 (median) | N/A | -Complete remission: ≤ 1 day of having urticarial lesion per month | 94.1 (overall) | 78 (overall) | 13.2 | 29.4 | Baseline disease severity | Prior history of urticaria, either acute or chronic, was found to predict a favorable response to CsA (P = 0.01). | ||||||
| 68 | 62 | Prior history of urticaria | |||||||||||||||||
| Positive | Negative | Positive | Negative | ||||||||||||||||
| N/A | N/A | N/A | N/A | Having a shorter duration of current episode of urticaria was found to be associated with good clinical response to CsA (55 wk for complete responders, compared with 259 wk for non-responders) (P = 0.03). | |||||||||||||||
| -CR: 93% | -CR: 67% | ||||||||||||||||||
| Disease duration | Disease duration | ||||||||||||||||||
| 68 | 68 | Duration of current episode of urticaria (mean; wk) | Duration of current episode of urticaria (mean; wk) | ||||||||||||||||
| 100 | N/A | ||||||||||||||||||
| Response rate, No. (%) | |||||||||||||||||||
| - | -CR: 53 (78%) | ||||||||||||||||||
| -PR: 11 (16%) | |||||||||||||||||||
| -NR: 4 (6%) | |||||||||||||||||||
CsA, cyclosporine A; N/A, data was not available in the study; UAS, urticaria activity score; SD, standard deviation; CR, complete response; PR, partial response; NR, no response.
*Response, improvement of clinical score at 30%–90%; †Complete response, improvement of clinical score at > 90%; ‡Sum of 7 days of daily UAS (range from 0–42) daily UAS total score of 2 categories: 1) intensity of pruritus (0 = none, 1 = mild, 2 = moderate, 3 = intense), 2) number of wheals (0 = none, 1 = 1–20 wheals, 2 = 20–50 wheals, 3 = more than 50 wheals); §5-point response score: 0 = no response, 1 = partial response, 2 = good response, 3 = excellent and 4 = remission; llUrticaria Activity Score, total score of 2 categories: 1) Intensity of pruritus (0 = none, 1 = mild, 2 = moderate, 3 = intense), 2) Number of wheals (0 = <10 small wheals, 1 = 10–50 small wheals or 10 large wheals, 2 = >50 small wheals or 10–50 large wheals, 3 = almost covered).
![]()
1) History of urticaria
Hollander et al.
16 performed a retrospective study of 62 CSU patients receiving 1 mg/kg/day of CsA every 2 to 4 weeks. They concluded that prior histories of acute or chronic urticaria predicted favorable responses to CsA (P = 0.010).
2) Disease severity
Three articles (2 open-labelled, prospective studies; 1 retrospective study) examined associations between baseline disease severity and clinical response to CsA. Asero13 performed an open-label, prospective study in 29 severe antihistamine-resistant CSU patients. The author reported no relationship between baseline disease severity assessed by the urticaria activity score (UAS) and clinical CsA responses (P = 0.906). These results are also supported by studies of Santiago et al.22 and Endo et al.23
3) Disease duration
Four studies (2 open-labelled, prospective studies; 2 retrospective studies) were identified. Asero13 reported that the baseline duration of urticaria in 29 CSU patients, receiving 4 mg/kg/day of CsA, was not associated with clinical responses to CsA (P = 0.252). This study has been supported by the studies of Santiago et al.22 and Endo et al.23 In contrast, Hollander et al.16 studied 68 patients with CSU receiving 1 mg/kg/day of CsA. The average duration of the current episodes of urticaria was 100 weeks. The mean duration of urticaria in the complete responders and partial/non-responders was 55 and 259 weeks, respectively (P = 0.030). They concluded that a shorter duration of urticaria was a predictive factor for favorable CsA responses.
Histamine-releasing activity factors (Supplementary Table S2, Table 2)
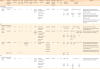
Table 2
Study characteristics of included articles: histamine-releasing activity factors
| Study (yr) | Treatment (marketed formulation of CsA) | Concomitant medication | Total case (No.) | Study case (No.) | CsA dosage (mg/kg/day) | Treatment duration (wk) | Severity assessment | Definition of response | Percentage of response (duration)* | Percentage of complete response (duration)† | Relapse (%) | Drop out (%) | Main outcome | Conclusion | |||||||
|---|---|---|---|---|---|---|---|---|---|---|---|---|---|---|---|---|---|---|---|---|---|
| Before CsA treatment | After CsA treatment | ||||||||||||||||||||
| ASST, No. (%) | Serum response | ASST, No. (%) | Serum response | ||||||||||||||||||
| (+) | (−) | (+) | (−) | ||||||||||||||||||
| ASST | |||||||||||||||||||||
| Randomized control trial | |||||||||||||||||||||
| Grattan et al. (2000)6 | CsA (Sanimmune) | Cetirizine 20 mg/day (all groups) | 20 | 13 | 4 | 4 | UAS‡ | -Reduction of UAS to < 25% of baseline | 40 (4 wk) | 26 (24 wk) (overall) | 75 (overall) | 5 | 13 (100) | 0 | 3.5 ± 1.8 mm | N/A | 2.1 mm (P = 0.04, wk 6) | Wheal diameter of ASST response after CsA treatment was significantly reduced (P < 0.05). | |||
| -Open trial: nonresponders | 7/20 | 4 | 8 | 57 (8 wk) | 14 | N/A | -CR: 3 | Positive ASST did not predict a good clinical response to CsA, as 10 patients with positive baseline ASSTs were non-responders. | |||||||||||||
| Placebo | 10 | 6 | N/A | 4 | 0 (4 wk) | 0 | 6 (100) | 0 | 4.3 ± 2.6 mm | -NR: 10 | |||||||||||
| -Open trial: placebo group | 10/10 | N/A | 4 | 70 (4 wk) | 0 | N/A | N/A | N/A | |||||||||||||
| Open-labelled prospective study | |||||||||||||||||||||
| Endo et al. (2019)23 | CsA (N/A) | N/A | 34 | 34 | 3 | 4 | UAS7Ω | -Good clinical response: UAS7 ≤ 6 at wk 4 | 38 (overall) | 38 (overall) | 0 | 0 | 13 (38.2) | 21 (61.8) | N/A | N/A | N/A | N/A | A significant difference in the UAS7 before and after CsA treatment was found in patients with positive ASST (P = 0.0048). | ||
| -mean UAS7 = 32 | -mean UAS7 = 34 | ||||||||||||||||||||
| Boubouka et al. (2011)15 | CsA (N/A) | N/A | 30 | 23 | 2.16 (wk 1–4) | 20 | 4-point severity score∥ | -Not defined (clinical score reductions > 30%) | 31 (4 wk) | 76.7 (20 wk) | 13 | 23.3 | 23/23 (100) | 0 | N/A | 2/23 (8.7) | 21/23 (91.3) | N/A | The ASST response 3–6 months after the end of CsA treatment was significantly suppressed. | ||
| 1.92 (wk 5–8) | 46 (8 wk) | -CR: 2 | -CR: 18 | ||||||||||||||||||
| 1.33 (wk 9–12) | 71 (12 wk) | -PR: 3 | |||||||||||||||||||
| 0.83 (wk 13–16) | 87 (16 wk) | ||||||||||||||||||||
| 0.55 (wk 17–20) | 88 (20 wk) | ||||||||||||||||||||
| Baskan et al. (2004)18 | CsA (N/A) | N/A | 10 | 10 | 4 | 4 | UAS‡ | -Reduction of UAS to < 25% of baseline | 50 (4 wk) | N/A | 20 | 0 | 10/10 (100) | 0 | 6.2 ± 2.3 mm | N/A | N/A | 1.4 ± 2.0 mm (wk 4) | No significant difference in baseline and post-treatment ASST response rate between 4-wk and 12-wk group (P > 0.05 and P = 0.067). | ||
| CsA (N/A) | 10 | 10 | 4 | 12 | 80 (12 wk) | N/A | 37.5 | 0 | 10/10 (100) | 0 | 6.3 ± 2.1 mm | N/A | N/A | 3.5 ± 2.8 mm (wk 12) | Wheal diameter of ASST response 2-wk after stopping CsA treatment was significantly lower than baseline (P = 0.02 in 4-wk group; P < 0.0001 in 12-wk group). | ||||||
| Di Gioacchino et al. (2003)19 | CsA (Neoral) | N/A | 40 | 40 | 5 (wk 1–8) | 16 | Relapse severity score¶ | -Not defined (complete absence of symptoms) | 82.5 (1 wk) | 100 (3 wk) | 60 | 0 | 40/40 (100) | 0 | Mean ASST score** | 27/40 (67.5) | 13/40 (32.5) | Mean ASST score** | After CsA treatment, ASST score significantly reduced compared to baseline (P = 0.002). | ||
| 4 (wk 9–16) | 100 (3 wk) | 3.0 | -CR: 3 | -CR: 13 | 0.3 | All patients with relapses continued to have positive ASST but with a significant reduction in the score (P < 0.002). | |||||||||||||||
| 100 (16 wk) | -PR: 24 | ||||||||||||||||||||
| Toubi et al. (1997)21 | CsA (Sanimmune) | N/A | 25 | 19 | 3 (wk 1–6) | 12 | Breneman†† severity score | -0: full remission | 76 (1 wk) | 52 (12 wk) | 15.4 | 24 | 8/19 (42.1) | 11/19 (57.9) | N/A | 3/19 (15.8) | 16/19 (84.2) | N/A | The number of positive ASST patients after CsA treatment was not significantly lower than baseline. | ||
| 2 (wk 7–9) | -1: moderate response | 76 (4 wk) | 84.6 (24 wk) | -CR: 2 | -CR: 10 | ||||||||||||||||
| 1 (wk 10–12) | -2: mild response | 76 (12 wk) | -PR: 1 | -PR: 6 | |||||||||||||||||
| Untreated group | - | 10 | 10 | - | - | -3: no response | - | - | - | - | 4/10 (40) | 6/10 (60) | 4/10 (40) | 6/10 (60) | |||||||
| -NR: 4 | -NR: 6 | ||||||||||||||||||||
| Healthy group | - | 20 | 20 | - | - | - | - | - | - | 0 | 20/20 (100) | - | - | ||||||||
| Retrospective study | |||||||||||||||||||||
| Hollander et al. (2011)16 | CsA (N/A) | N/A | 68 | 58 | 1 (increased 25–50 mg every 2–4 wk after remission, kept stable for 6 months, then weaned off) | 20.8 (median) | N/A | -Complete remission ≤ 1 day of having urticarial lesion per month | 94.1 (overall) | 78 (overall) | 13.2 | 29.4 | ASST, No. (%) | Serum response | ASST, No. (%) | Serum response | ASST was not predictive of response to CsA treatment (P = 0.34). | ||||
| (+) | (−) | (+) | (−) | ||||||||||||||||||
| 55/58 (94.8) | 3/58 (5.2) | N/A | N/A | N/A | N/A | ||||||||||||||||
| Blood basophil | |||||||||||||||||||||
| Open-label prospective study | |||||||||||||||||||||
| Endo et al. (2019)23 | CsA (N/A) | N/A | 34 | 34 | 3 | 4 | UAS7Ω | -Good clinical response: UAS7 ≤ 6 at wk 4 | 38 (overall) | 38 (overall) | 0 | 0 | Mean blood basophil ± SD (per mm3) | There was no significant association between blood basophil level and clinical response to CsA (P = 0.385). | |||||||
| 33.1 ± 26.4 | N/A | ||||||||||||||||||||
| BHRA | |||||||||||||||||||||
| Randomized control trial | |||||||||||||||||||||
| Grattan et al. (2000)6 | CsA (Sanimmune) | Cetirizine 20 mg/day (all groups) | 20 | 11 (paired pre-, post-treatment) | 4 | 4 | UAS‡ | -Reduction of UAS to < 25% of baseline | 40 (4 wk) | 26 (24 wk) (overall) | 75 (overall) | 5 | Mean BHRA (%) | UAS | Mean BHRA (%) | UAS | No significant difference in baseline BHRA between CsA treatment and placebo groups (P > 0.05). | ||||
| 36 | 23.6 | 5 | 1.2 | Mean percentage of BHRA significantly decreased from baseline (P < 0.0001). | |||||||||||||||||
| -Open trial: nonresponders | 7/20 | 4 | 8 | 57 (8 wk) | 14 | N/A | N/A | N/A | UAS and BHRA corresponded quite closely during relapse and sustained remission. | ||||||||||||
| Placebo | 10 | N/A | 4 | 0 (4 wk) | 0 | N/A | - | - | |||||||||||||
| -Open trial: placebo group | 10/10 | N/A | 4 | 70 (4 wk) | 0 | N/A | N/A | N/A | |||||||||||||
| Retrospective study | |||||||||||||||||||||
| Iqbal et al. (2012)14 | CsA (N/A) | Ahs | 58 | 58 | 4 | 12–16 | Clinical response assessed by clinician‡‡ | N/A | 48.3 (days - above 3 months) | 70.7 (days - above 3 months) | N/A | N/A | BHRA, No. (%) | BHRA, No. (%) | CSU patients with a positive BHRA were more likely to respond clinically than those of negative BHRA (P < 0.001). | ||||||
| (+) | (−) | (+) | (−) | ||||||||||||||||||
| 27/58 (46.6) | 31/58 (53.4) | N/A | N/A | ||||||||||||||||||
| -CR: 22 (81%) | -CR: 6 (19%) | ||||||||||||||||||||
| -PR: 3 (11%) | -PR: 10 (32%) | ||||||||||||||||||||
| -NR: 2 (8%) | -NR: 15 (49%) | ||||||||||||||||||||
| Hollander et al. (2011)16 | CsA (N/A) | N/A | 68 | 24 | 1 (increased 25–50 mg every 2–4 wk after remission, kept stable for 6 months, then weaned off) | 20.8 (median) | N/A | -Complete remission ≤ 1 day of having urticarial lesion per month | 94.1 (overall) | 78 (overall) | 13.2 | 29.4 | CU Index§ (%) | CU Index§ (%) | Positive CU Index predicted a successful response to CsA treatment (P = 0.05). | ||||||
| (+) | (−) | (+) | (−) | ||||||||||||||||||
| N/A | N/A | N/A | N/A | ||||||||||||||||||
| -CR: 93% | -CR: 60% | ||||||||||||||||||||
CsA, cyclosporine A; ASST, autologous serum skin test; N/A, data was not available in the study; UAS, urticaria activity score; CR, complete response; NR, no response; PR, partial response; SD, standard deviation; BHRA, basophil histamine release assay; CSU, chronic spontaneous urticaria; CU, chronic urticaria.
*Response, improvement of clinical score at 30%–90%; †Complete response, improvement of clinical score at > 90%; ‡Urticaria Activity Score, total score of 2 categories: 1) Intensity of pruritus (0 = none, 1 = mild, 2 = moderate, 3 = intense), 2) Number of wheals (0 = < 10 small wheals, 1 = 10–50 small wheals or 10 large wheals, 2 = >50 small wheals or 10–50 large wheals, 3 = almost covered); §CU Index, Chronic Urticaria Index is a nonspecific, histamine release assay in which donor blood cells are mixed with the patient's serum as well as positive and negative control serum; ∥4-point severity score: pruritus severity (0–3), number of wheals (0–3), diameter of the largest wheal (0–3) and average pruritus duration (0–3); ¶Relapse severity score: 0 = constant remission of symptoms; 1 = occurrence of relapses resolved spontaneously within 24 hours; 2 = occurrence of relapses resolved by H1-antihistamine; 3 = occurrence of relapses resolved by steroids; **ASST score: wheal equal to saline control (0), wheal ≥ 1.5 mm than a saline control (+), wheal equal to histamine reaction (++), wheal greater than histamine reaction (+++), wheal with pseudopods (++++); ††Breneman severity score: number of lesions (0–3), number of separate episodes (0.3), average size of lesions (0–3), average duration of lesions (03) and pruritus intensity (0–3);‡‡The global response to cyclosporine was designed as complete, partial or none. The time to onset of a complete or partial response was categorised as immediate (within days), early (within a month), late (from 1–3 months) and delayed (> 3 months). The amount of histamine released from each of these assays is measured, and an index is reported, with a normal result being less than 10. A positive CU Index is the correlate of an anti-FcεRI antibody. Ω Sum of 7 days of daily UAS (range from 0–42) daily UAS total score of 2 categories: 1) intensity of pruritus (0 = none, 1 = mild, 2 = moderate, 3 = intense), 2) number of wheals (0 = none, 1 = 1–20 wheals, 2 = 20–50 wheals, 3 = more than 50 wheals).
![]()
1) ASST
Seven studies investigated the relationship between ASSTs and clinical responses to CsA (1 RCT; 5 open-labelled, prospective studies; and 1 retrospective study).6151618192123 Three studies showed a significant association between positive ASSTs and CsA responses.181923 In contrast, 4 other studies showed no significant association.6151621 The wheal diameter of the ASST response after CsA treatment was significantly reduced as reported by 3 studies.61819 Three studies also reported that the number of positive ASST patients decreased after CsA treatment.1519
Grattan et al.6 studied 19 CSU patients (13 received CsA; 6 received a placebo). ASSTs were performed with stored baseline serum on the last day of CsA administration (weeks 4 or 8 for an open-labelled study) and 2 weeks after stopping CsA. All patients had positive baseline ASSTs with no significant differences in baseline wheal diameters between the CsA-treated and placebo groups (P > 0.050). The ASST wheal diameter, 2 weeks after stopping the CsA treatment was significantly reduced (4.8 vs. 2.1 mm, P = 0.040, n = 13). Positive baseline ASST responses did not predict good clinical responses to CsA, as 10 patients with positive baseline ASSTs did not respond to treatment.
Endo et al.23 studied 34 CSU patients, whose symptoms could not be controlled with up to 2-fold of recommended dosage of second-generation AHs, receiving 3 mg/kg/day of CsA for 4 weeks. ASST result was positive in 21 patients and negative in 13 patients. A significant improvement of UAS7 was found in patients of ASST-positive group more than in those of the ASST-negative group (P = 0.0048). Therefore, the positive ASST results were suggested as useful markers for predicting the response to CsA treatment in CSU patients.
Boubouka et al.15 studied 23 positive ASST CSU patients, receiving 0.55–2.16 mg/kg/day of CsA. After discontinuing the CsA for 3-6 months, the ASST responses were significantly suppressed. Eighteen of 23 CSU patients had negative ASST results, and clinical symptoms were absent (78.3%). Two patients had a positive ASST, but were complete responders (8.7%), while for 3 patients—despite having negative ASSTs—clinical symptoms were present (13%). Consequently, ASSTs could not be considered 100% reliable for predicting treatment responses.
Baskan et al.18 studied 20 CSU patients with positive ASSTs and recalcitrant to antihistamines. The patients were randomized to receive 4 mg/kg/day of CsA for 4 or 12 weeks. The mean wheal diameter of the ASST responses was significantly smaller 2 weeks after discontinuing the CsA than at baseline (1.4 ± 2.0 vs. 6.2 ± 2.3, P = 0.020 for the 4-week group; 3.5 ± 2.8 vs. 6.3 ± 2.1, P < 0.0001 for the 12-week group). The authors concluded that CsA provided clinical improvement for CSU patients with positive ASSTs.
Di Gioacchino et al.19 studied 40 patients with severe CSU and positive ASSTs, receiving 4–5 mg/kg/day of CsA for 16 weeks. The ASSTs were performed before CsA treatment, at the end of treatment, and at least once during relapses of the disease. The ASST results were scored from 0 to 4+. The mean ASST score was 3 (range: 2–4) at baseline. Of the 16 patients with complete remission of the disease at the end of treatment, the ASST was negative for 13 patients but positive for 3. All patients with relapses continued to have positive ASSTs but with a significant reduction of their ASST scores (P < 0.002). The reduction of the ASST scores after CsA was statistically significant for all patients (3.0 vs. 0.3, P = 0.002).
Toubi et al.21 studied 19 patients receiving 1–3 mg/kg/day of CsA. The baseline ASSTs were positive for 8/19 patients (42.1%), 5 of which became negative at the end of treatment (3 complete responders and 2 partial responders). Of the remaining 3 positive ASSTs, 2 patients had complete responses, while 1 patient had a partial response. There was no significant correlation between the ASST results and their effectiveness in predicting favorable CsA responses.
Hollander et al.16 studied the ASST scores of 55 CSU patients. The authors concluded that ASSTs were not predictive of a complete response to CsA treatment (P = 0.340).
2) Basophil histamine release assay (BHRA)
Three studies (1 RCT and 2 retrospective review studies) were included.61416 All showed that CSU patients with positive baseline BHRA results responded better to CsA than those with negative baseline BHRA results. One study reported the suppression of the BHRA response was significantly increased after CsA.6
Grattan et al.6 analyzed the available, paired, pre-/post-treatment sera in 11 out of 14 CSU patients with positive BHRAs. There was a significant reduction in the mean percentage of BHRA from 36% to 5% (P < 0.0001). All 11 included patients were clinical responders to the CsA treatment; their mean UAS reduced from 23.6 to 1.2. A correlation between the clinical responses and serum BHRAs was reported in 4 patients who responded to CsA and had been followed for 16 weeks. After CsA treatment, serum BHRA significantly reduced, corresponding to UAS.
Iqbal et al.14 studied 58 severe CSU patients receiving 4 mg/kg/day of CsA. The baseline BHRA was positive in 27 and negative in 31 patients. Eighty-one percent of the BHRA-positive patients had complete CsA responses, whereas only 19% of the BHRA-negative patients did (P < 0.001). The authors concluded that BRHA was useful for predicting complete responses to CsA treatment in antihistamine-unresponsive CSU patients (P < 0.001).
Hollander et al.16 studied the CU Index (a non-specific histamine release assay) in 24 CSU patients receiving 1 mg/kg/day of CsA. Ninety-three percent of the patients with a positive CU Index (defined as 10 or more) achieved complete remissions. A positive CU Index was therefore found to predict favorable CsA responses (P = 0.050).
Coagulation and inflammatory factors (Supplementary Table S2, Table 3)
Table 3
Study characteristics of included articles: coagulation and inflammatory factors
| Study (yr) | Treatment (marketed formulation of CsA) | Concomitant medication | Total case (No.) | Study case (No.) | CsA dosage (mg/kg/day) | Treatment duration (wk) | Severity assessment | Definition of response | Percentage of response (duration)* | Percentage of complete response (duration)† | Relapse (%) | Drop out (%) | Outcome | Conclusion | |||||||
|---|---|---|---|---|---|---|---|---|---|---|---|---|---|---|---|---|---|---|---|---|---|
| Before CsA treatment | After CsA treatment | ||||||||||||||||||||
| Plasma D-dimer | |||||||||||||||||||||
| Open labelled, prospective study | |||||||||||||||||||||
| Asero (2015)13 | CsA (N/A) | N/A | 29 | 11 | 4 | 12 | 5-point response score‡ | -Remission: complete absence of symptoms | 86 (12 wk) | 59 (12 wk) | 24 | N/A | Plasma D-dimer, No. (%) | Plasma D-dimer, No. (%) | Baseline plasma D-dimer levels showed a highly significant negative correlation with CsA response (P < 0.017). | ||||||
| -Good: 50%–80% improvement | ↔ | ↑ | ↔ | ↑ | Plasma D-dimer levels during or after treatment appeared to follow the favorable response to CsA treatment in most of the followed-up cases. | ||||||||||||||||
| -Partial: some benefit | 1/11 (9.1) | 10/11 (90.9) | 6/11 (54.5) | 5/11 (45.5) | Plasma D-dimer may also be useful to monitor the clinical response to CsA treatment in severe CSU. | ||||||||||||||||
| -CR: 2 | -CR: 2 | ||||||||||||||||||||
| -PR: 4 | -PR: 3 | ||||||||||||||||||||
| CRP | |||||||||||||||||||||
| Open label prospective study | |||||||||||||||||||||
| Santiago et al. (2019)22 | CsA (N/A) | N/A | 34 | 34 | 3 | 12 | UAS7§ | -Good clinical response: UAS7 ≤ 6 at wk 12 | 53 (overall) | 53 (overall) | 0 | 0 | CRP (mean, mg/dL) | CRP (mean, mg/dL) | CRP was elevated in 71% of patients. | ||||||
| 1.24 ± 0.88 | N/A | N/A | No association was found between response to CsA and CRP levels. | ||||||||||||||||||
| Asero (2015)13 | CsA (N/A) | N/A | 29 | 27 | 4 | 12 | 5-point response score ‡ | -Remission: complete absence of symptoms | 86 (12 wk) | 59 (12 wk) | 24 | N/A | CRP, No. (%) | CRP, No. (%) | Mean duration of treatment (mon) | Elevated CRP levels were not associated with the clinical response to CsA treatment. | |||||
| -Good: 50%–80% improvement | ↔ | ↑ | ↔ | ↑ | ↔ | ↑ | |||||||||||||||
| -Partial: some benefit | 22/27 (81.5) | 5/27 (18.5) | N/A | N/A | N/A | ||||||||||||||||
| -CR: 14 | -CR: 3 | ||||||||||||||||||||
| -PR: 5 | -PR: 2 | ||||||||||||||||||||
| -NR: 3 | |||||||||||||||||||||
| Ohtsuka (2010)17 | CsA (Neoral) | N/A | 15 | 15 | 3 (wk 1–12) tapered (wk 13–16) | 16 | N/A | -CR: all symptoms resolved | 20 (4 wk) | N/A | N/A | 0 | 6/15 (40) | 9/15 (60) | 11/15 (73.3) | 4/15 (26.7) | 22.7 ± 1.7 | 8.7 ± 1.3 | All nine patients with elevated CRP showed decreased CRP level after CsA treatment. | ||
| 26.6 (8 wk) | CSU patients with elevated CRP levels had shorter duration of CsA treatment than those of normal CRP levels. | ||||||||||||||||||||
| 60 (12 wk) | An elevated CRP levels could be predictive an early response to oral CsA therapy (P < 0.05). | ||||||||||||||||||||
| 73.3 (16 wk) | |||||||||||||||||||||
| 86.7 (20 wk) | |||||||||||||||||||||
| 100 (24 wk) | |||||||||||||||||||||
| Healthy control | 147 | 147 | - | - | - | - | - | - | - | 140/147 (95.2) | 7/147 (4.8) | - | - | - | - | ||||||
| ESR | |||||||||||||||||||||
| Open label prospective study | |||||||||||||||||||||
| Asero (2015)13 | CsA (N/A) | N/A | 29 | 28 | 4 | 12 | 5-point response score‡ | -Remission: complete absence of symptoms | 86 (12 wk) | 59 (12 wk) | 24 | N/A | ESR, No. (%) | ESR, No. (%) | Elevated ESR levels were not associated with the clinical response to CsA treatment. | ||||||
| -Good: 50%–80% improvement | ↔ | ↑ | ↔ | ↑ | |||||||||||||||||
| -Partial: some benefit | 26/28 (92.9) | 2/28 (7.1) | N/A | N/A | |||||||||||||||||
| -CR: 16 | -CR: 1 | ||||||||||||||||||||
| -PR: 7 | -PR: 1 | ||||||||||||||||||||
| -NR: 3 | |||||||||||||||||||||
CsA, cyclosporine A; N/A, data was not available in the study; CR, complete response; PR, partial response; NR, no response; CSU, chronic spontaneous urticaria; CRP, C-reactive protein; UAS, urticaria activity score; ESR, erythrocyte sedimentation rate.
*Response, improvement of clinical score at 30%–90%; †Complete response, improvement of clinical score at > 90%; ‡5-point response score: 0 = no response, 1 = partial response, 2 = good response, 3 = excellent and 4 = remission. §Sum of 7 days of daily UAS (range from 0–42) daily UAS total score of 2 categories: 1) intensity of pruritus (0 = none, 1 = mild, 2 = moderate, 3 = intense), 2) number of wheals (0 = none, 1 = 1–20 wheals, 2 = 20–50 wheals, 3 = more than 50 wheals).
![]()
1) D-dimer
Asero13 performed an open-labelled, prospective study of 29 severe CSU patients receiving CsA. The baseline plasma D-dimer levels were elevated in 18 of the 29 patients (62%; data not shown in the table). Seventeen of 29 patients (7 with elevated plasma D-dimer levels; 10 with normal plasma D-dimer levels) were complete responders. Eight patients with elevated plasma D-dimer levels were partial responders. Four patients (3 with elevated plasma D-dimer levels; 1 with normal plasma D-dimer levels) were non-responders.
The baseline plasma D-dimer levels showed a statistically significant negative correlation with the CsA response (P < 0.017). Plasma D-dimer levels during or after the CsA were available in 11 patients. The elevated baseline plasma D-dimer levels reverted to normal levels in half of the patients (10/11; 90.9% to 6/11; 54.5%) along with the clinical response. The authors concluded that plasma D-dimer is useful for monitoring clinical responses to CsA treatment in most patients with severe disease.
2) C-reactive protein (CRP)
Three studies (2 open-labelled, prospective, control studies and 1 open-labelled, prospective study without controls) were identified.13, 17, 22 Recently, Santiago et al.22 studied 34 CSU patient receiving 3 mg/kg/day of CsA for 12 weeks. The CRP levels were elevated in 71% of patients, but no association with response to CsA treatment. Asero13 studied 29 severe CSU patients receiving 4 mg/kg/day of CsA. Baseline serum CRP levels were elevated in 5 of 27 patients (18.5%); of these 5 patients 3 were complete responders. The elevated baseline serum CRP levels showed no significant association with the clinical responses to CsA.
In contrast, Ohtsuka17 studied 15 CSU patients unresponsive to antihistamines, receiving 3 mg/kg/day of CsA and tapering off after 3 months. Baseline high sensitivity-serum CRP levels were elevated in 9 patients and the levels decreased after CsA treatment in all patients. The treatment duration was significantly shorter in the elevated high sensitivity-CRP patients than in the normal serum CRP level patients (P < 0.050). The author concluded that CSU patients with elevated serum CRP showed good responses to CsA.
3) Erythrocyte sedimentation rate (ESR)
Asero13 performed an open-labelled, prospective study of 28 patients with severe, antihistamine-resistant CSU receiving 4 mg/kg/day of CsA. The ESR levels were elevated in 2 of 28 patients (1 complete responder; 1 partial responder), while those of 26 were normal (16 complete responders; 7 partial responders; and 3 non-responders). The study suggested no significant association between elevated ESR levels and the response to CsA.
Autoantibodies (Supplementary Table S2, Table 4)
Table 4
Study characteristics of included articles: autoantibodies
| Study (yr) | Treatment (marketed formulation of CsA) | Concomitant medication | Total case (No.) | Study case (No.) | CsA dosage (mg/kg/day) | Treatment duration (wk) | Severity assessment | Definition of response | Percentage of response (duration)* | Percentage of complete response (duration)† | Relapse (%) | Drop out (%) | Outcome | Conclusion | |||||
|---|---|---|---|---|---|---|---|---|---|---|---|---|---|---|---|---|---|---|---|
| Before CsA treatment | After CsA treatment | ||||||||||||||||||
| ANA‡ | |||||||||||||||||||
| Retrospective study | |||||||||||||||||||
| Santiago et al. (2019)22 | CsA (N/A) | N/A | 34 | 34 | 3 | 12 | UAS7§ | -Good clinical response: UAS7 ≤ 6 at wk 12 | 53 (overall) | 53 (overall) | 0 | 0 | ANA (%) | ANA (%) | No association was found between response to CsA and ANA result. | ||||
| (+) | (−) | (+) | (−) | ||||||||||||||||
| 62 | 38 | N/A | N/A | ||||||||||||||||
| Hollander et al. (2011)16 | CsA (N/A) | N/A | 68 | 27 | 1 (increased 25–50 mg every 2–4 wk after remission, kept stable for 6 months, then weaned off) | 20.8 (median) | N/A | -Complete remission ≤ 1 day of having urticarial lesion per month | 94.1 (overall) | 78 (overall) | 13.2 | 29.4 | ANA, No. (%) | ANA, No. (%) | ANA positivity was not significantly associated with CsA response (P = 0.1). | ||||
| (+) | (−) | (+) | (−) | ||||||||||||||||
| 6/27 (22.2) | 21/27 (77.8) | N/A | N/A | ||||||||||||||||
| -CR: 6 | -CR: 14 | ||||||||||||||||||
| -NR: 7 | |||||||||||||||||||
| TAs | |||||||||||||||||||
| Open label prospective study | |||||||||||||||||||
| Asero (2015)13 | CsA (N/A) | N/A | 29 | 28 | 4 | 12 | 5-point response score∥ | -Remission: complete absence of symptoms | 86 (12 wk) | 59 (12 wk) | 24 | N/A | TA, No. (%) | TA, No. (%) | TAs were not associated with the clinical response to CsA treatment. | ||||
| -Good: 50%–80% improvement | (+) | (−) | (+) | (−) | |||||||||||||||
| -Partial: some benefit | 11/28 (39.3) | 17/28 (60.7) | N/A | N/A | |||||||||||||||
| -CR: 5 | -CR: 12 | ||||||||||||||||||
| -PR: 3 | -PR: 4 | ||||||||||||||||||
| -NR: 3 | -NR: 1 | ||||||||||||||||||
| Retrospective study | |||||||||||||||||||
| Santiago et al. (2019)22 | CsA (N/A) | N/A | 34 | 34 | 3 | 12 | UAS7§ | -Good clinical response: UAS7 ≤ 6 at wk 12 | 53 (overall) | 53 (overall) | 0 | 0 | TA (%) | TA (%) | No association was found between response to CsA and TA result. | ||||
| (+) | (−) | (+) | (−) | ||||||||||||||||
| 18 | 82 | N/A | N/A | ||||||||||||||||
| Hollander et al. (2011)16 | CsA (N/A) | N/A | 68 | 33 | 1 (increased 25–50 mg every 2–4 wk after remission, kept stable for 6 months, then weaned off) | 20.8 (median) | N/A | -Complete remission ≤ 1 day of having urticarial lesion per month | 94.1 (overall) | 78 (overall) | 13.2 | 29.4 | N/A | N/A | N/A | N/A | TAs did not predict complete response of CsA treatment (P = 0.92). | ||
| Ig AAbs | |||||||||||||||||||
| Open label prospective study | |||||||||||||||||||
| Endo et al. (2018)23 | CsA (N/A) | N/A | 34 | 34 | 3 | 4 | UAS7§ | -Good clinical response: UAS7 ≤ 6 at wk 4 | 38 (overall) | 38 (overall) | 0 | 0 | Anti-FcεRIα AAbs (mean ± SD, ug/mL) | Anti-FcεRIα AAbs (mean ± SD, ug/mL) | There was no significant association between AAbs to FcεRIα and clinical response to CsA (P = 0.506). | ||||
| 1.83 ± 1.95 | N/A | ||||||||||||||||||
| Anti-IgE AAbs (mean ± SD, ug/mL) | Anti-IgE AAbs (mean ± SD, ug/mL) | There was no significant association between AAbs to IgE and clinical response to CsA (P = 0.986). | |||||||||||||||||
| 1.22 ± 1.35 | N/A | ||||||||||||||||||
CsA, cyclosporine A; ANA, antinuclear antibodies; N/A, data was not available in the study; UAS, urticaria activity score; CR, complete response; NR, no response; TA, thyroid Autoantibody; PR, partial response; Ig AAb, Ig Autoantibody; FcεRIα, FcεRIα-chain.
*Response, improvement of clinical score of 30%–90%; †Complete response, improvement of clinical score of > 90%; ‡A positive ANA titer ≥ 1:80; §Sum of 7 days of daily UAS (range from 0–42) daily UAS total score of 2 categories: 1) intensity of pruritus (0 = none, 1 = mild, 2 = moderate, 3 = intense), 2) number of wheals (0 = none, 1 = 1–20 wheals, 2 = 20–50 wheals, 3 = more than 50 wheals); ∥5-point response score: 0 = no response, 1 = partial response, 2 = good response, 3 = excellent and 4 = remission.
![]()
1) Antinuclear antibodies (ANAs)
Two retrospective studies 1622 examined the association between ANA and response to CsA treatment. Santiago et al.22 reported that 62% of CSU patients had positive ANA but there was no association with CsA response. Hollander et al.16 reported that 6 out of 27 CSU patients had positive ANAs (at a titer of ≥1:80). All positive ANA patients achieved complete remission with CsA treatment. The remaining 21 patients had negative ANA results (14 complete remission; 7 failed treatment). There were no significant differences between the ANA results before and after CsA treatment (P = 0.100). The study showed there is no significant association between positive ANAs and CsA responses.
2) Thyroid autoantibodies (TAs)
Three studies (1 open-labelled, prospective study without controls; 2 retrospective studies) reported on the association between the levels of TAs and CsA responses.131622 All studies showed no significant association between the levels of TAs and CsA responses.
Asero13 studied 11 CSU patients with positive TAs who received 4 mg/kg/day of CsA. Five patients (39%) had complete responses, 3 each had partial responses, and non-responses consecutively. Similarly, Hollander et al.16 and Santiago et al.22 reported that the presence of TAs was not a predictive factor for CsA response in CSU patients, receiving 1 and 3 mg/kg/day of CsA, respectively (P = 0.920).
3) Other autoantibodies
Endo et al.
23 studied the association between the concentrations of anti-FcεRIα, anti-IgE autoantibodies and clinical response after CsA, in 34 CSU patients receiving 3 mg/kg/day of CsA for 4 weeks. There was no significant association between these factors and CsA response (P = 0.506, P = 0.986, respectively).
Cytokines and immunoglobulins (Supplementary Table S2, Table 5)
Table 5
Study characteristics of included articles: cytokines
| Study (yr) | Treatment (marketed formulation of CsA) | Concomitant medication | Total case (No.) | Study case (No.) | CsA dosage (mg/kg/day) | Treatment duration (wk) | Severity assessment | Definition of response | Percent of response (duration)* | Percent of complete response (duration)† | Relapse (%) | Drop out (%) | Outcome | Conclusion | |||||||||||||
|---|---|---|---|---|---|---|---|---|---|---|---|---|---|---|---|---|---|---|---|---|---|---|---|---|---|---|---|
| Before CsA treatment | After CsA treatment | ||||||||||||||||||||||||||
| Serum T cells, NK cells, B cells, activated B cells, Igs, C3, C4, CICs | |||||||||||||||||||||||||||
| Open labelled prospective study | |||||||||||||||||||||||||||
| Loria et al. (2001)20 | CsA (N/A) | N/A | 10 | 10 | 5 | 8 | Total symptom severity score‡ | -Not defined (clinical score = 0 in all patients) | 100 (2 wk) | 100 (8 wk) | 20 | 0 | Serum T cells | The distribution of serum T cells before and after treatment was normal in all patients. | |||||||||||||
| 100 (8 wk) | Mean CD3 expression (cells/µL) | Mean CD4 expression (cells/µL) | Mean CD8 expression (cells/µL) | Mean CD3 expression (cells/µL) | Mean CD4 expression (cells/µL) | Mean CD8 expression (cells/µL) | CD3, CD4 and CD8 were not modified after CsA treatment. | ||||||||||||||||||||
| 1,363 | 787 | 578 | 1,358 | 756 | 576 | ||||||||||||||||||||||
| Prednisolone 20 mg/kg/day | 10 | 10 | N/A | 100 (8 wk) | 40 | 0 | 1,621 | 888 | 679 | 1,564 | 822 | 706 | |||||||||||||||
| CsA (N/A) | 10 | 10 | 5 | Serum NK cells | The distribution of serum NK cells before treatment was normal in all patients. | ||||||||||||||||||||||
| Mean CD57 expression (cells/µL) | Mean CD56 expression (cells/µL) | Mean CD57 expression (cells/µL) | Mean CD56 expression (cells/µL) | CD57 and CD56 expression were not significantly modified after treatment with CsA. | |||||||||||||||||||||||
| 373 | 311 | 440 | 343 | ||||||||||||||||||||||||
| Prednisolone 20 mg/kg/day | 10 | 10 | N/A | 403 | 411 | 398 | 428 | ||||||||||||||||||||
| CsA (N/A) | 10 | 10 | 5 | Serum B cells | CD19 expression on serum B lymphocytes were not significantly modified after treatment with CsA. | ||||||||||||||||||||||
| Mean CD19 expression (cells/µL) | Mean CD19 expression (cells/µL) | ||||||||||||||||||||||||||
| 196 | 200 | ||||||||||||||||||||||||||
| Prednisolone 20 mg/kg/day | 10 | 10 | N/A | 268 | 256 | ||||||||||||||||||||||
| CsA (N/A) | 10 | 10 | 5 | Serum activated B cell subsets | All patients showed a high percentage of serum activated B cells (CD19+CD23+). | ||||||||||||||||||||||
| Mean CD19+CD5+ expression (%) | Mean CD19+CD23+ expression (%) | Mean CD19+CD5+ expression (%) | Mean CD19+CD23+ expression (%) | CD19+CD5+ expression on B lymphocytes were not significantly modified after treatment with CsA. | |||||||||||||||||||||||
| 33 | 59 | 28 | 62 | ||||||||||||||||||||||||
| Prednisolone 20 mg/kg/day | 10 | 10 | N/A | 23 | 58 | 24 | 54 | ||||||||||||||||||||
| CsA (N/A) | 10 | 10 | 5 | Serum Igs, C3, C4, CICs | Serum Igs, C3 and C4 values were normal before and after treatment either with CsA or with prednisolone. | ||||||||||||||||||||||
| Serum Igs | C3, C4 complement | CICs | Serum Igs | C3, C4 complement | CICs | CICs were negative before and after treatment either with CsA or with prednisolone. | |||||||||||||||||||||
| ↔ | ↑ | ↔ | ↑ | (−) | (+) | ↔ | ↑ | ↔ | ↑ | (−) | (+) | ||||||||||||||||
| 10 | 0 | 10 | 0 | 10 | 0 | 10 | 0 | 10 | 0 | 10 | 0 | ||||||||||||||||
| Prednisolone 20 mg/kg/day | 10 | 10 | N/A | 10 | 0 | 10 | 0 | 10 | 0 | 10 | 0 | 10 | 0 | 10 | 0 | ||||||||||||
| Serum IgE | |||||||||||||||||||||||||||
| Open label prospective study | |||||||||||||||||||||||||||
| Endo et al. (2018)23 | CsA (N/A) | N/A | 34 | 34 | 3 | 4 | UAS7§ | -Good clinical response: UAS7 ≤ 6 at wk 4 | 38 (overall) | 38 (overall) | 0 | 0 | Total serum IgE (mean ± SD, IU/mL) | There was significant association between total serum IgE and clinical response to CsA (P = 0.0003). | |||||||||||||
| 258 ± 384 | N/A | ||||||||||||||||||||||||||
| UAS7 ≤ 6: (n = 13, 38.2%) | |||||||||||||||||||||||||||
| UAS > 6: (n = 21, 61.8%) | |||||||||||||||||||||||||||
| Retrospective study | |||||||||||||||||||||||||||
| Santiago et al. (2019)22 | CsA (N/A) | N/A | 34 | 34 | 3 | 12 | UAS7§ | -Good clinical response: UAS7 ≤ 6 at wk 12 | 53 (overall) | 53 (overall) | 0 | 0 | Total serum IgE | Mean serum baseline IgE levels were significantly lower in CsA responders (P = 0.001). Serum baseline IgE levels showed a moderately significant negative correlation with clinical response to CsA treatment (decrease in UAS7 at wk 12) (P = 0.002). | |||||||||||||
| Serum IgE (mean, IU/mL) | UAS7 (median, range) | Serum IgE (mean, IU/mL) | UAS7 (median) | ||||||||||||||||||||||||
| -CR: 43.0 | 30 (27.25–35) | -CR: N/A | 4.5 (0–20) | ||||||||||||||||||||||||
| -NR: 148.5 | -NR: N/A | ||||||||||||||||||||||||||
| Serum IL-2, IL-5, TNF-α | |||||||||||||||||||||||||||
| Open label prospective study | |||||||||||||||||||||||||||
| Serhat Inaloz et al. (2008)7 | CsA (Neoral) | N/A | 27 | 27 | 2.5 | 4 | UAS7§ | -Reduction of UAS to < 25% of baseline | 100 (4 wk) | 70.4 (4 wk) | N/A | 0 | Serum IL-2 | Increase in clinical efficacy and significantly decrease in serum IL-2 suggest that inhibition of serum IL-2 generation is involved in the action of CsA in this clinical setting. | |||||||||||||
| Serum IL-2 (U/mL) | Mean UAS7 | Serum IL-2 (U/mL) | Mean UAS7 | ||||||||||||||||||||||||
| 652.66 ± 213 (P = 0.001) | 32.07 ± 7.1 | 522.48 ± 172.8 (lower than baseline, P < 0.0001; control, P = 0.274) | 6.22 ± 3.8 | ||||||||||||||||||||||||
| Healthy control | 24 | 24 | N/A | - | - | - | - | - | - | - | 477.12 ± 166.9 | - | - | - | |||||||||||||
| CsA (Neoral) | 27 | 27 | 2.5 | 4 | Serum IL-5 | Increase in clinical efficacy and significantly decrease in serum IL-5 suggest that inhibition of serum IL-5 generation is involved in the action of CsA in this clinical setting. | |||||||||||||||||||||
| Serum IL-5 (pg/mL) | UAS7 (mean) | Serum IL-5 (pg/mL) | UAS7 (mean) | ||||||||||||||||||||||||
| 244 ± 67.2 (P = 0.001) | 32.07 ± 7.1 | 114 ± 36.6 (lower than baseline, P = 0.001; control, P = 0.284) | 6.22 ± 3.8 | ||||||||||||||||||||||||
| Healthy control | 24 | 24 | N/A | - | 98.15 ± 32.2 | - | - | - | |||||||||||||||||||
| CsA (Neoral) | 27 | 27 | 2.5 | 4 | Serum TNF-α | Increase in clinical efficacy and significantly decrease in serum TNF-α levels suggest that inhibition of serum TNF-α generation is involved in the action of CsA in this clinical setting. | |||||||||||||||||||||
| Serum TNF-α (pg/mL) | UAS7 (mean) | Serum TNF-α (pg/mL) | UAS7 (mean) | ||||||||||||||||||||||||
| 14.26 ± 4.2 (P < 0.0001) | 32.07 ± 7.1 | 7.81 ± 3.7 (lower than baseline, P = 0.0001; control, P = 0.139) | 6.22 ± 3.8 | ||||||||||||||||||||||||
| Healthy control | 24 | 24 | N/A | - | 8.08 ± 2.4 | - | - | - | |||||||||||||||||||
CsA, cyclosporine A; NK, natural killer; N/A, data was not available in the study; Igs, Immunoglobulins; CICs, circulating immune complexes; UAS, urticaria activity score; SD, standard deviation; CR, complete response; NR, no response; PR, partial response; IL, interleukin; TNF-α, tumor necrosis factor alpha.
*Response, improvement of clinical score at 30%–90%; †Complete response, improvement of clinical score at > 90%; ‡Total symptom severity score: itching severity (0–3), flare (0–3), and number of wheals (0–3); §Sum of 7 days of daily UAS (range from 0–42) daily UAS total score of 2 categories: 1) intensity of pruritus (0 = none, 1 = mild, 2 = moderate, 3 = intense), 2) number of wheals (0 = none, 1 = 1–20 wheals, 2 = 20–50 wheals, 3 = more than 50 wheals).
![]()
1) Immunophenotypical analysis of lymphocytes
One open-labelled, prospective study by Loria et al.20 examined the association of the distribution of serum blood T, B, and natural killer (NK) cells before and after short-term CsA treatment in 10 CSU patients. At baseline, T cells (CD3, CD4, CD8), B cells (CD19), and NK cells (CD56, CD57) were normal, but high percentage of activated B cells (CD19+CD23+ cells) in all patients. After CsA treatment, the CD3, CD4, CD8, CD56, and CD 19 expression were reduced, but no statistically significant differences. A decrease in activated B cells was reported in only 2 patients, but the differences in the mean percentages were not statistically significant.
2) Serum immunoglobulins (Igs), C3, C4, circulating immune complexes (CICs)
One open-labelled, prospective study investigated the association of serum Igs, C3, C4 levels and CICs before and after CsA treatment. Loria et al.20 studied 20 patients with antihistamine-resistant CSU. CsA (5 mg/kg/day for 8 weeks) was prescribed for 10 patients, and prednisolone (20 mg/day for 8 weeks) was prescribed for the other 10. The serum Igs, C3, and C4 complement levels were normal either before or after receiving CsA treatment, whereas the CICs were negative before and after treatment with CsA. The findings indicated that serum Igs, C3, C4 and CICs are not associated with the responses to CsA treatment.
3) Serum IgE
Santiago et al.22 and Endo et al.23 studied the association between serum IgE levels and clinical responses after 3 mg/kg/day of CsA treatment. They found that clinical responders were significantly higher in patients with low serum IgE levels than in those with high serum IgE levels (P = 0.0002 and P = 0.0009, respectively). Taken together, serum IgE levels might be one of the biomarkers for predicting the response to CsA therapy.
4) Serum IL-2, IL-5, and TNF-α
Serhat Inaloz et al.7 performed an open-labelled, prospective study and reported that the serum IL-2, IL-5, and TNF-α levels were elevated in all 27 CSU patients before treatment, with consequent decreases after treatment with CsA. The increase in clinical efficacy and the significant decreases in serum IL-2, IL-5, and TNF-α levels suggested that inhibition of IL-2, IL-5, and TNF-α generation might be involved in the action of CsA. The authors concluded that there was a significant association between higher levels of serum IL-2, IL-5, and TNF-α and good responses to CsA treatment.
DISCUSSION
The study of reliable factors could lead to a personalized approach in the management of CSU and offer objective information regarding response to therapy. Our systematic review showed that prior histories of urticaria (1 non-RCT); positive ASST results (3 non-RCTs); positive baseline BHRAs (1 RCT, 2 non-RCTs); elevated baseline plasma D-dimer levels (1 non-RCT); and elevated baseline serum IL-2, IL-5, and TNF-α levels (1 non-RCT) might help predict favorable CsA responses in CSU patients. Decreased plasma D-dimer levels (1 non-RCT); and decreased serum IL-2 (1 non-RCT), IL-5 (1 non-RCT), TNF-α levels (1 non-RCT), and low baseline serum IgE levels (2 non-RCTs) after CsA treatment correlated with clinical improvement; they might be used to monitor clinical CsA responses. However, it should be noted that there is only 1 study regarding a history of urticaria, either acute or chronic.
Histamine-releasing activity can be evaluated by a BHRA and the flow cytometric measurement of CD63 expression. Basophil activation can induce the release of mediators as well as the expression of membrane-bound activation markers, such as CD63 and CD203c.242526 CD63 up-regulation has been shown to be correlated with histamine release from activated basophils.27 Three studies concluded that CSU patients with positive baseline BHRA results responded better to CsA than those with negative results. The suppression of the BHRA response was significantly increased after CsA treatment.61416
The pathogenesis of CSU has been reported to be associated with thrombin generation. The D-dimer level is a marker for fibrin generation and subsequent degradation.28 One study reported that baseline plasma D-dimer levels showed a statistically significant negative correlation with the CsA response. The authors concluded that plasma D-dimer is useful for monitoring the clinical response to CsA treatment in most patients with severe diseases.13
Pro-inflammatory cytokines, released from T cells, also play a major role in the pathogenesis of CSU.29 CsA reduced the effect of the transcription factor in T cells that regulate the transcription of a number of cytokine genes including IL-2, IL-6, and TNF-α.2930 Serhat Inaloz et al.7 reported a significant association between higher levels of serum IL-2, IL-5, and TNF-α and good responses to CsA treatment.
Several limitations should be noted in this study. The results should be interpreted with caution. First, we cannot exclude the possibility of publication bias as the majority of included articles were observational studies, which did not have pre-registered study protocols. Therefore, they might not report negative results. In addition, the included studies did not adjust the results for potential confounders and we cannot be certain whether the observed results were a function of the variable of interest or confounders. The sample size in observation studies is also frequently not optimized for a hypothesis testing. Therefore, the lack of statistical significance may be simply due to the lack of statistical power and does not suggest the lack of clinical relevance. Secondly, a general problem in the assessment of potential factors is the lack of specificity for the predicting factors. For example, D-dimer or CRP levels have been shown to be elevated in CSU and to correlate with the responses to treatment. However, they can be elevated in many other diseases (e.g., chronic infections and autoimmune disorders). Moreover, the differences in the study designs and the ages of the patients included in various studies should be taken into consideration: these factors could have influenced the outcomes of the potential-factor assessments. RCTs regarding factors that could potentially predict a favorable response to CsA treatment for CSU are needed to fulfil the gap. Thirdly, only 5 of 13 articles described marketed formulations of CsA (the microemulsion or the original formulation) which may have affected the interpretation of response to CsA in each study.
In conclusion, since most positive results were from non-RCT articles and some data were still inconsistent, this systematic review identified no reliable practical biomarker for predicting CsA treatment response. There were no positive predictors with good consistency and mechanical plausibility.
 XML Download