

 PDF
PDF ePub
ePub Citation
 Print
Print


INTRODUCTION
Chronic rhinosinusitis (CRS) is a group of disorders characterized by inflammation of the nasal and paranasal sinus mucosa that lasts at least 12 weeks.1 The overall, annual direct costs range from $10 to $13 billion in the United States.2 CRS is commonly subdivided into 2 categories based on nasal polyp (NP) status: CRS with NPs (CRSwNP) and CRS without NPs (CRSsNP).1 However, it does not adequately reflect the immunological profile at either the cellular or the molecular level.34 To overcome the limitations of traditional classification, several attempts have been made to characterize CRS endotypes using the clinical data and the levels of inflammatory cytokines.56 Liao et al.
5 divided CRS patients into 7 clusters by their clinical characteristics. Tomassen et al.
6 divided CRS patients into the ten clusters based on their cytokine profiles. Endotype-specific treatment requires the detailed characterization of CRS features.
Nasal samples, including tissues,6 lavages,7 swabs8 and suctions,910 have been used to identify the CRS endotypes. However, the invasive procedures (e.g., biopsy) are associated with the risk of infection and must be performed by experts.11 Nasal lavages, swabs and suctions have alternatively been obtained; these are constantly available, and sampling does not involve a risk of infection.11 Moreover, the proteins in nasal samples like the antimicrobial proteins1213 and immunoglobulins14 could reflect the upper airway diseases.7891015 Thus, the nasal secretions are valuable when studying CRS endotypes.11 However, to date, only small numbers of proteins have been identified in such samples; few CRS biomarkers are available.11 Here, we aimed to collect and analyze the nasal secretions using filter paper considering that the proteins bind readily to the filter paper and are thus preserved.1617
Mass spectrometry (MS)-based human proteome studies have been performed since beginning of the century. Such work reliably describes human proteomes.18 The most common method employed is the data-dependent acquisition (DDA); precursors (MS1 species) are sequentially selected from full-mass MS1 scans for the fragmentation and acquisition by MS/MS scans.19 Recent DDA developments enable unbiased, near-complete proteome coverage20; earlier stochastic DDA was associated with the poor reproducibility and limited precision.21 Data-independent acquisition (DIA) is a recent development featuring quantitative analyses of all the peptides within defined mass (m/z) ranges.19 DIA overcomes the limitations of the DDA, affording selected reaction monitoring-like quantification of the thousands of proteins, which is associated with fewer missing values.22 However, the peptide quantification requires access to spectral libraries derived from the DDA experiments.21 As both the methods afford the particular advantages, but are complementary, we identified the proteins using the 2 methods. We explored the proteomes of nasal secretions collected on the filter paper and identified a large number of proteins involved in the known pathways. Furthermore, we sought to identify the candidate proteins with the 2 different analytical methods of the DDA and DIA.
MATERIALS AND METHODS
Patients and nasal secretions
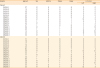
Patients were enrolled after provision of written informed consent as dictated by the protocol of the Internal Review Board (IRB) of Seoul National University Hospital (IRB No. C-1308-099-515). CRS was diagnosed based on history taking, physical examination, nasal endoscopy and sinus computed tomography by reference to the 2012 European position paper on rhinosinusitis and NPs guidelines.1 The exclusion criteria were as follows: 1) age less than 14 years and 2) unilateral rhinosinusitis, antrochoanal polyps, allergic fungal sinusitis, cystic fibrosis or immotile ciliary disease. Demographic characteristics, including age, sex, asthma and polyposis status, skin prick test results and Lund-Mackay scores are summarized in Table 1. Control samples were obtained from patients with a deviated nasal septum but without any sinonasal disease. The sinonasal specimens obtained during endoscopic sinus surgery were fixed in formalin embedded in paraffin. Standard 5-µm sections were stained with hematoxylin-eosin. The number of eosinophils and neutrophils were determined in 3 high-power fields (×400) per section under light microscopic examination.
Table 1
Demographic characteristics of subjects for the cohort1 (data-dependent acquisition set) and cohort2 (data-independent acquisition set)
Nasal secretions were collected from both sides of the nose using small sterilized strips of filter paper (7 × 30 mm; Whatman No. 42, Whatman, Clifton, NJ, USA) placed on the middle meatus (around uncinate process) with endoscopic guidance for 10 minutes. The 2 filter papers from each patient were placed in a single cryotube and stored at –70°C. After thawing, 1 mL of nuclease-free water was added to each tube, and the tubes were rotated for 1 hour at room temperature; the aqueous samples were stored in aliquots at –70°C. One hundred-microliter amounts of all aliquots were centrifuged (15,000 rpm, 4°C, 10 minutes) to remove insoluble debris and supernatant protein concentrations measured by assessing tryptophan fluorescence at 350 nm at an excitation wavelength of 295 nm.23 The samples were then stored at –80°C.
Reagents and materials
Liquid chromatography (LC)-MS-grade acetonitrile (ACN), water, methanol, acetone and Tris(2-carboxyethyl) phosphine (TCEP) were purchased from Thermo Fisher Scientific (Waltham, MA, USA). Dithiothreitol and urea were obtained from AMRESCO (Solon, OH, USA). Sodium dodecyl sulfate (SDS) and Trizma base were purchased from USB (Cleveland, OH, USA), and sequencing-grade modified trypsin was acquired from Promega Corporation (Madison, WI, USA). POROS20 R2 beads were purchased from Applied Biosystems (Foster City, CA, USA). Unless otherwise noted, all other reagents were purchased from Sigma-Aldrich (St. Louis, MO, USA).
Protein digestion
Acetone was used to precipitate the proteins from 50-µL amounts of aqueous samples overnight at −20°C; this was followed by protein digestion using a modification of the 2-step filter aided sample preparation procedure.2425 Protein pellets were dissolved in SDT buffer (2% [w/v] SDS, 10 mM TCEP, and 50 mM chloroacetamide in 0.1 M Tris pH 8.0) and loaded onto 10K Amicon filters (EMD Millipore, Danvers, MA, USA). The buffer was exchanged with UA solution (8 M urea in 0.1 M Tris pH 8.5) via centrifugation at 14,000 g. Following further buffer exchange employing 40 mM ammonium bicarbonate (ABC), protein digestion was performed overnight at 37°C using a trypsin/LysC mixture at a 100:1 protein:: protease weight ratio, and the digested peptides collected via centrifugation. The filters were washed with 40 mM ABC, and digestion was repeated at 37°C for further 2 hours (trypsin-to-substrate ratio [w/w] of 1:1,000). All resulting peptides were acidified with 10% (v/v) TFA and desalted using C18-StageTips prepared in-house, as previously described.2425 The desalted samples were lyophilized in a vacuum dryer and stored at −80°C.
High-pH StageTip-based peptide fractionation
To construct a spectral library of the nasal fluid proteome, StageTip-based, high-pH peptide fractionation was performed according to a modified version of a procedure described earlier.24 Peptides from pooled samples were dissolved in 200-μL amounts of loading solution (10 mM ammonium formate [pH 10] and 2% [v/v] ACN) and separated on reversed-phase tip columns prepared by packing POROS 20 R2 beads (Invitrogen, Carlsbad, CA, USA) into 200- µL yellow tips fitted (at the exit sites) with C18 Empore disk membranes (3M; Bracknell, UK). After microcolumn conditioning with methanol, ACN, and loading buffer, peptides were loaded at pH 10, and 20 fractions were subsequently eluted in ACN buffer (pH 10; 5%, 10%, 15%, 20%, 25%, 30%, 35%, 40%, 60% and 80% [v/v] ACN). To ensure orthogonal fractionation of RP-RP separation, the 20 fractions were non-contiguously combined into 6 fractions, dried in a vacuum centrifuge, and stored at –80°C prior to LC-MS/MS.
LC-MS/MS
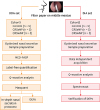
All LC-MS/MS analyses (DDA and DIA) were performed with the aid of a Quadrupole Orbitrap mass spectrometer (Q-Exactive plus; Thermo Fisher Scientific) coupled to an Ultimate 3000 RSLC system (Dionex, Sunnyvale, CA, USA) via a nanoelectrospray source, according to a modified version of the procedure described earlier.2426 Peptide samples were separated on a 2-column array (trap column 75 µm internal diameter [ID] × 2 cm, C18 3 µm, 100 Å) and an analytical column (50 µm ID × 50 cm, C18 1.9 µm, 100 Å). Prior to sample injection, the dried peptide samples were re-dissolved in solvent A (2% [v/v] ACN and 0.1% [v/v] formic acid). After sample loading onto the nano-LC column, a 180-minute gradient (8% to 26% solvent B [100% {v/v} ACN and 0.1% {v/v} formic acid]) was used for elution. The spray voltage was 2.0 kV (positive ion mode), and the capillary temperature was 320°C. DDA mass spectra were acquired using the “top 15” method. The Orbitrap analyzer scanned precursor ions within the mass range 300–1,650 m/z; the resolution was 70,000 at 200 m/z. Higher energy collisional dissociation (HCD) scans were acquired at a resolution of 17,500 and a normalized collision energy (NCE) of 27. The maximum ion injection and MS/MS scan times were 20 and 120 ms, respectively. DIA featured a survey scan at a resolution of 35,000 (from 400 to 1,220 m/z [automatic gain control target 3 × 10⁶ or injection time 60 ms]). Nineteen DIA windows were acquired at a resolution of 35,000 at an automatic gain of 3–6 using the automated injection mode.27 HCD peptide fragments were acquired using 24 to 30 stepped NCE. The LC-MS/MS workflow is shown in Fig. 1.
Fig. 1
Overall workflow. Workflow of the nasal secretions proteomic analysis.
DDA, data-dependent acquisition; DIA, data-independent acquisition; CRSsNP, chronic rhinosinusitis without nasal polyp; CRSwNP, chronic rhinosinusitis with nasal polyp; DEP, differentially expressed protein; MED-FASP, multi-enzyme digestion filter aided sample preparation.
Data processing for label-free quantification
Mass spectra were processed with the aid of MaxQuant software (version 1.5.3.1). MS/MS spectra were analyzed using the Human Uniprot protein sequence database (December 2014, 88,657 entries) with the aid of the Andromeda search engine.28 Primary searches featured a 6-ppm precursor ion tolerance when total proteins were analyzed. The MS/MS ion tolerance was 20 ppm. Cysteine carbamidomethylation status served as the control modification. N-acetylation of protein and methionine status were considered to vary. Enzyme specificity featured full tryptic digestion. Peptides of at least 6 amino acids in length featuring 2 or fewer missed cleavages were analyzed. The false discovery rate (FDR) was set to 1% at the peptide, protein and modification levels. To maximize quantifications across samples, we enabled the “Match between Runs” option of the MaxQuant platform. To minimize heterogeneity among human samples,29 we created in silico pools of 5 biological replicates of the same phenotypic classes: control, CRSsNP and CRSwNP samples. We employed the Maxquant label-free quantification algorithm30 (a component of MaxQuant software). To quantitate the DDA data, we included the proteins that were identified from more than 70% of subjects in at least 1 group.
DIA MS data processing
To generate spectral libraries, we performed 12 urine DDA measurements and compared the spectra with those in the Maxquant Uniprot Human Database (December 2014, 88,657 entries) and the iRT standard peptide sequences. The spectral library (derived using individual the DIA data) was generated with the aid of Spectronaut ver. 10 software (Biognosys, Schlieren, Switzerland). First, we converted the DIA raw files into .htrm format using the GTRMS converter of Spectronaut. FDRs were estimated employing the mProphet31 approach and were set to 1% at both the peptide precursor and protein levels. The software inferred the proteins encountered, and the protein levels were quantified using the q value < 0.01 criterion.
Statistical analysis
Statistical analyses were performed with the aid of Perseus32 and IBM SPSS ver. 25 software (SPSS, Chicago, IL, USA). Missing values were imputed assuming that a normal distribution (width = 0.15, downshift = 1.8) was in play; this simulated signals from low-abundance proteins. The data were then normalized via width adjustment (this scales all values to equalize the interquartile ranges).33 To allow for pairwise proteome comparisons, 2-sided t tests were performed using the Benjamini-Hochberg FDR with the significance level set to 5%. To compare the 3 groups, we performed analysis of variance (ANOVA) using the Benjamini–Hochberg FDR at an adjusted P value of 0.05. Normalized protein abundance levels were subjected to further z-normalization followed by hierarchical clustering in terms of the Pearson correlation distance. Also, Pearson P values were calculated employing SPSS software. If a protein distribution was not normal, we calculated Spearman correlation coefficients.
Bioinformatics
Functional gene ontology (GO) analysis was performed with the aid of DAVID Bioinformatics Resources ver. 6.8 software (National Institute of Allergy and Infectious Diseases, National Institutes of Health, Bethesda, MD, USA; http://david.abcc.ncifcrf.gov/). GO biological processes were identified using the Enrichr online tool (http://amp.pharm.mssm.edu/Enrichr/). The top 10 enriched terms (and their P values) were identified. Canonical pathways were enriched using Ingenuity Pathway Analysis (IPA; QIAGEN, Hilden, Germany) software. The analytical algorithms of IPA employ input protein lists to predict canonical pathways. The confidence level is reflected in the P value of Fisher's exact test, and the extent of activation is reflected by the Z-score. Here, the P value cutoff for enrichment was 0.05, and the predictive activation Z-score cut-off was unity. The MS proteomics data have been deposited to the Proteome Xchange Consortium via the PRIDE34 partner repository with the dataset identifier PXD013330.
RESULTS
DDA protein profiles
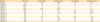
The mean protein concentration of nasal secretions was 1.95 mg/mL (standard deviation [SD], 2.56 mg/mL) in healthy controls, 0.95 mg/mL (SD, 0.84 mg/mL) in CRSsNP patients and 0.85 mg/mL (SD, 0.49 mg/mL) in CRSwNP patients; these values did not significantly differ (P = 0.50). The number of identified proteins in the DDA set are shown in Fig. 2A. In total, 2,020 proteins were identified in 5 healthy controls, 5 CRSsNP patients and 5 CRSwNP patients (1,745, 1,542 and 1,678 proteins, respectively). The total number of proteins identified in all groups was greater than the number of proteins in each patient, which implies individual differences in protein composition. To identify the differences within and between groups, the protein profiles were generated by drawing multi-scatter plots and calculating Pearson correlations (Supplementary Fig. S1). We then calculated the average Pearson correlation coefficients (PCCs) within and between groups; PCC > 0.7 were regarded as high.35 The control, CRSsNP and CRSwNP groups displayed the average PCCs of 0.77, 0.80 and 0.73, respectively; the control-CRSsNP, control-CRSwNP and CRSsNP-CRSwNP values were 0.69, 0.74 and 0.67, respectively. As expected, the differences between groups were larger than within groups. The mass intensities were similar in all samples (Supplementary Fig. S2A). We compared the number of proteins identified by collection of nasal secretions on the filter paper to those of previous proteomic studies (Fig. 2B and Table 2). We identified 2,020 proteins, which were approximately 3-fold more than those identified in previous studies.78910 Although we attempted to analyze only nasal secretions, the number of proteins identified was similar to those identified in the nasal epithelium.29 We performed the functional analysis using DAVID software and the canonical pathway analysis using IPA suite to check whether they match the known GO terms and pathways. The former was performed with 1,842 proteins that were identified in the pooled DDA set and revealed 13 GO biological processes (Supplementary Fig. S3). The immune system processes were associated with the lowest P value (P = 1.51e-41); the proteome of nasal secretions was thus significantly associated with the immune system. The latter was performed in the pooled DDA set with 924 and 548 proteins that were differentially expressed in the CRSsNP-control and the CRSwNP-control, respectively (P < 0.05). It revealed 112 pathways the up- or down-regulated in CRS patients compared to control (Supplementary Table S1); 11 pathways associated with the immune system are shown in Fig. 2C.
Fig. 2
Protein profiles in the DDA set. (A) Bar plot of total number of the identified proteins from the 3 technical replicates in the DDA set. Error bars were means ± standard deviations of the triplicates in control, CRSsNP and CRSwNP, respectively. (B) Comparison of the identified proteins in our study and other nasal sample proteomic studies. (C) Canonical pathway analysis representing significantly the up- or down-regulated canonical pathways in CRSsNP and CRSwNP compared to control. The values are activation Z-scores of the canonical pathways in order of the highest scoring with the values color indexed orange for the positive scores and blue for the negative scores.
F, filter paper; SW, swab; SU, suction; L, nasal lavage; B, brushing; AR, allergic rhinitis; DDA, data-dependent acquisition; CRSsNP, chronic rhinosinusitis without nasal polyp; CRSwNP, chronic rhinosinusitis with nasal polyp; IL, interleukin; Cont, control; CCR3, C-C chemokine receptor type 3.
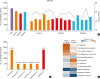
Table 2
Method comparison of our study and the 5 previous proteomic studies on the nasal sample
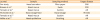
| Journal | Sample | Sampling method | Target disease |
|---|---|---|---|
| Our study | Nasal secretion | Filter paper | CRS |
| Biswas et al.8 | Nasal mucus | Swab | CRS |
| Tomazic et al.9 | Nasal mucus | Suction | AR |
| Mortstedt et al.7 | Nasal lavage fluid | Nasal lavage | Rhinitis |
| Tomazic et al.10 | Nasal mucus | Suction | AR |
| Ndika et al.29 | Nasal epithelium | Brushing | AR |
Hierarchical clustering of differentially expressed proteins (DEPs) in the 3 groups; DDA analyses
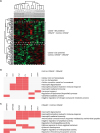
We next performed a hierarchical clustering and an ANOVA to identify DEPs in all the 3 groups; 1,666 proteins were DEPs (FDR < 0.05) (Fig. 3). Notably, the expression pattern of CRSsNP protein differed from those of the other 2 groups. As nasal polyposis is more severe form, we identified the up- or down-regulated proteins in CRSwNP compared to control and CRSsNP. The hierarchical clustering revealed 3 clusters of the up- or down-regulated CRSwNP proteins.
Fig. 3
Hierarchical clustering of differentially expressed proteins among 3 groups in the DDA set. A total of 1,666 proteins were identified between control, CRSsNP and CRSwNP in the DDA set (ANOVA, FDR < 0.05). The protein expression profiles were distinct from each other, and the technical triplicates were closest to each other.
DDA, data-dependent acquisition; CRSsNP, chronic rhinosinusitis without nasal polyp; CRSwNP, chronic rhinosinusitis with nasal polyp.

Functional clustering analysis of the DDA protein clusters
We used an Enrichr software to identify whether they match the known GO terms. The clustergram visualizes associations between columns and rows using heatmap. The columns are the top 10 enriched terms ranked based on their enrichment score, and the rows are the weighted input genes hierarchically clustered based on their association with columns.36 Twenty proteins of the top 10 GO terms indicated that the up-regulated proteins in CRSwNP (clusters 1 and 3) were significantly associated with the neutrophil-associated GO pathway (Fig. 4A and C). To confirm this, a histologic analysis was performed in CRS patients in the DDA set (Table 3). There were 2 eosinophilic CRS (CRSsNP_1, 4), 7 non-eosinophilic CRS, and 1 unknown CRS (CRSwNP_3). As 4 out of the 5 CRSwNP patients were non-eosinophilic, the neutrophil-associated GO terms could be explained by the histology findings. On the other hands, the down-regulated proteins in CRSwNP (cluster 2) were significantly involved in the platelet-associated GO pathway (Fig. 4B). As expected, the GO terms of the up-regulated proteins in CRSwNP differed from those of the downregulated proteins.
Fig. 4
Clustergrams of the up- or down-regulated proteins in CRSwNP in the data-dependent acquisition set. Clustergrams of the proteins in the 3 clusters analyzed using Enrichr. The cluster of 20 proteins to the top 10 biological process terms were illustrated in cluster 1 (A), cluster 2 (B) and cluster 3 (C).
CRSsNP, chronic rhinosinusitis without nasal polyp; CRSwNP, chronic rhinosinusitis with nasal polyp.
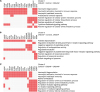
Table 3
Total cell count and the percentage of the eosinophils and neutrophils in cohort1
Protein profiles of the DIA set
Although the DDA mode identified thousands of proteins, its reproducibility and precision are limited.19 Therefore, we used the DIA mode to perform the proteomic analysis, as DIA had allowed for precise and reproducible quantification.19 In addition, the other cohorts (cohort 2) were analyzed with the DIA mode to obtain the reproducible proteins with different analytical methods and cohorts. To identify the differences within and between groups, we calculated the average PCCs within and between the DIA groups (Supplementary Fig. S4). The control, CRSsNP and CRSwNP groups displayed the average PCCs of 0.75, 0.79 and 0.74, respectively. The control-CRSsNP, control-CRSwNP and CRSsNP-CRSwNP comparisons revealed average PCCs of 0.78, 0.75 and 0.77, respectively. Notably, both the between- and within-group differences were similar, as were the intensities of samples (Supplementary Fig. S2B). A total of 1,278 proteins were quantified in the DIA mode and the number of quantified proteins in each subject was depicted in Supplementary Fig. S5. We next performed a correlation analysis to explore whether the intensities of proteins from the DDA and DIA were similar in the control, CRSsNP and CRSwNP groups. The intensities of proteins of the triplicated DDA and duplicated DIA samples were averaged and compared, respectively. We found the significant positive correlations between the intensities of proteins from the DDA and DIA in all the 3 groups (Supplementary Fig. S6).
Hierarchical clustering of the DIA DEPs in the 3 groups
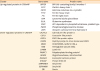
To identify the DEPs in the 3 groups, a hierarchical clustering and an ANOVA were performed with 1,278 proteins from the DIA set. In total, 125 proteins were identified as DEP in the 3 groups (ANOVA, P < 0.05) (Fig. 5A). The hierarchical clustering revealed 2 clusters of the up- or down-regulated proteins in CRSwNP compared to control and CRSsNP.
Fig. 5
Verification of the up- or down-regulated proteins in CRSwNP. (A) A total of 125 proteins were identified between control, CRSsNP and CRSwNP in the DIA set (ANOVA, P < 0.05). We clustered the up- or down-regulated proteins in CRSwNP compared to control and CRSsNP. Clustergrams of the upregulated proteins (B) and the downregulated proteins (C) both the DDA and DIA set. The clusters of proteins to the top 10 biological process terms were illustrated.
DDA, data-dependent acquisition; DIA, data-independent acquisition; CRSsNP, chronic rhinosinusitis without nasal polyp; CRSwNP, chronic rhinosinusitis with nasal polyp.
Functional analysis of the up- or down-regulated DDA and DIA proteins in CRSwNP samples
We sought to identify the proteins that had the similar patterns of expression in the DDA and DIA set. Of the upregulated proteins in CRSwNP (clusters 1 and 3) in the DDA set, the proteins commonly identified in cluster 2 in the DIA set were selected (Table 4). Similarly, of the down regulated proteins in CRSwNP (cluster 2) in the DDA set, the proteins commonly identified in cluster 1 in the DIA set were selected. We used an Enrichr to check whether they match the known GO terms. The rows are the input genes hierarchically clustered based on their association with columns.36 Of the 10 and 14 proteins, it could be seen that the only 6 proteins were associated with the top10 GO terms, respectively; the clustergrams are shown in Fig. 5B and C. Interestingly, the downregulated proteins (coactosin-like protein [COTL1], calmodulin-like protein 5 [CALML5], protein S100-A7 [S100A7] and eosinophil cationic protein [ECP; RNASE3]) and the up-regulated proteins (ferritin light chain [FTL], ferritin heavy chain [FTH1] and lysosomal alpha-glucosidase) in CRSwNP were associated with the neutrophil associated GO pathway. Ferritin (an iron storage protein) is composed of FTL and FTH1.37 The ferritin was upregulated in CRSwNP compared to control and CRSsNP. It was involved in the top 3 GO terms related to the iron ion and metal iron homeostasis (Fig. 5B). Meanwhile, the proteins decreased in CRSwNP compared to control and CRSsNP were associated with the GO terms related to the antimicrobial defense and the negative regulation of peptidase activity (Fig. 5C).
Table 4
Similar proteins expression patterns both in the data-dependent acquisition and data-independent acquisition
DISCUSSION
Proteomic analysis of the nasal secretions from CRS patients retained on the filter paper identified approximately 3 times as many proteins as did previous studies. The canonical pathway analysis and the GO analysis revealed that the interleukin (IL)-7, IL-9, IL-17A and IL-22 signaling and the neutrophil-mediated immune responses were significantly increased in CRSwNP compared to control. The possible reason why we could identify more proteins than did previous studies could be explained by that we retained nasal secretions on the filter paper, which could provide a solid protein-stabilizing matrix preventing the cytokine-mediated protein neutralization and the protease degradation.1617 Additionally, we minimized the sample preparation steps to reduce peptide loss and used an advanced MS to identify the large number of proteins. Moreover, to increase the reliability of our results, we detected the proteins by the DDA and DIA modes, because each has the particular advantages and limitations. We identified 2,020 proteins in the DDA mode and 1,278 in the DIA mode. While the DDA mode had many missing values, the DIA mode afforded the quantification of proteins with few missing values.
We identified the proteins that were the up- or down-regulated in CRSwNP compared to control and CRSsNP in these 2 modes. Among the selected proteins, FTL and FTH1 upregulated in CRSwNP were involved in the iron homeostasis. Since the serum ferritin level is a well-known marker of inflammation, it is elevated in patients with various inflammatory conditions like autoimmune diseases.38 Because the association between CRSwNP and the iron metabolism remains unknown, further studies would be worthwhile.
Shi et al.39 reported that the mRNA level of RNASE3 (also termed ECP) was significantly increased in eosinophilic CRSwNP compared to control, CRSsNP and non-eosinophilic CRSwNP; these values did not significantly differ between control, CRSsNP and non-eosinophilic CRSwNP. In the present study, the ECP expression level decreased in non-eosinophilic CRSwNP compared to control and CRSsNP. We speculated that it could be due to small sample size. Meanwhile, it was previously reported that S100A7 stimulates the neutrophils to produce pro-inflammatory mediators like IL-6, IL-8 and tumor necrosis factor.40 However, in our study, S100A7 was decreased in non-eosinophilic CRSwNP compared to control and CRSsNP (Table 4). These results were different from the previous studies.
Nevertheless, our results supported the findings of the previous studies. In the canonical pathways, IL-17A was upregulated in CRSsNP and non-eosinophilic CRSwNP compared to control (Fig. 2C) as previously reported.4142 Among the sirtuin families, sirtuin 1 contributes to reduce nasal polyposis.43 In the present study, the sirtuin signaling pathway was significantly decreased in CRSwNP compared to control (Fig. 2C). On the other hand, Nograles et al.44 reported that CALML5 was down-regulated by IL-22. The possible reason why CALML5 expression was downregulated in CRSwNP compared to control could be explained by the previous study (Figs. 2C and 5C). Meanwhile, according to the dataset GSE22103,45 the gene expression of COTL1 was significantly decreased after the neutrophil stimulation compared to control. In addition, the up-regulated proteins in CRSwNP patients (clusters 1 and 3) were associated with the neutrophil degranulation, activation, and the neutrophil mediated immunity (Fig. 4A and C). It supports that more than half of East Asian CRSwNP patients show non-eosinophilic inflammation.42
A large number of proteins that were identified in the present study partially suggest that the up- or down-regulated proteins in CRSwNP reflected the immune responses involving neutrophils and immunobarrier activation as previously reported.42464748 However, our study had limitations that should be considered. First, the sample size was small. Second, the cohort included some subjects with the comorbidity of asthma or atopy. Thus, it was not possible to exclude the effect of these comorbidities on the nasal secretions. Therefore, further studies with the larger sample size are needed to determine the effect of the comorbidity of asthma or atopy on the nasal proteome in CRS.
In conclusion, our findings indicate that a large number of proteins are reproducibly identified by non-invasive collection of nasal secretions on the filter paper. In addition, our proteomic signatures support that Asian NPs could be characterized as non-eosinophilic inflammation features. The proteomes could be used to endotype CRS and improve our understanding of the CRS and NP pathogenesis.
 XML Download