

 PDF
PDF ePub
ePub Citation
 Print
Print


INTRODUCTION
Medical laboratory services are important for disease diagnosis and treatment. Laboratory test results influence 70% of medical diagnoses [1]. Errors in test results lead to inappropriate care and sometimes death [23]. Medical laboratories should provide clinicians high quality laboratory services for patient safety.
The Clinical Laboratory Improvement Amendments (CLIA) of 1988 require all US clinical laboratories to be regulated for reliable and reproducible testing [4]. CLIA regulations address specific quality requirements that are designed to monitor and improve the quality of the entire testing process. Large medical and referral laboratories in the US meet the CLIA requirements by following the testing standards of a professional accreditation organization, such as the Joint Commission and the College of American Pathologists, recognized by the Centers for Medicare and Medicaid Services [5]. The CLIA requirements include standards for laboratory personnel, test management, quality control, quality assurance, and external quality assessment.
In Korea, 289 medical laboratories met the requirements of the Korean Laboratory Accreditation Program (KLAP) and received certification in 2016 [6]. During the KLAP inspection, various aspects of laboratory operation and management are evaluated, including procedure manuals, quality control (QC), test management, patient preparation, sample collection, method evaluation and test result reporting, laboratory personnel, quality assurance, and external quality assessment.
The KLAP and CLIA have set the minimum standards that should be met when verifying clinical test performance. The laboratory should verify the performance characteristics: accuracy, precision, reportable range, and reference interval [7]. The verification process confirms that the instrument and/or test method performs as the manufacturer intended when utilized in clinical laboratories. In addition, the KLAP and CLIA mandate verifying new reagent lot performance. Each new reagent lot has the potential to affect QC material and/or patient sample performance. Ensuring lot-to-lot consistency is critical for testing, because small changes in concentration might trigger further testing or other clinical intervention.
These verification processes are time-consuming and labor-intensive when performed manually using commercial statistical software such as Excel (Microsoft, Seattle, WA, USA), SPSS (SPSS Inc., Chicago, IL, USA), or MedCalc (MedCalc Software bvba, Ostend, Belgium). Therefore, a few commercial programs, such as EP Evaluator (Data Innovations, South Burlington, VT, USA) and Analyze-It (Analyze-It Ltd, Leeds, UK), have been developed. These programs are designed to assist the clinical laboratory in meeting minimum regulatory requirements for test evaluation and verification. However, they are slightly expensive for small laboratories. We therefore designed and evaluated a simple, automated, free software program, LaboStats, to verify the performance characteristics of clinical tests in accordance with the CLSI guidelines. LaboStats can be downloaded from the webpage of the Laboratory Medicine Foundation of Korea (http://www.lmf.or.kr).
METHODS
Software design
We examined the KLAP checklists (laboratory organization, external quality assessment, QC, quality assurance, pre-analytic process, analytic process, post-analytic process, management of laboratory equipment, laboratory personnel, and laboratory environment) and computerized them for meeting minimum regulatory requirements for test evaluation and verification. The selected checklists included reagent lot comparability test, precision, method comparison, linearity, reference interval, and cutoff for qualitative testing. LaboStats was also intended to generate a standardized reporting format showing the results accurately.
Algorithms
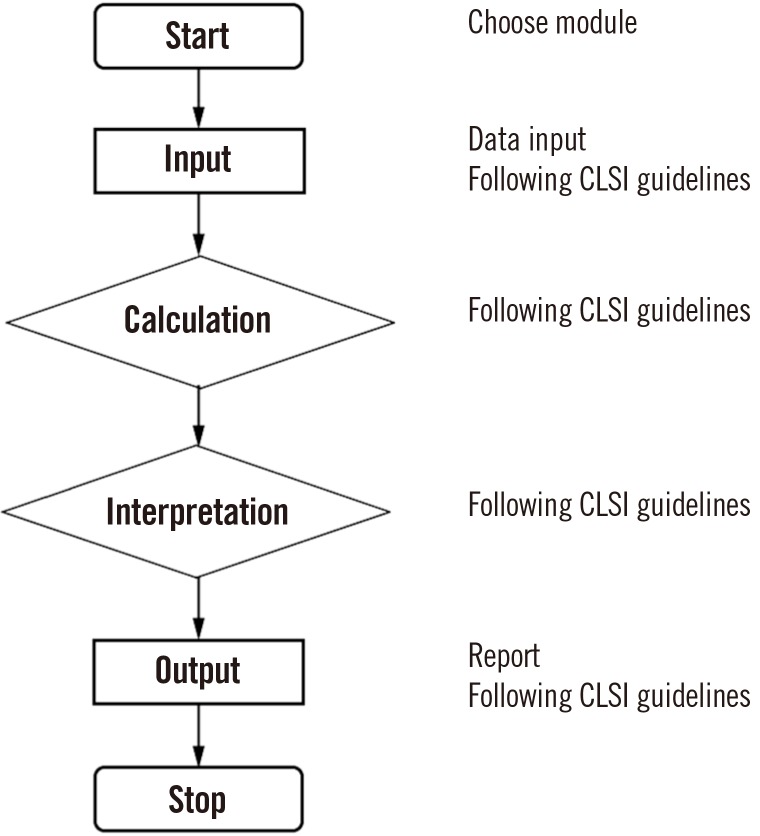
We used the CLSI guidelines as a series of instructions for six statistical modules: parallel test, linearity, method comparison, precision, reference interval, and cutoff (Fig. 1). The parallel test module for reagent lot comparability testing followed the CLSI guidelines EP26-A [8]; the linearity module followed the CLSI guidelines EP06-A [9]; the method comparison module followed the CLSI guidelines EP09-A3 [10]; the precision module followed the CLSI guidelines EP15-A3 [11]; the reference interval module followed the CLSI guidelines C28-A3c [12]; and the cutoff module followed the CLSI guidelines EP12-A2 [13].
Software development
Delphi was developed as a rapid application development tool for Windows [14]. We built graphic user interfaces, including data input, with Embarcadero Delphi EX4 (Embarcadero Technologies, Inc., Texas, USA). Data was calculated and interpreted using the R language (R Foundation for Statistical Computing, Vienna, Austria). R is highly productive for statistical computing and modeling; the implementation of statistical and graphical procedures is organized in the form of packages. R packages are collections of functions and data sets developed by the community. We used two packages in our software: the R Base Package and MCR Package for Method Comparison Regression. The R Base Package contains the basic functions that enable R to function as a language and compute basic statistical properties. The MCR Package provides regression methods to quantify the relationship between two measurement methods. This package enables implementation of Deming regression, weighted Deming regression, and Passing-Bablok regression following the CLSI guidelines EP09-A3 for analytical method comparison and bias estimation using patient samples [10].
Comparison of LaboStats with EP Evaluator
We used the performance evaluation data of new reagents and analyzers performed at St. Vincent's Hospital, Suwon, Korea, in 2016 to compare the results of LaboStats and EP Evaluator 11.3. The evaluation data of 40 test samples were input into the linearity module, method comparison module, precision module, and reference interval module of both software programs, and the results were compared. We compared the results of the parallel test module and cutoff module for LaboStats with the results obtained manually using the CLSI guidelines EP15-A3 and EP12-A2, respectively [1113]. Regression parameters for method comparison were compared using a paired t-test. P<0.05 was considered statistically significant. The statistical analysis was performed using SPSS v. 13.0 (SPSS Inc.). For the remaining five modules, we examined whether the results of both programs were the same.
RESULTS
Parallel test module
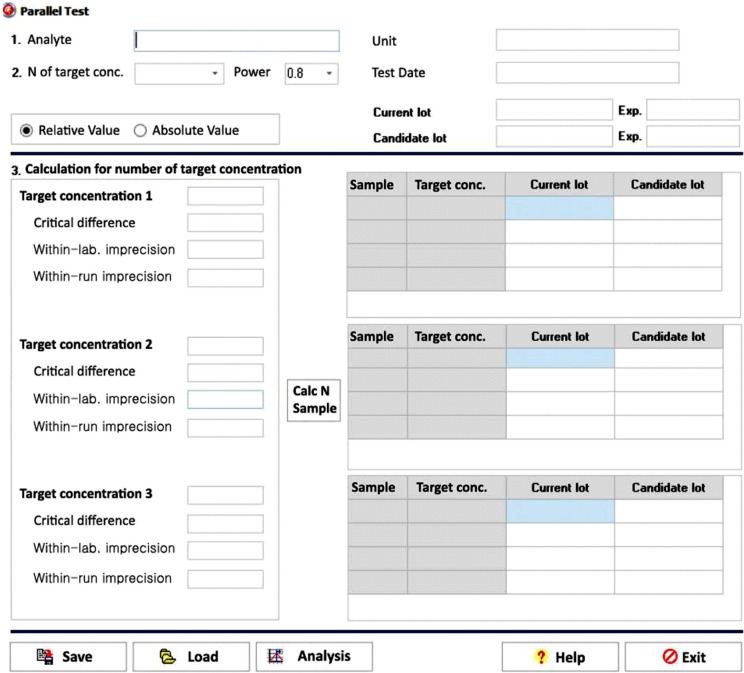
The data entry user interface (UI) of the parallel test module has six required data input fields: number of target concentration, statistical power, target concentration, critical difference, within-laboratory imprecision, and within-run imprecision (Fig. 2). The number of samples calculation button is enabled once the six required fields contain values. Users can choose an appropriate level of statistical power: 80%, 85%, 90%, or 95%. The number of target concentration ranges between one and three. Clicking the calculation button enables the module to calculate the number of samples to be tested within each target concentration. As the ratio of within-run imprecision to within-laboratory imprecision approaches 1.0 and the critical difference increases, the number of samples required for the parallel test decreases. After determining the number of samples, users can input the current lot result and candidate lot result in the test result fields. Clicking the analysis button will then generate a precise report of the parallel test.
Linearity module
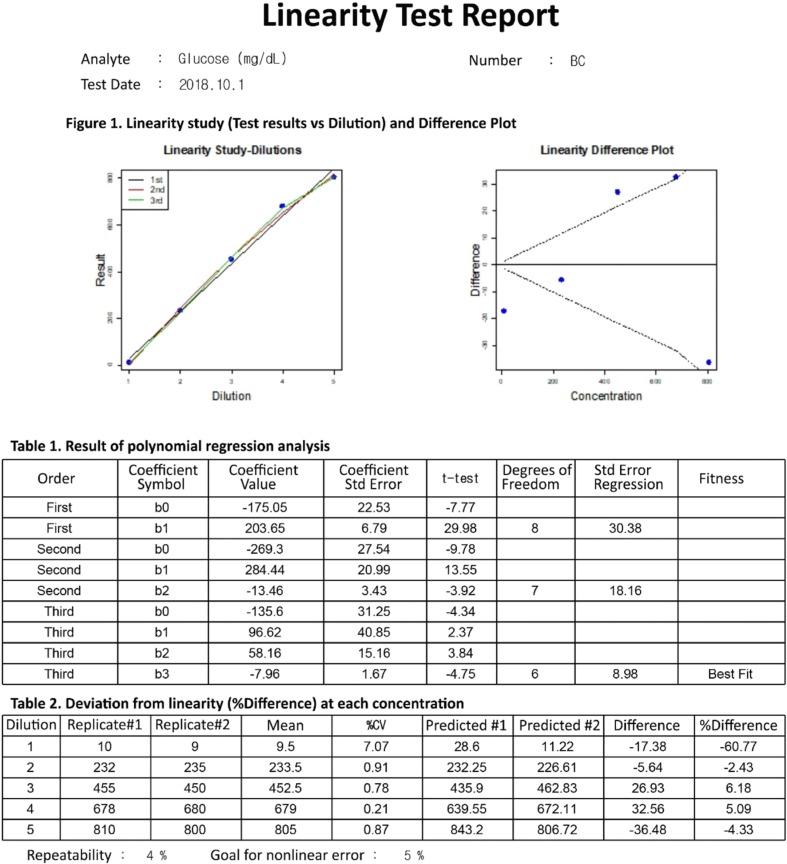
The data entry UI of the linearity module has four required data input fields: number of target concentration, repeatability, goal for nonlinear error, and duplicate results of each diluted sample. Once the four required fields contain values, clicking the analysis button will generate a precise report of the linearity test (Fig. 3). LaboStats, following the CLSI EP06-A [9], performs polynomial regression analysis. Polynomial regression analysis generates first-order, second-order, and third-order polynomials. The best-fitting polynomial can be a first-, second-, or third-order polynomial, which shows the smallest difference between the measured results and the values obtained from the polynomial. Deviation from linearity at each concentration is the difference between the value of the best-fitting polynomial and the value of the first-order polynomial.
Method comparison module
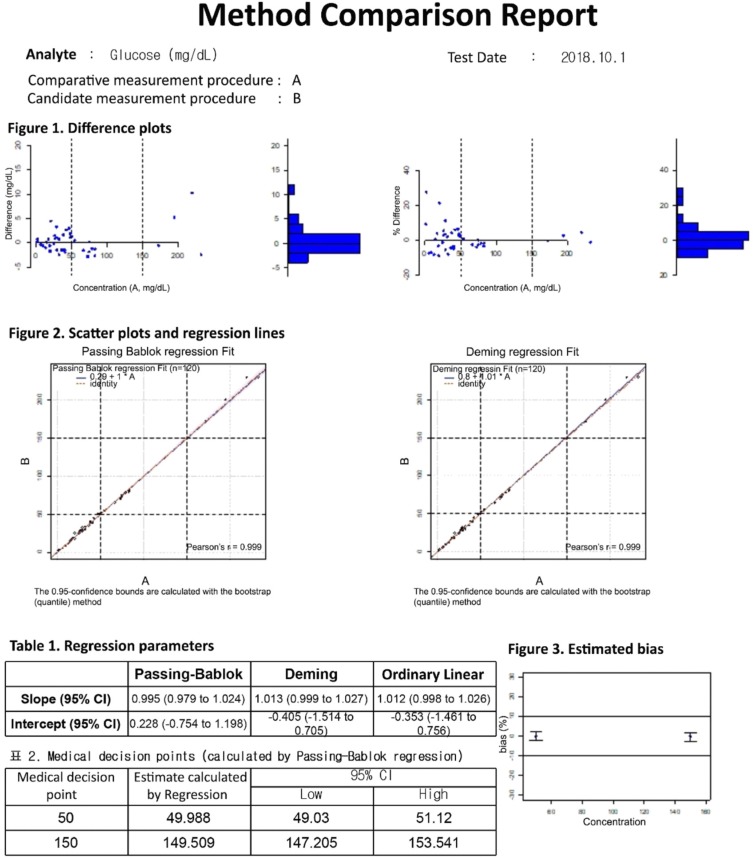
The data entry UI of the method comparison module has four required data input fields: number of samples, acceptable bias, medical decision points, and test results. The test results can be entered into the field either manually or by copying and pasting an Excel worksheet. Once the four required fields contain values, clicking the analysis button will generate a precise report of the method comparison (Fig. 4). LaboStats, following the CLSI EP09-A3 [10], provides difference plots, scatter plots, ordinary linear regression, Deming regression, and Passing-Bablok regression. Estimating bias and its 95% confidence interval (CI) at the medical decision points is obtained using Passing-Bablok regression analysis. If the 95% CI is within the limits of acceptable bias, the performance of the candidate measurement procedure is acceptable.
Precision module
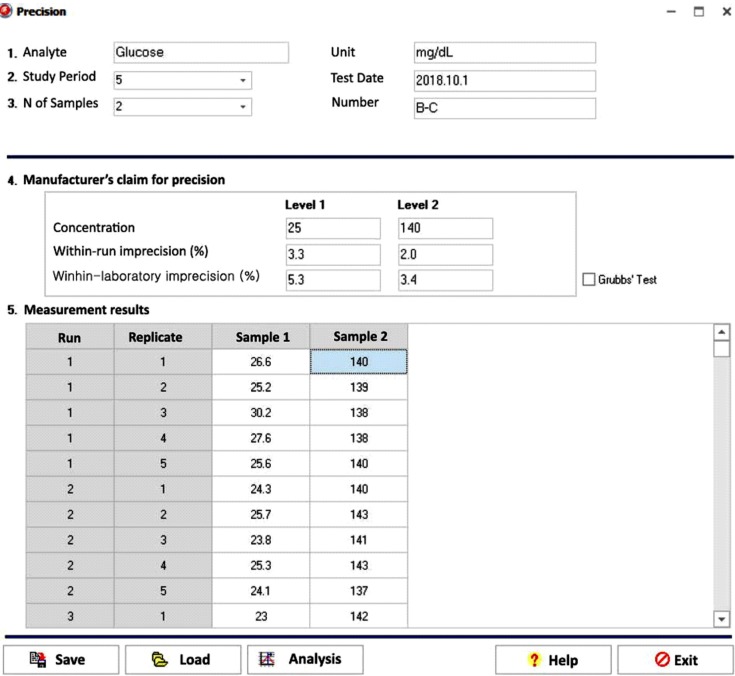
The data entry UI of the precision module has six required data input fields: study period, number of samples, manufacturer's claim for precision (concentration/within-run imprecision/within-laboratory imprecision), and test results (Fig. 5). The CLSI EP15-A3 [11] calls for repeated testing of at least two samples for five or more days. The basic 5×5 design is five days, one run per day, and five replicates per run. One-way ANOVA is the basis for calculating repeatability and within-laboratory imprecision estimates for each sample. Once the six required fields contain values, clicking the analysis button will generate a precise report of the precision. The manufacturer's claim for precision is verified by comparing the precision estimate with the manufacturer's claim.
Reference interval module
LaboStats provides a tool for validating and establishing the reference interval. Validating a reference interval requires the measurement of as few as 20 samples from qualified reference individuals. A minimum sample of 120 reference individuals is recommended for the establishment of the reference interval. The reference interval module performs two general statistical methods: parametric and nonparametric methods.
Cutoff module
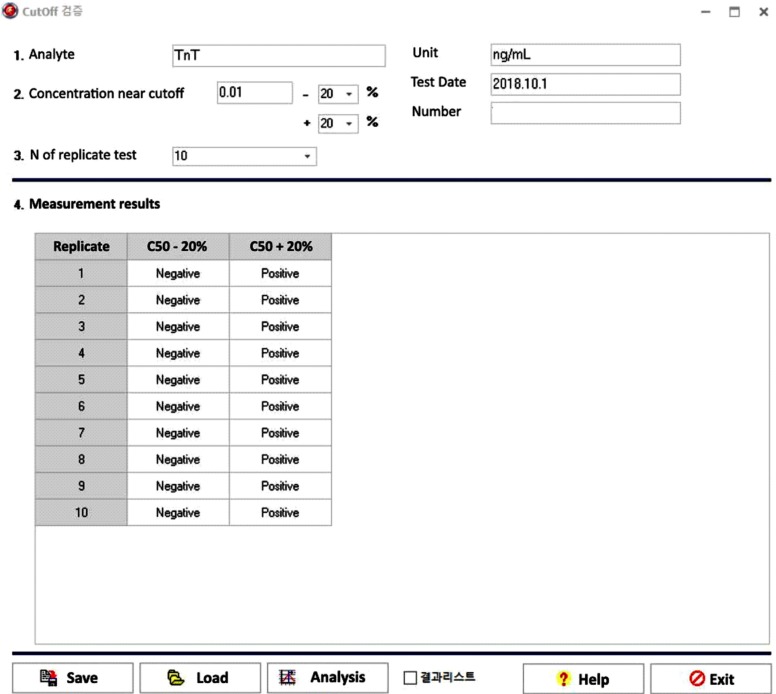
The data entry UI of the cutoff module has five required data input fields: cutoff concentration, concentration % above cutoff, concentration % below cutoff, replicate test number on the same sample, and test results (Fig. 6). Once the five required fields contain values, clicking the analysis button will generate a precise report of the cutoff.
Comparison with EP Evaluator
LaboStats showed the same results as EP Evaluator for linearity, precision, and validation of reference interval. In the case of method comparison, there was no statistically significant difference in regression parameters between LaboStats and EP Evaluator. The parallel test and cutoff results using LaboStats were the same as the results obtained manually.
DISCUSSION
We developed a free, statistical software program for KLAP, using the R Language. LaboStats performs a parallel test for which EP Evaluator and Analyze-it do not provide a statistic module [15]. Reagent lot changes can cause significant shifts in patient results [16]. Evaluating lot change is an important part of clinical laboratory practice. However, lot-to-lot verification can vary widely across clinical laboratories with regard to the number of samples, the type of material, and the criteria used for acceptance [1718]. The number of samples for lot-to-lot verification varies from three to 50 [161819]. Increasing the number of samples tested will increase the statistical power, but it is costly and time-consuming. The CLSI EP26-A is the first guideline providing a simple, practical, and statistically sound protocol to determine the minimum number of samples tested and interpret the results of the parallel test [8]. However, it is time-consuming to perform the parallel test following the instructions of the guideline manually [18]; LaboStats makes it easier.
LaboStats performs a linearity test using polynomial regression analysis following the CLSI EP06-A guidelines [9]. In general, the lack-of-fit (LoF) test has been used to detect nonlinearity [20]. However, the LoF test simply shows whether statistically significant nonlinearity exists and does not show where nonlinear range is or magnitude of the nonlinearity [9]. The CLSI EP06-A, applying polynomial regression, provides a protocol to determine the concentration at which a method is not linear and the extent of the nonlinearity [9]. LaboStats will thus make it easier to perform the linearity test.
LaboStats also makes it easier to evaluate method comparison, precision, reference interval, and cutoff for qualitative tests. In addition, users can print out precise reports with a standardized reporting format. Most laboratories are struggling with document control, a common deficiency cited in the College of American Pathologists Laboratory Accreditation Program inspections [21]. As KLAP checklists require laboratory personnel to maintain many documents on the verification of the performance characteristics of clinical tests, standardized reports using our software may be helpful in reducing laboratory workload.
In conclusion, LaboStats can be useful to evaluate the performance characteristics of clinical tests and prepare documents required by KLAP.
 XML Download