

 PDF
PDF Citation
 Print
Print


BACKGROUND
Among the well-known causes of hearing impairment, including age, noise, genetic factors, toxic drugs, virus infections, and harmful substances [12345], noise affects workers most significantly. In Korea, workplace environmental noise levels above 8-hour time-weighted average of 80 dB are subject to workplace environmental measurement [6] and the legal standard of noise exposure is above 90 dB (A) for 8 hours a day [7]. However, the meta-analysis of environmental noise for the general population showed that noise levels in the living areas of nearby airports, roads, and railways, which are considered to be relatively loud, was rarely above 80 dB [8]. As such, unlike the general population, manufacturing workers are exposed to significant noise levels, which are considered the main cause of hearing impairment among them [4].
Diabetes mellitus (DM) is a common systemic metabolic disease worldwide [9] and diabetic complications are major problems affecting patients' quality of life [1011]. The results of studies on hearing impairment in patients with diabetes have been controversial, some suggesting that diabetes is not related to hearing impairment [121314]; however, several recent studies, including a meta-analysis, have reported significant associations [151617181920]. Therefore, if workers with diabetes are exposed to noise, this may have more negative effect on hearing. However, to our knowledge, there have been few studies on this topic.
Individuals with diabetes among workers exposed to noise require special care and management. Classification of several factors affecting hearing, such as workplace noise level, age, etc., according to fasting glucose level over several years may reveal the effects of diabetes on hearing impairment. To assess the relationship between hearing impairment and diabetes among workers exposed to noise, we think that longitudinal data analysis is necessary. Also, since noise and age are powerful influencing factors for hearing impairment, follow-up of the same individuals is necessary in order to control for variations in these factors. With this research design, we can determine the effect of hearing impairment due to diabetes, which has a relatively small effect. Therefore, we analyzed the effect of diabetes on hearing impairment in workers exposed to similar noise levels from 2013 to 2017 with little change in their working conditions, longitudinally.
METHODS
Study population
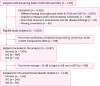
The study subjects were male workers at a single company who underwent health examinations at the same hospital in Ulsan city in both 2013 and 2017. Of 7,173 individuals with screening data in 2013 and 2017, we excluded 2,970 workers whose status of fasting blood glucose group changed between 2013 and 2017. A total of 4,203 subjects were categorized into 3 groups such as normal, impaired fasting glucose (IFG), and DM group by fasting glucose level and subjects of each group in 2013 remained in the same group in 2017.
Among them, we excluded 1,221 workers for a lack of data on the noise level in their work environments, 95 workers with abnormal otoscopic examination findings or history of ear diseases, 64 workers with missing data for on examination results. Of 2,823 eligible study subjects, we excluded 736 workers whose pure-tone audiometry (PTA) threshold improved by more than 10 dB in 2017 compared to that in 2013. Without abnormal otoscopic examination findings or history of ear diseases, PTA threshold of workers would worsen as time goes on. Based on our result, the observed changes of hearing thresholds between 2013 and 2017 did not exceed 10 dB, so we considered that PTA thresholds improved more than 10 dB were considered as a type of pure-tone audiometric testing error. Thus, a total of 2,087 subjects were eventually included. According to their fasting glucose levels, the analysis included 1,474 subjects in the normal group, 497 in the IFG group, and 116 in the DM group. Furthermore, we selected 1,545 normal hearing subjects (pure-tone average ≤ 25 dB) in both ears in 2013 and we analyzed them by using the Cox proportional hazards models for hearing impairment subjects (pure-tone average > 25 dB) in both ears in 2017 (Fig. 1).
Data collection
Data from health examinations performed in 2013 and 2017 were collected. Age; working period; systolic and diastolic blood pressures; serum levels of total cholesterol, triglycerides, and creatinine; smoking status; alcohol consumption; and fasting blood glucose level were obtained from the data. The hearing evaluation included measurements of PTA thresholds at frequencies of 1,000, 2,000, 3,000, and 4,000 Hz in both ears, otoscopic examinations, and history taking of ear diseases in 2013 and 2017. We calculated the pure-tone average of PTA thresholds at 1,000, 2,000, 3,000, and 4,000 Hz ( ) and defined pure-tone average > 25 dB as hearing impairment and ≤ 25 dB as normal hearing [21]. Fasting blood samples were collected after at least 8 hours of fasting. Subjects with fasting blood glucose below 100 mg/dL were defined as the normal group, while subjects with fasting blood glucose between 100 and 125 mg/dL were defined as the IFG group. Subjects with fasting blood glucose over 125 mg/dL and those taking anti-diabetic medications and with a self-reported history of diabetes were defined as the DM group [1518]. Blood pressure was analyzed as a continuous variable by calculating the mean arterial pressure (
 ) which reflects the average effective pressure [22]. Smoking history was classified as smokers or non-smokers, in which smokers were defined as those participants who had smoked more than 100 cigarettes and those who currently smoked cigarettes [23]. Drinking history was classified as high-risk alcohol intake or non-alcohol intake, in which high-risk alcohol intake was defined as a minimum of 7 shots on average in 1 seating with a minimum of 2 drinking sessions per week for men [23].
) and defined pure-tone average > 25 dB as hearing impairment and ≤ 25 dB as normal hearing [21]. Fasting blood samples were collected after at least 8 hours of fasting. Subjects with fasting blood glucose below 100 mg/dL were defined as the normal group, while subjects with fasting blood glucose between 100 and 125 mg/dL were defined as the IFG group. Subjects with fasting blood glucose over 125 mg/dL and those taking anti-diabetic medications and with a self-reported history of diabetes were defined as the DM group [1518]. Blood pressure was analyzed as a continuous variable by calculating the mean arterial pressure () which reflects the average effective pressure [22]. Smoking history was classified as smokers or non-smokers, in which smokers were defined as those participants who had smoked more than 100 cigarettes and those who currently smoked cigarettes [23]. Drinking history was classified as high-risk alcohol intake or non-alcohol intake, in which high-risk alcohol intake was defined as a minimum of 7 shots on average in 1 seating with a minimum of 2 drinking sessions per week for men [23].Audiometric measurements and evaluation of noise levels
Pure-tone audiometric testing was performed in 2013 and 2017 by trained audiometric technicians in sound-attenuating booths in accordance with the Korea Occupational Safety and Health Agency standards using AC40 (Interacoustics Co., Middelfart, Denmark) and HARP BASIC (Inventis Co., Padova, Italy) audiometers equipped with TDH-39P supra-aural earphones (Telephonics Co., New York, NY, USA) with sound calibration performed annually.
The workplace environmental noise levels were evaluated with a noise dosimeter for a maximum of 20 persons in the same work department, including at least 2 of the highest-exposed workers per workplace unit. The noise dosimeter was attached to the ear and the sound equivalent levels were measured using it with A-frequency weighting. We calculated the workplace noise levels as the average of the noise measurements of the selected workers in each unit workplace.
Statistical analysis
To analyze the variables according to the fasting blood glucose groups in 2013, ANOVA was performed for age; working period; noise level; mean arterial pressure; fasting blood glucose; and levels of total cholesterol, triglyceride, and serum creatinine. The χ2 tests were performed to compare the work environmental noise levels (≤ 79.9 dB, 80.0–84.9 dB, and ≥ 85.0 dB), working period (≤ 14.9, 15.0–29.9, or ≥ 30.0 years), smoking, and high-risk alcohol intake among the normal, IFG, and DM groups. The PTA thresholds in 2013 and 2017 and the changes in these thresholds between 2013 and 2017 were analyzed by ANOVA. Post-hoc comparison was performed using Bonferroni's method. Cox proportional hazards models were used to adjust the factors affecting hearing changes among normal hearing subjects (pure-tone average ≤ 25 dB) in 2013 with hearing impairment (pure-tone average > 25 dB) in 2017. Model 1 was adjusted for age and working period; model 2 was further adjusted for noise level; and model 3 was further adjusted for MAP and levels of total cholesterol, triglycerides, and serum creatinine, smoking, and high-risk alcohol intake. We used the covariates of 2013 in 3 models. IBM SPSS Statistics for Windows, version 21.0 (IBM Corp., Armonk, NY, USA) was used for the analysis and p-values lower than 0.05 were considered to indicate a statistical significance.
RESULTS
Table 1 shows general characteristics of the study subjects according to the fasting blood glucose groups in 2013. The 2,087 total subjects were classified into 3 groups according to fasting blood glucose level, with 1,474 (70.6%) in the normal group, 497 (23.8%) in the IFG group, and 116 (5.6%) in the DM group. Age; working period; noise level; MAP, and fasting blood glucose, total cholesterol, triglyceride, serum creatinine levels differed significantly among the 3 groups. In particular, age, working period, and fasting blood glucose levels were highest in the DM group, followed by the IFG and normal groups. The noise level in the work environment was higher in the normal group than the DM group after post-hoc comparison. After categorizing the workplace noise levels (≤ 79.9 dB, 80.0–84.9 dB, and ≥ 85.0 dB), the proportion of noise levels 80.0–84.9 dB was high in the normal and IFG groups, while levels ≤ 79.9 dB were high in the DM group. However, the differences among 3 groups were not significant. When the working period was classified as ≤ 14.9, 15.0–29.9, or ≥ 30.0 years, significantly higher proportion was observed for ≤ 14.9 years in the normal group and 15.0–29.9 years in the IFG and DM groups. The proportion of current smoker in normal group was highest and lowest in DM group, whereas high-risk alcohol intake did not differ significantly among the 3 groups.
Table 1
General characteristics of study subjects according to fasting blood glucose groups in 2013
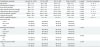
Table 2 shows the average PTA thresholds in 2013 and 2017 and their average changes between both years for 1,000, 2,000, 3,000, and 4,000 Hz in both ears on individual subjects according to the same fasting glucose groups. The average PTA thresholds in the left and right ears in 2017 were higher than those in 2013 in all 3 fasting blood glucose groups. The average changes in PTA thresholds between the 2 years on individual subjects were largest in the DM group, followed by the IFG and normal groups. Post-hoc comparison analysis showed that average PTA thresholds in each year and the average changes in these pure thresholds between both years on individual subjects were significantly greater in the DM group than those in the normal group.
Table 2
Pure-tone audiometry thresholds changes on individual subjects according to the same fasting glucose groups in 2013 and 2017
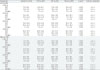
Table 3 shows the results of Cox proportional hazards models for hearing impairment (pure-tone average > 25 dB) in 2017 after adjusting for covariates affecting hearing impairment in each fasting glucose group. To analyze 4-year changes for the events of hearing impairment (pure-tone average > 25 dB) in 2017, covariates of 2013 were used in the analysis. In the left ear, among 1,145 normal hearing subjects in the normal group in 2013, 32 experienced hearing impairment in 2017. Similarly, 19 out of 341 in the IFG group and 10 out of 59 in the DM group experienced hearing impairment. In the right ear, 17 out of 1,145, 10 out of 341, and 6 out of 59 subjects in the normal, IFG, and DM groups, respectively, had experienced hearing impairment. In the left ear, the adjusted hazard ratios (HRs) for incident hearing impairment for subjects in the DM group were 2.76 (95% confidence interval [CI], 1.33–5.72) in model 1, 2.80 (95% CI, 1.35–5.80) in model 2, and 3.35 (95% CI, 1.54–7.29) in model 3 when normal group was reference. In the right ear, those were 3.19 (95% CI, 1.23–8.29), 3.24 (95% CI, 1.25–8.41), and 5.66 (95% CI, 2.01–15.98), respectively. All adjusted HRs in the DM group were statistically significant. In all models, the HRs for incident hearing impairment for subjects in the DM group was higher than those in the IFG group.
Table 3
Adjusted HRs of hearing impairment by pure-tone average compared to normal fasting glucose group
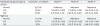
Data are shown as HR (95% confidence interval).
IFG: impaired fasting glucose; DM: diabetes mellitus; HR: hazard ratio.
*Model 1, adjusted for age, working period; †Model 2, further adjusted for noise level; ‡Model 3, further adjusted for mean arterial pressure, total cholesterol, triglyceride, serum creatinine, smoking, high-risk alcohol intake.
DISCUSSION
In this study, we investigated the effect of diabetes on hearing impairment in workers exposed to similar noise levels with little change in their working conditions during the 4-year follow-up period. PTA thresholds according to fasting blood glucose groups were higher in all frequencies in 2013 and 2017 in the order of the DM, IFG, and normal groups in both ears. The average PTA thresholds of the DM group were significantly higher than those of the normal group. The average changes in PTA thresholds on individual subjects during the study were also statistically significantly higher in the DM group than those in the normal group. In the Cox proportional hazards analysis, which calculated the HRs after adjusting for various covariates affecting hearing, in which a pure-tone average > 25 dB was defined as hearing impairment, the HRs of the DM group were significantly higher compared to those in the normal group (2.76–3.35 in the left ears and 3.19–5.66 in the right ears). The HRs in the present study were higher than those of other studies [1215], this is estimated to be due to the calculation of pure-tone average including the pure-tone threshold at 4,000 Hz. Our results indicate that diabetes affect hearing impairment based on the average changes in PTA thresholds between 2013 and 2017 and the higher HRs from 2013 to 2017 in the DM group compared to the normal group despite similar noise exposure levels.
Few studies have assessed the association between diabetes and PTA thresholds among subjects exposed to high noise levels. We identified an association between diabetes and changes in PTA thresholds at 1,000, 2,000, 3,000, and 4,000 Hz. Recent studies have reported that diabetes has significant associations with hearing impairment. In a cohort study between 2002 and 2014 that defined incident hearing loss as a pure-tone average of thresholds at 0.5, 1.0 and 2.0 kHz > 25 dB in both right and left ears, Kim et al. [15] reported multivariable-adjusted HRs of subjects with pre-diabetes and diabetes of 1.04 (95% CI, 0.95–1.14) and 1.36 (95% CI, 1.19–1.56), respectively. In the cross-sectional Busselton Health Ageing Survey by Sommer et al. [24], which defined hearing loss as the 4-frequency average (4FA) of pure-tone thresholds at 500, 1,000, 2,000, and 4,000 Hz and the high-frequency average of pure-tone thresholds at 4,000 and 8,000 Hz > 25 dB in the better ear, the prevalence of 4FA hearing loss increased from 2.3% (95% CI, 1.5–3.4) in participants with normoglycemia to 5.7% (95% CI, 3.0–10.6) in those with prediabetes and 10.2% (4.2–21.5) in those with diabetes among 1,286 participants aged < 60 years. In multivariable analysis with normoglycemia as the reference, the odds ratios (ORs) for 4FA hearing loss were 2.84 (95% CI, 1.29–6.27) for prediabetes and 5.93 (95% CI, 1.67–21.05) for diabetes in the < 60-year age group [24]. In contrast to prior studies, some studies have reported a weak association between diabetes and hearing loss. In a cross-sectional study, Samelli et al. [12] defined hearing loss as average low-middle range frequencies at 250, 500, 1,000 and 2,000 Hz, and high range frequencies at 3,000, 4,000, 6,000, and 8,000 Hz > 25 dB, reporting ORs of participants with diabetes after adjusting for covariates of 1.03 (95% CI, 0.56–1.92) at low-middle range frequencies and 1.18 (95% CI, 0.78–1.78) at high range frequencies. In addition, there were no significant differences when the ORs were analyzed for each frequency. In a cross-sectional study of cardiovascular risk factors and hearing loss, Engdahl et al. [13] found a weak positive association with diabetes in multivariate regression analysis when they calculated pure-tone average thresholds of low (0.25 and 0.5 kHz), middle (1 and 2 kHz), and high (3, 6, and 8 kHz) after excluding the cardiovascular risk factors presented in this study. In addition, multivariate regression analysis including the cardiovascular risk factors revealed no significant association with diabetes. Among other major factors that affect hearing, triglyceride has been associated with a higher risk of noise-induced hearing loss among subjects with hypertriglyceridemia [2526], hypertension is associated with hearing loss [2728], and serum creatinine was used as an indicator of the degree and management of DM in relation to microvascular diseases [29].
Several studies have proposed hypotheses regarding the mechanism of hearing loss caused by diabetes. These are cochlear injury due to microangiopathy [303132], damage to the auditory nerve caused by diabetic peripheral neuropathy [3334] and mitochondrial damage caused by diabetes [353637]. Also, mechanism of noise-induced hearing loss is that the noise causes mechanical and metabolic damage to the internal structure of the cochlea, which causes cell death in the cochlea, apoptosis through the metabolic damage process culminating in the accumulation of reactive oxygen species due to oxidative stress, cochlear ischemia followed by reperfusion injury, and excitotoxicity to the auditory neuron induced by the excessive release of glutamate, the cochlear afferent neurotransmitter [38]. In general, the first signs of the effects of noise on hearing begin as a dip or notch at 3,000–6,000 Hz in audiograms, leading to gradual deterioration at the high frequencies due to increased noise exposure [3940]. Genetic and complicating factors, including diabetes, are more likely to cause hearing loss at both high and low frequencies [41]. In conclusion, diabetes alone is likely to cause hearing loss, which is worsened if both diabetes and noise exposure is present.
This study has several strengths. First, this is a large-scale study including 2,087 subjects who were similarly exposed to high noise levels and who had little change in working conditions. Also, we performed a longitudinal analysis of subjects with the same fasting blood glucose levels during a 4-year study period. Second, in analyzing the HR of the DM group compared to that of the normal group, we could adjust and evaluate many factors through various models to confirm similar tendencies. Finally, the observation that diabetes can contribute more to hearing impairment among workers exposed to high noise levels in our study may impact the hearing management of diabetic patients.
This study also has some limitations. As a limitation inherent to the cross-sectional design, we considered noise exposure in the work environment but it was difficult to determine the actual noise exposure time and noise characteristics of individual people and only the average noise level was considered in each department. In addition, the data on high frequencies including 6,000 and 8,000 Hz were insufficient in the health examination data; thus, the effect of high-frequency noise could not be analyzed. Lastly, there was a possibility of misclassification error due to a lack of information on the duration of diabetes and actual diabetes management of individuals.
CONCLUSIONS
This study investigated the effect of diabetes on hearing impairment in occupational noise exposed workers without changes in working conditions including noise level. We found that the HRs of hearing impairment (pure-tone average > 25 dB) was higher in the DM group than those in the normal group and IFG group for both ears during the 4-year follow-up period after adjusting covariates. These findings indicate the need for special care and precautions in the hearing management of workers with diabetes exposed to noise.
 XML Download