

 PDF
PDF ePub
ePub Citation
 Print
Print


Introduction
Materials and Methods
Chemicals and drugs
Animals
Experimental design
Induction of DM
Animal treatment
Experimental evaluation
Histological assessment of fetal kidneys
Light microscopic assessment
Morphometric assessment
Electron microscopic assessment
Statistical analysis
Ethical consideration
Results
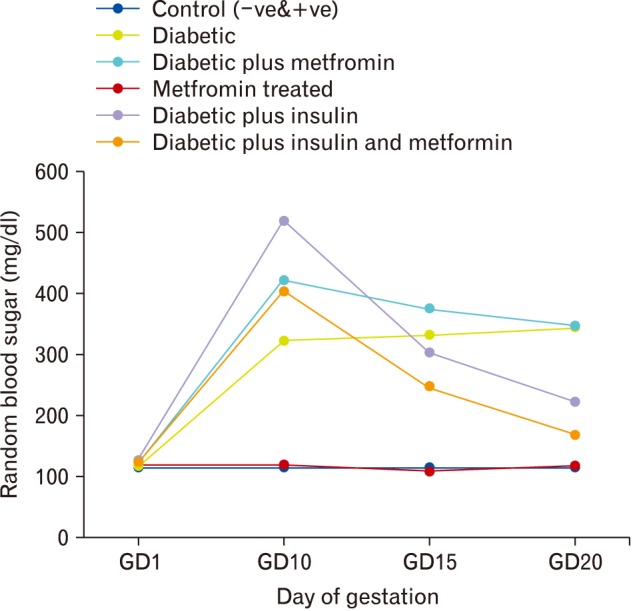
Random blood sugar level
Embryolethality
Table 1
Frequency of embryolethality in studied groups
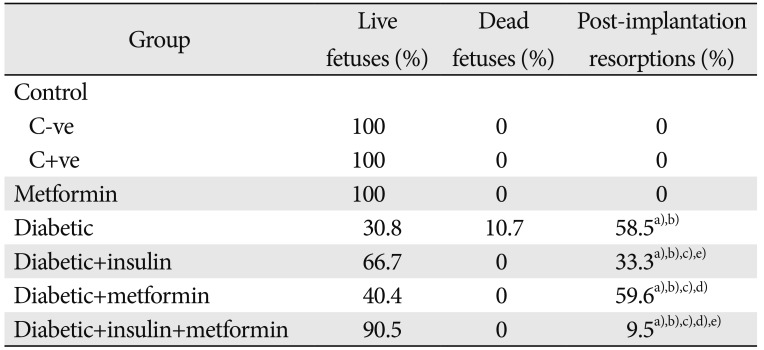
Chi-square test. C+ve, positive control; C−ve, negative control. a)P<0.05 compared to control groups. b)P<0.05 compared to Metformin treated group. c)P<0.05 compared to diabetic group. d)P<0.05 compared to diabetic plus insulin treated group. e)P<0.05 compared to diabetic plus metformin treated group.
![]()
Foetal body and placental weights
Table 2
Changes in fetal body and placental weights in all studied groups
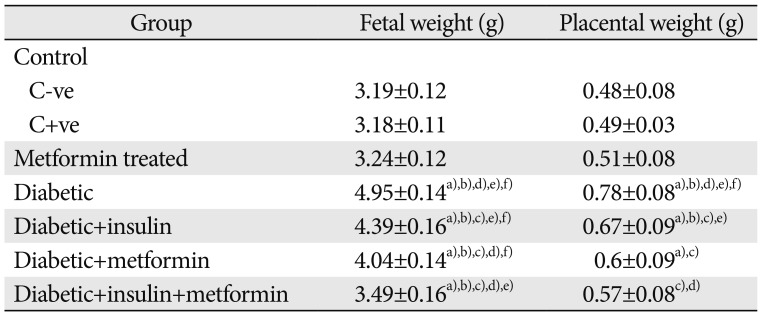
Values are presented as mean±SD. ANOVA post hoc test. C+ve, positive control; C−ve, negative control. a)P<0.05 compared to control groups. b)P<0.05 compared to metformin treated group. c)P<0.05 compared to diabetic group. d)P<0.05 compared to diabetic plus insulin treated group. e)P<0.05 compared to diabetic plus metformin treated group. f)P<0.05 compared to diabetic plus insulin and metformin treated group.
![]()
Gross morphological results of fetal kidneys
Table 3
Length and width of fetal kidneys in all studied groups
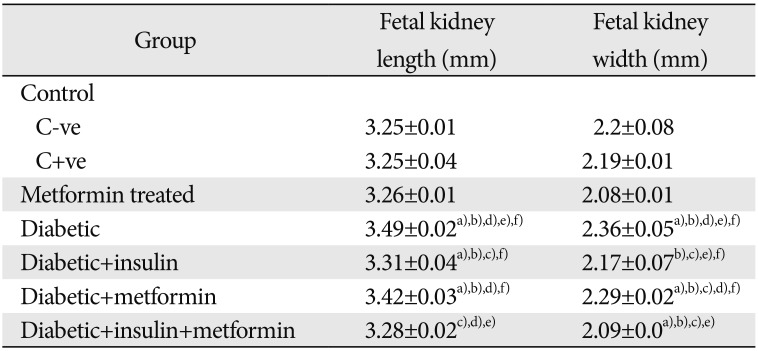
Values are presented as mean±SD. ANOVA post hoc test. C+ve, positive control; C−ve, negative control. a)P<0.05 compared to control groups. b)P<0.05 compared to metformin treated group. c)P<0.05 compared to diabetic group. d)P<0.05 compared to diabetic plus insulin treated group. e)P<0.05 compared to diabetic plus metformin treated group. f)P<0.05 compared to diabetic plus insulin and metformin treated group.
![]()
Morphometric results of foetal kidneys
Table 4
Morphometric parameters of fetal kidneys
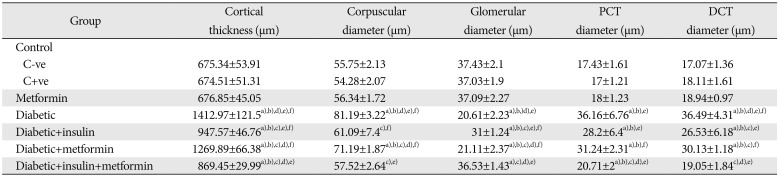
Values are presented as mean±SD. ANOVA post hoc test. PCT, proximal convoluted tubule; DCT, distal convoluted tubule; C+ve, positive control; C−ve, negative control. a)P<0.05 compared to control groups. b)P<0.05 compared to metformin treated group. c)P<0.05 compared to diabetic group. d)P<0.05 compared to diabetic plus insulin treated group. e)P<0.05 compared to diabetic plus metformin treated group. f)P<0.05 compared to diabetic plus insulin and metformin treated group.
![]()
Glomerular maturation
Table 5
Number of immature and mature glomeruli in the studied groups
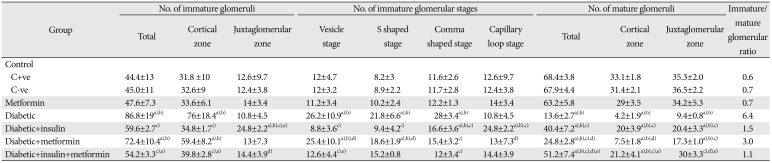
Values are presented as mean±SD. ANOVA post hoc test. C+ve, positive control; C−ve, negative control. a)P<0.05 compared to control groups. b)P<0.05 compared to Metformin treated group. c)P<0.05 compared to diabetic group. d)P<0.05 compared to diabetic plus insulin treated group. e)P<0.05 compared to diabetic plus metformin treated group.
![]()
Histopathological results
Control group
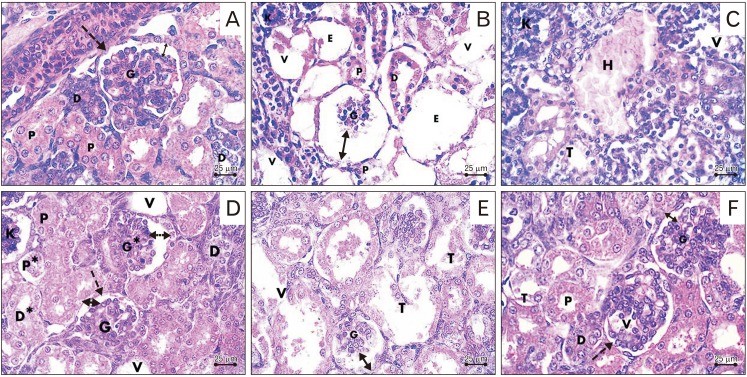 | Fig. 2Photomicrographs sections in the fetal kidney. (A) Control group showing the renal corpuscle with the parietal layer of Bowman's capsule (dashed arrow), mature glomerulus (G) and preserved corpuscular space (double head arrow), proximal (P) and distal (D) convoluted tubules. (B, C) Diabetic group showing shrunken glomerulus (G), increased renal corpuscular space (double head arrow), vacuolations (V), empty renal corpuscles (E), degenerated dilated tubules (T), shedding of brush border of proximal tubules (P), degenerated epithelium of distal tubule (D), hemorrhage (H) and pyknotic nuclei (K). (D) Diabetic plus insulin-treated group showing intact mature glomeruli (G) surrounded by Bowman's capsule (dashed arrow) with preserved corpuscular space (double head arrow), intact proximal (P) and distal tubules (D). Notice the presence of mildly shrunken glomerulus (G*), pyknotic nuclei (K), increased corpuscular space (double head dashed arrow), degenerated proximal (P*) and distal convoluted tubules (D*) and areas of vacuolation (V). (E) Diabetic plus metformin-treated group showing shrunken mature glomerulus (G), increased renal corpuscular space (double head arrow), dilated and destructed renal tubules (T), and vacuolation (V). (F) Diabetic plus insulin and metformin-treated group showing intact glomeruli (G), Bowman's capsule (dashed arrow), and preserved corpuscular space (double head arrow), intact proximal (P) and distal (D) convoluted tubules. Notice the presence of areas of vacuolation in the glomerulus (V) and tubules (T) (H&E staining, ×400).
|
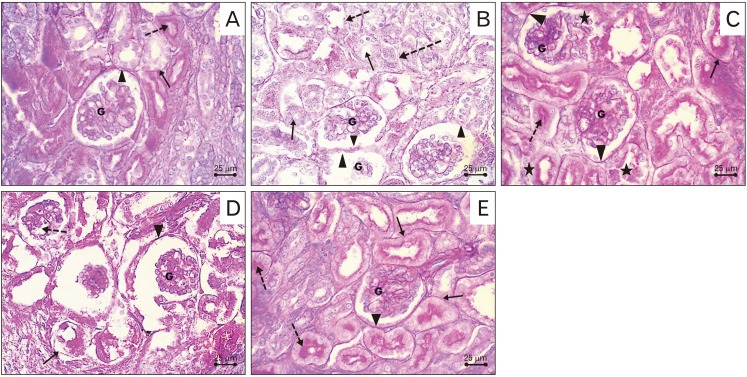 | Fig. 3Periodic acid-Schiff stained sections in the fetal kidney. (A) Control group showing positive stain in the glomeruli (G), Bowman's capsule (arrowhead), basement membrane of renal tubules (arrow) and the brush border of proximal tubules (dashed arrow). (B) Diabetic group showing faint reaction in glomeruli (G), Bowman's capsules (arrowheads), basement membrane (dashed arrows) and brush border of the proximal convoluted tubules (arrows). (C) Diabetic plus insulin treated group showing positive reaction in the glomeruli (G), Bowman's capsule (arrowheads), basement membrane of renal tubules (arrow) and the brush border of proximal tubules (dashed arrow). Notice the presence of areas of negative reaction (stars). (D) Diabetic plus metformin treated group showing areas of faint reaction in the tubular basement membrane (arrow) and glomerulus (dashed arrow) with the presence of positive reaction in other glomerulus (G) and Bowman's capsule (arrowhead). (E) Diabetic plus insulin and metformin treated group showing positive reaction in the glomerulus (G), Bowman's capsule (arrowhead), basement membrane of renal tubules (arrows) and the brush border of proximal tubules (dashed arrows) (periodic acid-Schiff, ×400).
|
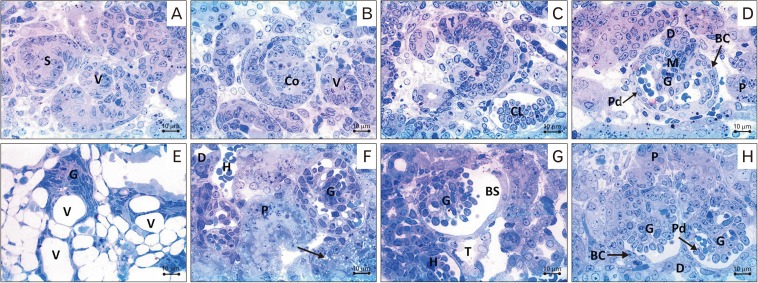 | Fig. 4Photomicrographs of Toluidine blue stained sections in the fetal kidney. (A–C) Control group showing vesicle (V), S-shaped (S), commashaped (Co), and capillary loop (CL) stages of glomerular development. (D) Control group showing mature glomerulus (G) with the parietal layer of Bowman's capsule (BC), podocyte (Pd), mesangial cells (M), proximal convoluted tubules (P) and distal (D) convoluted tubules. (E) Diabetic group showing, loss in the normal architecture of the cortex, immature glomerulus (vesicular stage) (G) and marked vacuolations (V) within the glomerulus and tubules. (F) Diabetic plus insulin-treated group showing intact mature glomerulus (G), proximal (P) and distal (D) convoluted tubules. Notice small area of hemorrhage (H) and vacuolation (arrow). (G) Diabetic plus metformin-treated group showing shrunken glomerulus (G), wide Bowman's space (BS), and areas of hemorrhage (H). Notice degenerated tubules (T). (H) Diabetic plus insulin and metformin-treated group showing intact mature renal glomerulus (G), Bowman's capsule (BC), podocyte (Pd), proximal (P) and distal (D) convoluted tubules (toluidine blue, ×1,000).
|
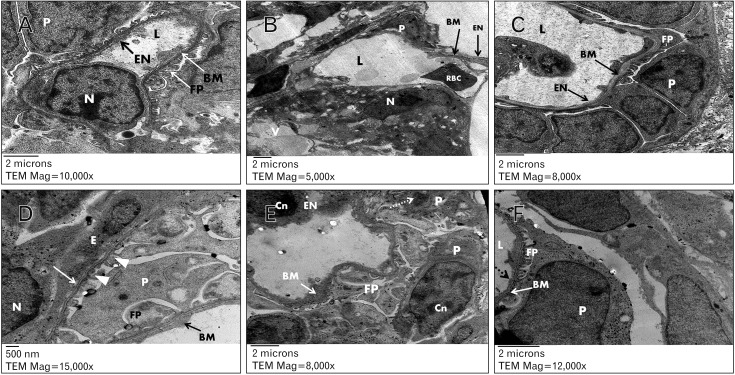 | Fig. 5Electron photomicrographs in fetal rat glomerulus. (A) Control group showing glomerular capillary lumen (L) lined with endothelial cell with euchromatic nucleus (N) and forming a thin fenestrated layer of cytoplasm (EN) lining the basement membrane (BM) internally. The capillary surrounded with intact podocyte (P) with foot processes (FP). Uranyl acetate and lead citrate (×10,000). (B) Diabetic group showing glomerular capillary lumen (L) with thinned glomerular filtration barrier (BM) and red blood cell (RBC), absence of fenestrations of endothelial layer (EN), vacuolations (V), podocytes with loss of foot processes (P) and chromatin clumping (N). Uranyl acetate and lead citrate, ×5,000. (C) Diabetic group showing glomerular capillary lumen (L) with a thickened glomerular basement membrane (BM) and area of absence of EN and surrounded by podocyte (P) with short foot process effacement and widening (FP). Uranyl acetated and lead citrate, ×8,000. (D) Diabetic plus insulin-treated group showing capillary endothelial cell (E) with euchromatic nucleus (N), podocyte (P) with intact foot processes (arrowheads) and homogeneous glomerular basement membrane with normal thickness (white arrow). Other areas of thickened glomerular basement membrane (BM) and marked widening and effacement of foot processes (FP). Uranyl acetate and lead citrate, ×15,000. (E) Diabetic plus metformin-treated group showing area of thick glomerular basement membrane (BM) and chromatin condensation (Cn) in nuclei of capillary endothelial cell (EN) and podocytes (P). Notice the presence of ill-defined nuclear envelop (dashed arrow) and foot process with effacement and widening (FP). Uranyl acetate and lead citrate, ×8,000. (F) diabetic plus insulin and metformin-treated group showing glomerular capillary lumen (L), intact glomerular basement membrane (BM), podocytes (P) with narrow and short foot processes (FP), thin layer of cytoplasmic endothelium with characteristic interruptions (dashed arrow). Uranyl acetate and lead citrate, ×12,000.
|
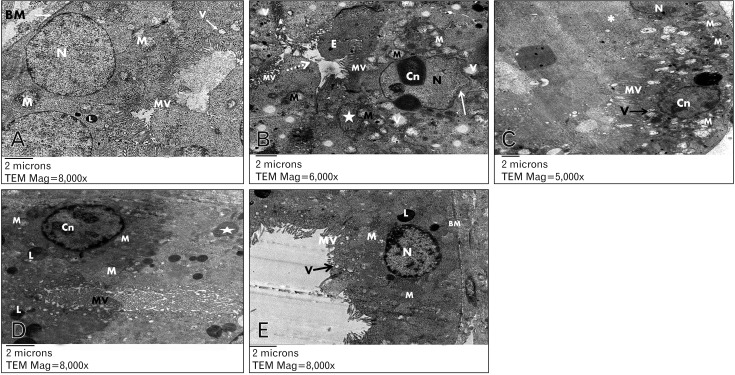 | Fig. 6Electron photomicrographs in the proximal convoluted tubule epithelial cells of fetal rat kidney. (A) Control group showing basal euochromatic nucleus (N), apical brush border with closely packed microvilli (MV), pinocytic vesicles (V), lysosome (L), plenty of mitochondria (M) and basement membrane (BM). Uranyl acetate and lead citrate, ×8,000. (B) Diabetic group showing irregular shaped nucleus (N), ill-defined and irregular nuclear envelope (white arrow), chromatin condensation (Cn), apical sticky and profoundly thin microvilli (MV) with areas of total loss of brush border (dashed arrow), swollen mitochondria with disruption of cristae (M) and apoptotic body (star). Notice presence of pinocytotic vesicles (V), and the lumen filled with exudate (E). Uranyl acetate and lead citrate, ×6,000. (C) Diabetic plus insulin treated group showing closely packed apical long microvilli (MV), euochromatic nucleus (N) and plenty of mitochondria (M). Notice the presence of areas with microvilli loss (*), vesicles (V), and nucleus with chromatin condensation (Cn). Uranyl acetate and lead citrate, ×5,000. (D) Diabetic plus metformin treated group showing plenty of lysosomes (L), edematous mitochondria (M), nucleus with chromatin condensation (Cn), apoptotic body (star) and apical profoundly thin and sloughed microvilli (MV). Uranyl acetate and lead citrate, ×8,000. (E) Diabetic plus insulin and metformin-treated group showing closely packed apical microvilli (MV), pinocytic vesicles (V), lysosomes (L), euchromatic nucleus (N), plenty of mitochondria (M) and intact basement membrane (BM). Uranyl acetate and lead citrate, ×8,000.
|
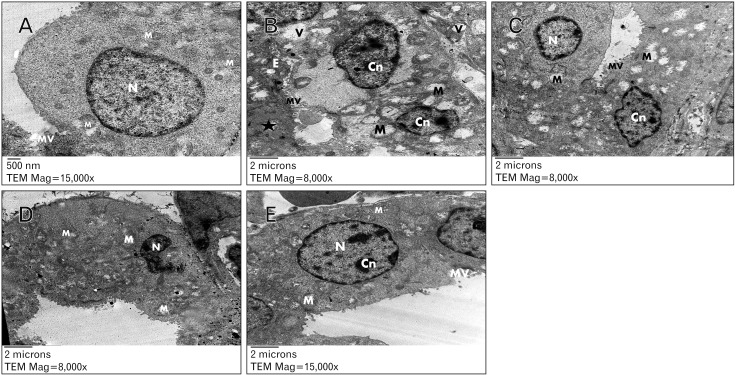 | Fig. 7Electron photomicrographs in the distal convoluted tubule epithelial cells of fetal rat kidney. (A) Control group showing with blunt microvilli (MV), rounded euchromatic nucleus (N) and plenty of mitochondria (M). Uranyl acetate and lead citrate, ×15,000. (B) Diabetic group showing lumen obliteration with exudate (E), few microvilli (MV), swollen and disrupted mitochondria (M), pinocytotic vesicles (V), apoptotic body (star) and nuclei with chromatin condensation (Cn). Uranyl acetate and lead citrate, ×8,000. (C) Diabetic plus insulin-treated group showing short apical microvilli (MV), euchromatic nucleus (N) while other nucleus showed chromatin condensation (Cn), swollen and disrupted mitochondria (M). Uranyl acetate and lead citrate, ×8,000. (D) Diabetic plus metformin-treated group showing ill-defined cell boundaries, swollen mitochondria (M) and destructed and ruptured nucleus (N). Uranyl acetate and lead citrate, ×8,000. (E) Diabetic plus insulin and metformin-treated group showing small microvilli (MV), euchromatic rounded nucleus (N) with chromatin condensation (Cn) and intact mitochondria (M). Uranyl acetate and lead citrate, ×8,000.
|
 XML Download