

 PDF
PDF ePub
ePub Citation
 Print
Print


Introduction
American Diabetes Association (2014) categories diabetes mellitus (DM) into two types: type 1 DM or insulin dependent diabetes mellitus and type 2 DM or insulin non-dependent DM [1]. While type 1 DM happens for the absolute deficiency of insulin secretion, type 2 DM occurs due to the combination of resistance to insulin action and inadequate compensatory insulin secretory response [2]. Type 2 DM is believed to cause more than 80% diabetes and this occurrence keeps happening along with the changes of habits and the increase of body mass index [3]. In fact, the prevalence of type 2 DM is right now drastically rising not only in developing countries like Indonesia, but also in developed nations. Accumulatively calculated, there is approximately at least 100 DM sufferers worldwide [4].
DM is a complex and progressive metabolic disease accompanied by various complications. A continuous hyperglycemia can trigger microvascular and macrovascular complications. A microvascular complication acts as a catalyst for significant morbidities such as retinopathy, peripheral neuropathy, and diabetic nephropathy. Meanwhile, the macrovascular complication of DM such as coronary heart, peripheral blood vessel, and stroke is the main cause of death. Additionally, an unorganized glycemic control, an increase of blood pressure as well as dyslipidemia could accelerate the development of both microvascular and macrovascular complications [5].
Macrovascular complication on DM is partly instigated by atherosclerosis. Atherosclerosis is an inflammation process happening gradually on a medium-sized artery [6]. There are several atherosclerosis stages based on histologic classification: type I, II, III, IV, V, and VI [7]. Furthermore, based on the clinical symptom, atherosclerosis could be divided into initiation, progression, and complication stages as stable and unstable angina [8]. Oxidized low-density lipoprotein (oxLDL) plays an important role in the initiation and development of atherosclerosis. Lectin-like oxLDL receptor-1 is responsible for the binding, internalization and degradation of oxLDL in endothelial cells [9]. Further oxLDL will increase the expression of adhesion molecules: E-selectin, P-selectin, vascular cell adhesion molecule-1 (VCAM-1), and intercellular adhesion molecule-1 which contribute to mediate adhesion monocytes and circulating lymphocytes [10].
At the atherosclerosis initiation stage, endothelial dysfunction and its activation will take place as a result of oxidative stress intensification and inflammation. Meanwhile, atherosclerosis progression phase is indicated by the establishment of foam cell layer and a proliferation of smooth muscle cells. Lastly, the atherosclerosis complication process is characterized by the emergence of rupture of the plaque, the formation of thrombus and the obstruction of complete and incomplete blood vessel. This happens for the viability decrease and an increase in the destructive inflammation response [11].
Various studies have exposed the correlation between oxidative stress effect and atherosclerosis. However, it has not been decided yet about the cause-effect relationship of low-density lipoprotein oxidative modification and atherosclerosis. Many studies have also shown the failure of atherosclerosis therapy using antioxidant. It then elicits an assumption that the oxidative damage is in fact not the cause but a response to atherosclerosis. Based on that reason, Stocker and Keaney [12] proposed an oxidative response to inflammation hypothesis. There are several markers used to detect atherosclerosis. Yet, a very few exist to identify the atherosclerosis stages for its complexity process. The oxLDL is the atherosclerosis marker detected along its stage and thus associated with endothelial damage, inflammation, and oxidative stress [8].
The involvement of oxidation on DM shows that the blood glucose level reduction is not yet sufficient to cope with the complication as a result of diabetes. A potent antioxidant, alpha-lipoic acid (ALA) functions as a co-factor to the complex multienzyme, such as pyruvate dehydrogenase and ketoglutarate dehydrogenase. In addition, the reduced form of lipoic acid, that is dihydrolipoate is deemed as a more potential antioxidant. The lipoic acid is amphipathic and distributed on cell membrane and cytosol, and can penetrate the bloodbrain barrier. The ALA activity realized in a form of redox is capable to send back the oxidant activities (vitamin C, E, and glutathione) by regenerating that particular antioxidant [13].
Studies on lipoic acid effect as a therapy on the diabetic neuropathy have been considerably conducted. As a matter of fact, in Germany the lipoic acid has been used for diabetic neuropathy patients for 30 years and that a meta-analysis study reveals that a treatment using 600 mg lipoic acid during 3 weeks can extensively reduce neuropathy deficit [14]. Nevertheless, the effect of lipoic acid towards oxidative stress of type 2 diabetes should further be profoundly studied. Several studies have demonstrated the influence of ALA on the expression of VCAM-1, such as in experimental autoimmune encephalomyelitis [15], cardiac dysfunction [16], and in vitro model of atherosclerosis [17]. But up to now, no research has been carried out on ALA influence to the expression of VCAM-1 in type 2 diabetic rat. This fact then turns out as a turning point of an experiment of ALA donation to a type 2 DM rat, which is afterward analyzed by using its own VCAM-1 expression. This research is crucial as a basis for ALA development and also to prevent atherosclerosis in type 2 DM patients.
Materials and Methods
Research design
The is an experimental research. The animals tested were randomly classified into three groups, with each group consists of six samples. In the first group (group I), the rats were given standard diet and mineral water (control group), while streptozotocin+nicotinamide (DM group) were provided for the second group (group II). Lastly, the streptozotocin+nicotinamide and ALA (besides standard diet; DM+ALA group) were given to the third group (group III).
Animal feeding and treatment
Eighteen healthy male Wistar rats, 10 weeks of age, were taken from the Faculty of Medicine, University of Sumatera Utara. Rats were treated in accordance with the Helsinki convention. Then, ethical approval was gained from the Research Ethics Committee of the Faculty of Medicine, University of Riau. We aimed to minimize the number of animals use and avoid animal suffering. Rats were placed in cages in a room with proper ventilation with the room temperature at 20℃–26℃ and humidity. The lighting of the room was regulated light and dark for 12 hours. Rat cages were cleaned every day and their health was well maintained. All rats were fed with standard diet for 2 weeks to be adapted to the environment. Diabetes was induced in 12-hour-fasted rats by a single intraperitoneal injection of prepared solution of streptozotocin (50 mg/kg body weight) in 0.1 M citrate buffer (pH 4.5), followed by intraperitoneal administration of nicotinamide (110 mg/kg) prepared in normal saline 15 minutes later. After 72 hours, rats with a blood glucose concentration above 250 mg/dl were proved to be diabetic and they were used for further investigation [18]. In the present investigation, ALA was administered 60 mg/kg body weight every day for 3 weeks. Oral treatments were performed using a sonde [19].
Evaluation of atherosclerosis
At the end of the experiment, the rats were sacrificed with ether anesthesia. Subsequently, abdominal aortic tissues were rapidly excised. The aortic sample was fixed in 10% neutralized formaldehyde in 0.1 M phosphate buffer and embedded in paraffin. A hematoxylin and eosin staining was performed to observe the morphological changes in the abdominal aortic in rats. Hematoxylin and eosin slides were then examined by pathologists. In the aorta, atherosclerosis was scored as follows: 0, normal; 1, widening of elastic fibers with few foam cells; 2, fragmentation of elastic lamellae with numerous foam cells and fibrosis/classification, vascular smooth muscle cells proliferation, medial lipid infiltration; and 3, ulcerated plaque/thrombus [20].
Determination of plasma oxLDL concentration
First, the blood was stored in a heparin tube via cardiac puncture. After that, a serum was obtained by centrifugation of blood at 1,000 ×g for 15 minutes. Finally, plasma oxLDL concentration was assessed using kits enzyme-linked immunosorbent assays (E-EL-R0710, Elabscience Biotechnology Co., Ltd., Wuhan, China).
Immunohistochemical staining
Those paraffin-embedded tissues were processed by giving an immunohistochemical staining which follows manufacturer's procedure. The antibody used in this study was the VCAM-1 policlonal antibody (Fnab09380, Fine Biotech Co. Ltd., Wuhan, China). The paraffin-embedded tissue of atherosclerosis without antibody was used as negative control. All slides were observed under light microscopy at ×400 magnification. Two-dimensional images were taken as many as 10 pictures each slide using a microscope camera. Expression of abdominal aortic adhesion molecule was assessed by calculation with Adobe Photoshop CS3 for percentage of area and intensity. The percentage area presented the comparison area containing VCAM-1 with a whole cross section of the aorta, which is assumed to be width expression. Intensity is often assumed to be a representation of concentration of VCAM-1.
Statistical analysis
The statistical software of SPSS version 17.0 (SPSS Inc., Chicago, IL, USA) was used to analyze the data. Analysis of variance test was used to compare the concentration of plasma oxLDL and expression of adhesion molecule. A P-value of 0.05 was considered statistically significant.
Results
Animal model
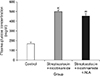
Mean levels of blood glucose after 72 hours are outlined in Fig. 1, with the lowest level is found in group I, equal to 169.40 mg/dl, and the highest level is discovered in the group II, equal to 500.00 mg/dl. Rats at group II and III have blood glucose concentration above 250 mg/dl. These results, therefore, concluded that the administration of streptozotocin (50 mg/kg body weight) followed by an administration of nicotinamide (110 mg/kg) was the most effective one in developing a diabetic model.
The effect of ALA on aortic atherosclerosis
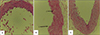
Table 1 depicts the score of aortic atherosclerosis in diabetes-induced rats (group II) which were increased as compared to the control rats (group I). Sixty-six percent of the diabetic rat given ALA 60 mg/kg body weight every day for 3 weeks showed normal vascular architecture with the score of 0 (Fig. 2A). The aortic lesion showed abundance with collagen fibers, proliferated and disoriented smooth muscle cells (Fig. 2B) with atherosclerosis score of 2 and foam cells in the interlamellar spaces (Fig. 2C) with atherosclerosis score of 1.
Effect of ALA on plasma oxLDL concentration
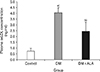
Fig. 3 shows the average concentration of plasma oxLDL found in each sample group. The control group had the lowest mean concentration of plasma oxLDL, equal to 0.56 ng/ml, and the highest concentration of plasma oxLDL was encountered in the diabetic group, equal to 4.09 ng/ml. One-way ANOVA tests revealed that there were significant differences among experimental groups. Post hoc tests showed that plasma oxLDL was lower in DM+ALA group compared with the diabetic rat.
VCAM-1 expression
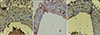
The percentage area of VCAM-1 in diabetic rats (group II) increased more significantly compared to normal (group I). Further, the percentage of area in DM+ALA group was lower than DM group. There were no significant differences among the groups in intensity. The expressions of VCAM-1 were significantly up-regulated in abdominal aortic of diabetic rats, which were markedly reduced by ALA treatment (Table 2, Fig. 4).
Discussion
Some studies have been carried out to analyze the lipoic acid effect towards DM, but most of them were done on the animal having type 1 DM. The streptozotocin (50 mg/kg BB) administration followed by 110 mg/kg BB nicotinamide intraperitoneal in this research has successfully resulted in DM rats. Streptozotocin was used to induce DM on the examined animal for its cytotoxic effect on beta-cell pancreas. The nicotinamide administration completed 15 minutes after the streptozotocin can diminish the damage emerges in beta-cell pancreas. This streptozotocin-nicotinamide administration will induce type 2 DM of the rats [18].
The morphological findings of this study have shown that the structure of aorta is disturbed in streptozotocin-induced diabetic rats. Infiltration of macrophages in the subendothelial space and migration of medial smooth muscle cells to the intima and proliferation of medial smooth muscle cells in the intima layer were observed in diabetic rats. These findings were considered to be early events in the development of the atherosclerotic lesion [11].
In this research, ALA 60 mg/kg dosage from the ALA dose conversion of previous research was utilized [19]. The research result designates that ALA administration for 60 mg/kg/day for 3 weeks is effective to decrease the oxLDL concentration for diabetic rats. The result is in line with a study conducted by Balkis Budin et al. (2009) [21] who got a significant oxidative stress marker concentration decrease on malondialdehyde and 4-hydroxynonenal after lipoic acid 100 mg/kg/day was administered for 8 weeks to DM type 1 rats. The decline was caused by the ALA's role as an antioxidant; capture of free radicals, the regeneration of endogenous antioxidant, repair oxidized protein, regulates the transcription of genes and inhibits the activation of nuclear factor κB [22].
This study found an increased expression of the VCAM-1 at the diabetic rat, but ALA can prevent this to happen. These results are similar to findings of a study by Sena et al. [23]. Their research projects revealed that ALA (50 mg/kg body weight 3 days per week for 3 months) can restore endothelial function and significantly improve systemic and local oxidative stress in high-fat-fed diabetic rats. The results of this present study are also consistent with the earlier study by Heinisch et al. (2010) [24], in which ALA treatment (21 days of intravenous treatment with 600 mg ALA) improves endothelium-dependent vasodilatation in patients with type 2 diabetes. Furthermore, in high-fat-fed mice, lipoic acid (60 mg/kg body weight for 2 weeks) has been demonstrated to have protective effects on atherosclerosis [19].
In the case of this study, the treatment of ALA in diabetic rat decreases both the oxLDL concentration in plasma and the VCAM-1 expression on aortas. This has indicated that ALA has a protective effect in the early stage of atherosclerosis. What is more important to note is that the plasma oxLDL concentration was simultaneously decreased suggesting a close correlation between endothelial dysfunction and oxidative stress in diabetes. Meanwhile, oxLDL triggers a series of inflammatory responses which induce the expression of adhesion molecules involved in the recruitment of circulating monocytes to the vascular endothelium [6].
In conclusion, this study demonstrates that ALA can protect against early endothelial dysfunction induced by type 2 diabetes and this effect might be related to the decrease of oxLDL level and VCAM-1 expression. These results suggest that ALA may have important implication for preventing diabetic vasculopathy. However, as a therapeutic agent, ALA still needs further investigation.


 XML Download