

 PDF
PDF ePub
ePub Citation
 Print
Print


INTRODUCTION
Susceptibility-weighted imaging (SWI) is a method of brain MRI that shows differences in sensitivity between tissues based on the paramagnetic susceptibility of iron.1 Phase images are the best for detecting the blood-oxygen-level-dependent effect, since the signal intensity in such images varies according to the degree of oxygen saturation in the blood. The magnetic field of the spin in each tissue differs when the magnetic properties of two adjacent tissues are different;2 this is known as the susceptibility effect, which differentiates among cerebral blood vessels (i.e., arteries and veins) by demonstrating differences in magnetic susceptibility between tissues.3 Arteries with a high concentration of oxyhemoglobin have a uniform magnetic field and no signal reduction, whereas signal reduction occurs due to the nonuniformity of the magnetic field in venous or hemorrhagic lesions when the deoxyhemoglobin level is relatively high.4 Since deoxyhemoglobin is a paramagnetic material, decreasing the effect of magnetic susceptibility decreases the signal in SWI images.5 SWI images obtained using this technique include T2-weighted signal-magnitude images, phase images emphasizing the difference in the susceptibility of a tissue or a material, and filtered phase images.
T2-weighted signal-magnitude images are multiplied by a multiplier (from three- to eightfold) of the phase mask to create SWI images that are highly sensitive to venous blood, hemorrhage, and iron deposition. The data are subsequently mapped by using minimum intensity projection (mIP) over several image planes (typically 5–10 image planes). mIP SWI provides the minimum-signal-intensity image that represents the change in tissue magnetic susceptibility over several image planes; it can show the continuity of a lesion or blood vessel passing through the image plane, and provides more-detailed images of twisted blood vessels.6 These characteristics make SWI clinically useful in metabolic diseases, traumatic brain injuries, and hypoparathyroidism.7
Identifying the epileptogenic zone when managing focal epilepsy is very important in the diagnosis of epilepsy and the planning of future treatment. Efforts have been made to identify the epileptogenic zone using various methods, including semiology with aura, long-term video EEG monitoring, brain MRI, brain single-photon-emission computed tomography (SPECT), and positron-emission tomography. However, considerable effort is needed to identify the epileptogenic zone in idiopathic subjects. MRI is the most important method for diagnosing epilepsy, but it reportedly yields a positive diagnosis in only 8–23% of new-onset epileptic patients.891011 Other additional diagnostic methods are therefore needed for identifying the epileptic zone.
In this study we analyzed the clinical significance of asymmetric hypervascularity in mIP brain MRI, especially in patients with focal epilepsy.
Go to : 
METHODS
Patients
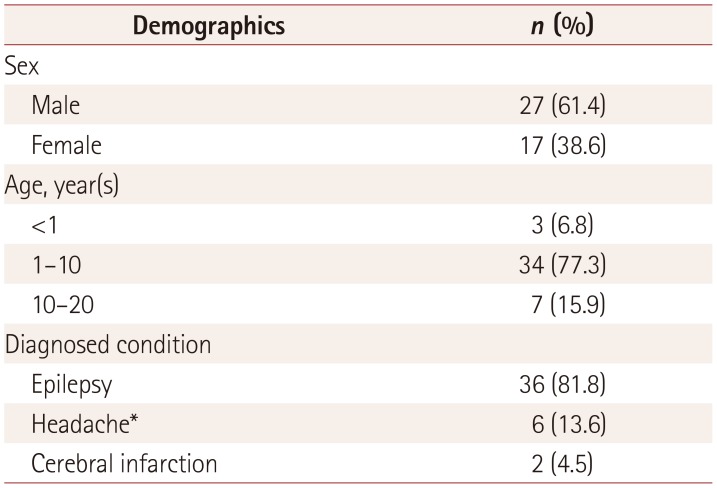
We analyzed asymmetric hypervascularity in mIP images of children who were examined using standard brain MRI, including SWI images, at the Department of Pediatrics, Chonbuk National University Hospital between January 2016 and December 2017. This study initially enrolled 570 patients with diverse neurological symptoms including seizure, of whom 54 (9.5%) had grossly asymmetric mIP vascularity. In order to eliminate inconsistencies in visual assessments of mIP vascularity asymmetry, 10 subjects with a difference of <5% in vascularity between the right and left hemispheres in analyses using ImageJ software (National Institutes of Health, Bethesda, MD, USA) were excluded. The remaining 44 patients (27 males and 17 females) with differences of >5% between hemispheres (detected in analyses using ImageJ software, https://imagej.net) were finally enrolled (Table 1).
This study was performed with approval from the Institutional Review Board of Chonbuk National University Research Council (approval no. CUH 2018-05-026).
Methods
We performed brain T2-weighted imaging (T2WI), fluid-attenuated inversion recovery (FLAIR) axial imaging, T1-weighted imaging (T1WI), transverse and coronal imaging, diffusion-weighted imaging (DWI), apparent-diffusion-coefficient imaging, and SWI in all patients.
We aimed to perform brain MRI and EEG as soon as possible after the patient arrived at the emergency room. We were able to clearly determine the time from the onset of neurological symptoms to performing brain MRI in 40 of the 44 patients.
Sedation was needed when performing brain MRI in 23 of 36 epileptic patients. A single sedative drug was administered in 19 of these patients. Eight patients received Pocral (chloral hydrate), six received ketamine, five received midazolam alone, and the remaining four patients received two or more medications for sedation.
The ImageJ program is commonly used for densitometric analysis (e.g., to quantify Western blot images12), and hence was also suitable for use in the present study since the methodology is similar to density measurement analysis. Left–right asymmetry was defined in this study as a difference of >5% between hemispheres using ImageJ software.
To calculate the blood vessel areas in brain MRI, we captured SWI images that showed significant differences in blood vessels in both hemispheres. Captured image data other than the blood vessels were then removed using the ImageJ program.
Detailed information on clinical symptoms including seizure semiology, EEG, and brain MRI was available for all of the patients, and the relationship between each finding and asymmetric mIP finding was assessed.
Go to :
RESULTS
Patient characteristics
The 44 patients had a mean age of 70 months (range: 4 months to 17 years), 27 were male and 17 were female, and 36 (81.8%) had epilepsy, 6 (13.6%) had headache, and 2 (4.5%) had cerebral infarction. The 36 patients diagnosed with epilepsy comprised 28 (77.8%) with complex partial seizures, 6 (16.7%) with status epilepticus, and 2 (5.6%) with febrile convulsion. Thirty-one of the 36 epileptic patients exhibited reliable semiology: 16 had right-side semiology and 15 had left-side semiology (Table 1).
The average difference between the hemispheres was 7.8% (range: 5–20%). Twenty-four of the 44 patients showed lef-themisphere-predominant vessels, while the remaining 20 showed right-hemisphere dominance (Fig. 1).
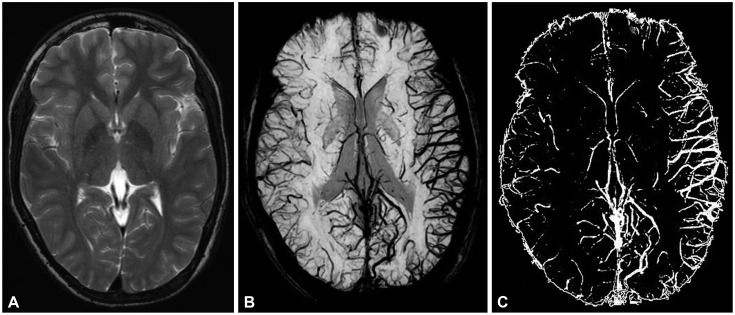 | Fig. 1Brain images of patients with Focal epilepsy on brain MRI and ImageJ. There were no specific findings in T2-weighted imaging (A). However, the difference in bilateral blood vessel volume was small when viewed in a minimum intensity projection image (B). We used ImageJ to obtain contrast images of blood vessels (C) for quantifying the difference in blood vessel volume (difference of 16%).
|
The findings were abnormal in 9 (20.5%) of the 44 patients in other MRI views, such as using T1WI, T2WI, FLAIR, and DWI, while the remaining patients (79.5%) showed only mIP abnormalities. The findings of high-resolution MRI were abnormal in 9 of the 36 epileptic patients. One of the 6 headache patients had MRI abnormalities, with a diagnosis of moyamoya disease.
The headache patients complained of headache in the right temporal, right periorbital, left temporal, and left frontolateral areas. Two patients with cerebral infarction were found to have right-sided weakness and left-sided head-turning symptoms.
MRI was performed between 1 and 8 hours after the onset of neurological symptoms in most patients (mean: 6 hours and 17 min; range: 1 hour and 57 min to 8 hours and 29 min). The times of symptom onset and MRI were not clearly identified in 4 of the 36 patients.
Sixteen (44.4%) of the 36 patients required anticonvulsant therapy to stop seizures upon presentation at the emergency room. Lorazepam was administered as a single agent in 10 patients, 4 patients received lorazepam and midazolam, and 2 received lorazepam and valproic acid.
Follow-up MRI was performed after 24 hours in one patient, with the asymmetry observed in the first MRI session being absent in the second MRI session (Fig. 2).
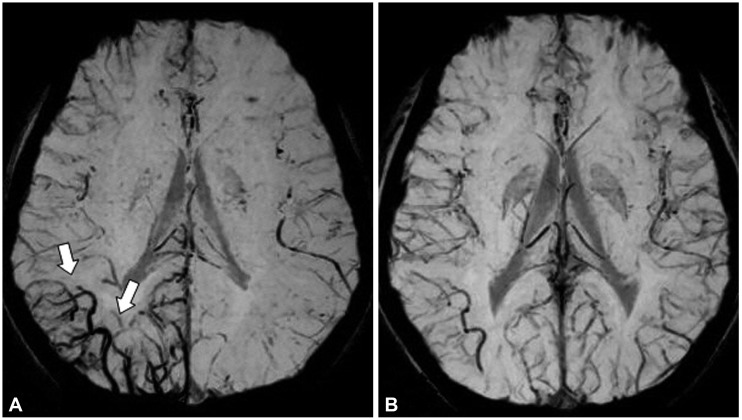 | Fig. 2Changes in mIP image over time after seizure in focal epilepsy patients. The initial MRI mIP image obtained 3 hours after the onset of seizures in a patient with right occipital lobe epilepsy showed an increase in venous vascularity (arrow) in the right occipital lobe (A). This finding was no longer evident in the mIP image obtained at follow-up performed 21 hours later (B). mIP: minimum intensity projection.
|
Concordance rate
Concordance rate between seizure semiology and mIP imaging
Thirty-one (86.1%) of the 36 epileptic patients with asymmetric mIP images showed definite partial seizure activities, whereas the remaining patients did not demonstrate a history of partial seizure manifestations.
The mIP view and semiology were concordant in 29 of the 31 epileptic patients (93.5%) with focal signs (16 on the right side and 15 on the left side) (Table 2).
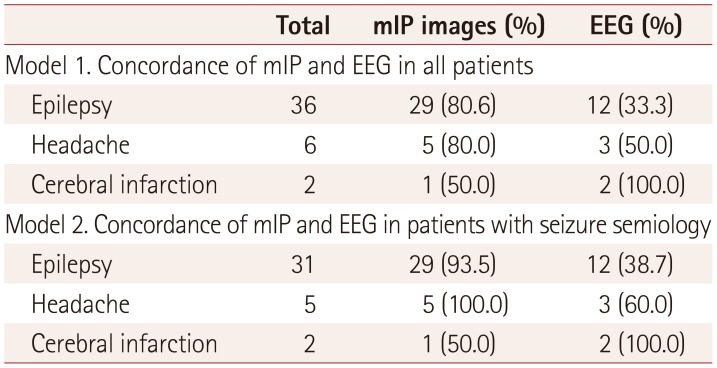
Table 2
Concordance between seizure semiology (focal signs) in mIP images and EEG data
![]()
Correlation with EEG
Twenty-four (54.5%) of the 44 enrolled patients showed EEG abnormalities, with 18 (50.0%) of the 36 patients with seizures confirmed by EEG. The 31 patients with focal epilepsy who showed concordance between semiology and mIP abnormality included 12 patients (38.7%) with same-side EEG abnormalities.
Among 6 headache patients comprising 5 with migraine and 1 with moyamoya disease, 5 (80%) showed concordance between mIP abnormalities and clinical symptoms, and three (50%) patients showed same-side EEG abnormalities.
The mIP images and EEG abnormalities were concordant in the 2 cases of cerebral infarction.
Go to :
DISCUSSION
The occurrences of epilepsy and their locations are very important factors to consider when treating epileptic patients. These aspects are clarified using detailed history-taking, EEG, and neuroimaging studies. EEG and high-resolution brain MRI are the most clinically useful tests for diagnosing and clarifying seizure types, but their detection rates are variable, especially at the first unprovoked seizure in pediatric patients, being only 42–59% in initial EEG and 8–21% in MRI.111314
Brain SPECT is also important for localizing partial seizures. Brain SPECT can reveal an increase in blood flow during ictus, especially in partial seizures. One study found that the sensitivities of SPECT in localizing the epileptogenic focus in temporal lobe epilepsy were 44%, 75%, and 97% for interictal, postictal, and temporal lobe epilepsy.15 The increased cerebral blood flow that is inevitable at the time of ictus can be measured by brain SPECT. Although brain SPECT can detect changes in blood flow, ictal SPECT requires extensive effort and interictal SPECT has a low reliability.
The mIP view obtained in a brain MRI sequence can be used to identify venous blood vessels based on detecting deoxyhemoglobin. An mIP image shows an increase in blood perfusion at the epileptic focus during an ictal seizure. While this is not direct evidence of increased perfusion during ictal events, it may indirectly indicate blood flow during ictal events. All of the present patients with asymmetry in mIP views showed transiently increased venous hypervascularity in the brain parenchyma, which was not accompanied by meningeal enhancement. Our data suggest that venous hypervascularity could be an important factor in determining the epileptic zone.
However, since this was not a large-scale study, it remains to be confirmed whether the venous hypervascularity in mIP SWI can be used for the lateralization of focal epilepsy. Aellen et al.16 reported that a low perfusion area in SWI was the epileptic focus, whereas Iwasaki et al.17 reported that this was indicated by an area of increased perfusion in SWI. As with ictal SPECT test findings in epileptic patients, increased blood perfusion is a natural consequence during an ictal event, and this inevitably increases the amount of venous drainage. The increase in venous vessels in mIP images is therefore considered to be a sign of increased cerebral blood' volume during the ictal period. This is consistent with Iwasaki et al.17 reporting transient venous hypervascularity in SWI in patients with focal seizures. The difference between these studies is probably due to selection bias, in that most of the patients in the study of Aellen et al.16 were symptomatic, whereas almost all of the patients in the present study were idiopathic. These symptomatic causes such as ischemic stroke, mitochondrial encephalopathy, lactic acidosis, and stroke-like episodes, or infarction can induce cerebral vascular perfusion defects by the lesions themselves rather than epilepsy. However, the underlying lesions in idiopathic patients like ours could not obstruct the blood flow.
Most epilepsy events are unpredictable, and so epileptic patients are often forced to visit the hospital when they develop seizures. Therefore, mIP findings could provide strong evidence of seizure occurrence and the localization of focal seizures in patients. We were able to identify significantly increased vascularity in mIP images of bilateral hemispheres in patients with generalized epilepsy (data not shown). We expect that these findings would be observed in various types of epilepsy.
With the exception of four patients who underwent MRI approximately 16 hours after symptom onset, most patients underwent MRI within 4–6 hours. One patient underwent follow-up MRI 24 hours later, which showed that the original mIP findings were now absent. This suggests that asymmetry in mIP images may be a temporary phenomenon and so only useful for a diagnosis if MRI is performed early.
In this study we observed 44 (7.7%) asymmetric vascularity abnormalities in mIP views among 570 patients with diverse neurological symptoms. Visual assessments revealed grossly asymmetric mIP vascularity in 54 (9.5%) of the 570 patients, and ultimately 44 patients with differences of >5% between hemispheres (detected in analyses using ImageJ software) were enrolled. These patients comprised 36 with epilepsy, 6 with headache, and 2 with cerebral infraction. Thirty-one of the 36 epileptic patients with asymmetric mIP images showed definite partial seizure activities in semiology, of which 29 (93.5%) patients with focal epilepsy had increased venous vascularity at the site, consistent with semiology data. Further, 24 of the 44 patients showed EEG abnormalities. EEG abnormal findings (focal spikes and/or focal slowing) were observed in half of the 36 epileptic patients. Eleven (35.5%) of the 31 patients with focal epilepsy who showed concordance between seizure semiology and mIP abnormality showed same-side EEG abnormalities. The mIP view was concordant with semiology in 93.5% of the epileptic patients with focal signs, whereas the EEG findings were concordant with semiology in only 35.5% of them.
Brain MRI mIP images could be useful for assessing epilepsy localization as an alternative to EEG and conventional brain MRI. However, since mIP asymmetry abnormalities did not appear in all of the epileptic patients who underwent brain MRI at similar time points, further studies that utilize mIP images are needed.
Go to :
 XML Download