

 PDF
PDF ePub
ePub Citation
 Print
Print


INTRODUCTION
There is accumulating evidence that idiopathic rapid eye movement (REM) sleep behavior disorder (iRBD) is a prodromal symptom for Lewy body diseases such as Parkinson's disease (PD).1 However, biomarkers predictive of neurodegeneration in iRBD have yet to be developed. An abnormal metabolic brain network in PD, known as PD-related covariance pattern (PD-RP), has been used to distinguish PD patients from healthy controls (HC) and from patients with atypical parkinsonian syndromes.23 A small proportion of iRBD patients show an elevated PD-RP relative to the corresponding HC values.45 Patients with iRBD who subsequently develop PD or dementia with Lewy bodies (DLB) showed an elevated PD-RP relative to those who remained unchanged.6 However, direct correlations of the PD-RP in iRBD patients with other prodromal signs such as hyposmia, cognitive, and dopamine transporter (DAT) loss have not been clearly demonstrated in previous studies. Regardless of the PD-RP, iRBD patients exhibit a unique metabolic pattern, known as the RBD-RP.47 In addition, RBD symptoms do not always precede or simultaneously appear at the time of a PD diagnosis, and a few PD patients do not manifest RBD. PD patients with RBD have predominant motor features of postural-instability gait disturbance, and are more frequently associated with autonomic dysfunction and dementia,8 synuclein pathology,9 and functional and structural brain changes than PD patients without RBD.1011 We therefore investigated the specific metabolic pattern related to PD patients with RBD, and also analyzed it in iRBD patients to determine whether the metabolic pattern was related to the presence of other prodromal clinical and neuroimaging markers.
In this study we identified a metabolic network that predicts neurodegeneration in iRBD patients from a prospective cohort consisting of patients with de novo PD with probable RBD (PDRBD), iRBD patients confirmed by polysomnography, and age and sex-matched HC. To this end, we first extracted the PDRBD-RP and validated this metabolic pattern in a separate cohort of PD patients with polysomnography-confirmed RBD. Second, we evaluated the relationship between the PDRBD-RP and other prodromal markers including olfactory and cognitive functions, and the striatal DAT density in patients with iRBD.
METHODS
Participants
The cohort in this study was prospectively recruited from the neurology clinic at the Seoul National University Boramae Hospital between 2013 and 2015. The inclusion criteria for participants aged 50 to 80 years for each group were as follows: The PDRBD group was defined as subjects who were drug-naïve and first diagnosed with PD according to the diagnostic criteria of the UK PD Society Brain Bank, and who had a history of probable RBD preceding parkinsonian symptoms. Probable RBD was screened based on the RBD screening questionnaire (RBDSQ) with a cutoff score of >5.12 The iRBD group comprised subjects diagnosed according to the criteria of the second edition of the International Classification of Sleep Disorders13 and confirmed by video polysomnography. HC who were age matched for the patient groups were also recruited during the study period. The exclusion criteria were the presence of white-matter changes or structural lesions unrelated to PD, a history of psychiatric or cogcognitive illness that affected RBD symptoms, and the presence of neurological diseases other than PD.
Totals of 21 patients with PDRBD, 28 patients with iRBD, and 24 HC were enrolled in the present study. To validate the PDRBD-RP, we included 11 PD patients with RBD as confirmed by polysomnography. The characteristics of the validated PDRBD group and the comparison with the de novo PDRBD group are presented in Supplementary Table 1 (in the online-only Data Supplement).
All participants underwent a general neurological evaluation for any neurological signs of brain diseases and were evaluated for parkinsonian symptoms using the Unified PD Rating Scale as revised by the Movement Disorders Society Task Force (MDS-UPDRS). The iRBD patients also underwent tests for olfactory and cognitive functions. The olfactory function was evaluated using the butanol threshold test (BTT) and the short smell identification test (SSIT).1415 We categorized iRBD patients into anosmia and normosmia according to the BTT and SSIT scores (anosmia, concentrations of 0–5 in the SSIT and 0–4 in the BTT; normosmia, concentrations of 8–12 in the SSIT and 7–9 in the BTT). Subjects exhibiting a deficit in only one test or exhibiting moderate scores in both tests were categorized as the intermediate group. Cognitive function was examined using a battery of neuropsychological tests validated in the Korean population, consisting of the Stroop Color and Word Test, trail-making test (TMT) A/B, digit-span test, Controlled Oral Word Association Test (semantic/phonemic), Korean version of the Boston Naming Test, Seoul Verbal Learning Test, and Rey Complex Figure Test (RCFT) copying.16
The performance on the neuropsychological tests was transformed into a z score based on the age- and education-adjusted normative performance data. This study was registered at clinicaltrials.gov (NCT02984137), and the study protocol was approved by the Institutional Review Board of our institution (IRB No. 16-2013-101). All subjects provided written informed consent before enrolling in this study, in accordance with the Declaration of Helsinki.
Image acquisition and processing
Two PET scans were performed using a PET/CT scanner (Gemini TF64, Philips Healthcare, Best, the Netherlands). All participants underwent 18F-fluorodeoxyglucose (18F-FDG) PET to identify the disease-related spatial covariance patterns. The 10-min emission scan started 40 min after the intravenous injection of 4.8 MBq/kg 18F-FDG. Images were reconstructed using a 3-dimensional row action maximum-likelihood algorithm set to 90 2-mm-thick slices in a 128×128 matrix, with correction for attenuation and scatter. 18F-FDG PET images were processed using SPM8 software (Statistical Parametric Mapping 8; http://www.fil.ion.ucl.ac.uk/spm/) running on MATLAB 7.11 (MathWorks, Natick, MA, USA). Individual 18F-FDG PET images were spatially normalized to the study-specific template and smoothed using an isotropic Gaussian kernel with a 12-mm full-width at half-maximum.
All of the patients plus 12 HC underwent 18F-N-3-fluoropropyl-2β-carboxymethoxy-3β-(4-iodophenyl)-nortropane (18F-FP-CIT) PET to image the DAT density. The 10-min emission scan started 150 min after the injection of 185 MBq 18F-FP-CIT, and the images were reconstructed in a manner similar to that used for the 18F-FDG PET images.
The anatomical regions of interest (ROIs) for 18F-FP-CIT PET were the caudate nucleus, putamen, and cerebellum. These ROIs were obtained automatically using T1-weighted images with the segmentation tool FSL-FIRST (http://fsl.fmrib.ox.ac.uk/fsl/fslwiki/first). The putamen was divided into anterior and posterior halves along its longitudinal axis in the transaxial plane. Left and right ROI values were averaged for each structure. The DAT binding of 18F-FP-CIT was determined as the (region-cerebellum)/cerebellum uptake count ratio.
Metabolic brain network analysis
To identify and characterize a significant spatial covariance pattern associated with the disease, 18F-FDG PET images were analyzed using scaled subprofile model/principal component analysis implemented in ScAnVP (Scan Analysis and Visualization Processor, version 7.0w; http://feinsteinneuroscience.org/).3 Each PDRBD-RP and RBD-RP was identified from the 18F-FDG PET data of each disease group in combination with those derived from HC. The disease-related pattern was determined among the principal components (PCs) that accounted for the top 50% of the variance in the data. Subject scores for the selected PCs were entered both singularly and in all possible combinations into a series of linear regression models, with the group as the dependent variable. The model with the lowest Akaike information criterion value was selected to represent the disease-related pattern. The reliability of the resulting topography was evaluated using a bootstrap resampling procedure (p<0.05).17
The values of the PDRBD-RP and RBD-RP were quantified in all participants using a voxel-based pattern quantification algorithm, and were Z-transformed using the values for HC for each network. The PDRBD-RP and RBD-RP were compared topographically using a voxel-by-voxel correlation method included in the ScAnVP software.
Statistical analysis
Group differences in demographic and clinical variables were evaluated using one-way ANOVA, the chi-square test, and the independent-samples t-test as appropriate. Differences in the network and 18F-FP-CIT uptake in each ROI across subject groups were assessed using one-way ANOVA followed by post-hoc Tukey's honestly significant difference tests. Correlations between each disease-related pattern and clinical measures such as the MDS-UPDRS motor rating, striatal DAT density, scores on olfactory function tests, and z scores of neuropsychological tests were evaluated using Pearson's correlation coefficients.
We found significant correlations between the PDRBD-RP expression and age in the iRBD group (r=0.553, p=0.002) and not in the PDRBD group (r=0.375, p=0.094). Therefore, a stepwise multiple regression analysis was used to evaluate the independent correlations between the PDRBD-RP expression and clinical measures after controlling for age. Differences in each pattern expression between anosmic and normosmic iRBD patients were evaluated using analysis of covariance, with age as the covariate. Statistical analyses were performed using SPSS 13.0 software (SPSS Inc., Chicago, IL, USA), with significance level set at 0.05, and with Bonferroni correction applied to multiple tests if appropriate.
RESULTS
Demographic and clinical characteristics
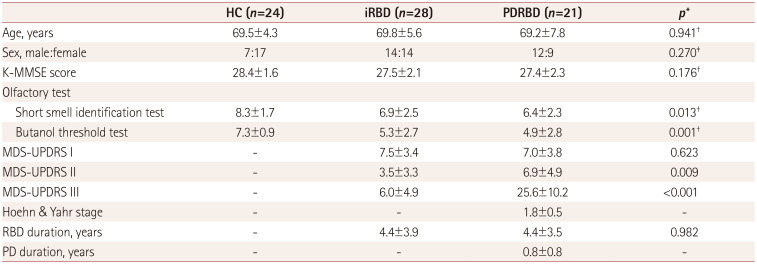
The demographic and clinical characteristics of the participants finally included in the analyses are presented in Table 1. Based on the results obtained from the olfactory function tests, 8 iRBD patients manifested anosmia (29%) and 10 iRBD patients had normal olfactory function (36%). Regarding the neuropsychological function in iRBD patients, the average z scores for all tests were within 1 SD of the normative data except for TMT-B (−1.03 SD) and RCFT copying (−2.07 SD). Scores for the iRBD patients on tests of olfactory and cognitive functions are presented in Supplementary Table 2 (in the online-only Data Supplement).
DAT density
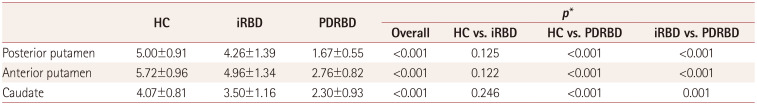
The DAT density as measured by the 18F-FP-CIT uptake differed significantly among the three groups in all striatal ROIs: the posterior putamen [F(2,58)=48.68], anterior putamen [F(2,58)=34.53], and caudate [F(2,58)=13.78]. The post-hoc comparisons adjusted for multiple comparisons revealed no significant difference between the iRBD group and HC, while the DAT uptake level in the iRBD group was intermediate between those in the HC and PDRBD patients in all ROIs. The DAT densities are presented in detail in Table 2.
Disease-related metabolic patterns
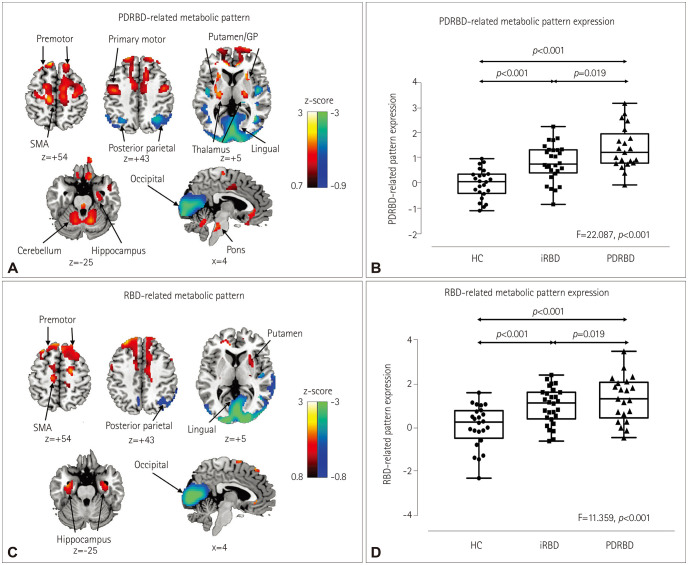
Among the top PCs accounting for 50% of the variance, we identified the PDRBD-RP as the linear combination of PCs 1–4 that accounted for 10.1% of the subject × voxel variance. The pattern was characterized by increased metabolism in the primary motor cortex, supplementary motor area (SMA), premotor cortex, thalamus, putamen/globus pallidus, rostral and orbital parts of the superior frontal cortex, cerebellum, pons, and parahippocampal gyrus, and decreases in the occipital and posterior parietal cortices (Fig. 1A). The RBD-RP was identified as the third PC accounting for 8.9% of the subject × voxel variance. The RBD-RP showed considerable overlap with the PDRBD-RP in several brain areas, including the SMA, premotor cortex, putamen, parahippocampal gyrus, and occipital and posterior parietal cortices (Fig. 1C). A significant voxelwise correlation was found in the two disease-related metabolic patterns (r=0.67, p<0.001).
The PDRBD-RP and RBD-RP differed significantly among the groups [F(2,71)=22.09 and F(2,71)=11.36, respectively; p<0.001]. The PDRBD-RP showed a gradual increase from HC to iRBD patients and to PDRBD patients. The PDRBD-RP in iRBD patients was significantly elevated relative to HC (p<0.001), but lower than in patients with PDRBD (p=0.019) (Fig. 1B). The validation PDRBD group showed a significantly increased PDRBD-RP similar to that in the de novo PDRBD group [F(2,54)=21.63, p<0.001] (Fig. 2). The RBD-RP was elevated in both the iRBD (p=0.002) and PDRBD (p<0.001) groups relative to the HC group, with no significant difference between these two groups (Fig. 1D).
PDRBD-RP was correlated with olfactory impairment, executive function, and mild parkinsonian signs in iRBD
Both the BTT and SSIT scores were correlated negatively with the PDRBD-RP in patients with iRBD (r=−0.646 and p=0.001, and r=−0.481 and p=0.017, respectively) (Fig. 3A and B). After controlling for age, the PDRBD-RP was significantly associated with the BTT score (p=0.007) but not with the SSIT score. The iRBD patients with anosmia showed an elevated PDRBD-RP compared with normosmic iRBD patients [F(1, 15)=9.572, p=0.007; Fig. 3C]. In neuropsychological tests, the reaction time in TMT-B was negatively correlated with the PDRBD-RP in iRBD patients (r=−0.581, p=0.002, age-controlled p=0.006) (Fig. 3D). The PDRBD-RP in iRBD patients showed a tendency for a positive correlation with MDS-UPDRS motor scores (r=0.369, p=0.053), and a trend of a negative correlation with DAT densities in the posterior putamen (r=−0.468, p=0.012), anterior putamen (r=−0.437, p=0.02), and caudate (r=−0.519, p=0.005) regions, but the statistical significance did not remain after controlling for age (age-controlled p=0.183, 0.232, and 0.134, respectively).
The RBD-RP expression was correlated with olfactory impairment, executive function, and mild parkinsonian signs in iRBD
The RBD-RP in iRBD patients was negatively correlated with the BTT score (r=−0.592, p=0.002, age-controlled p=0.003) but not with the SSIT score. Patients with anosmia showed an elevated iRBD-RP compared to those with normosmia [F(1, 15)=8.378, p=0.011) (Fig. 3E), although there were significant overlaps between the two RBD subgroups. The reaction time in TMT-B also showed a negative correlation with the RBD-RP (r=−0.426, p=0.034; age-controlled p=0.037). The RBD-RP in iRBD patients was not correlated with MDS-UPDRS motor scores or the striatal DAT density.
DISCUSSION
This study found that the PDRBD-RP showed relative metabolic increases in major elements of the motor cortico-striato-pallido-thalamocortical circuits and relative metabolic decreases in the occipital and parietal cortices. The PDRBD showed a positive correlation with the MDS-UPDRS motor ratings (r=0.719, age-adjusted p<0.001), suggesting that the PDRBD-RP resembles the PD-RP previously associated with parkinsonian motor symptoms in PD patients.23 In contrast to the PD-RP, the PDRBD-RP is characterized by relative hypermetabolism in the hippocampus and premotor cortex. Relative hypermetabolism in the hippocampus has been consistently identified in the current and previous RBD-RPs.47 The hippocampal hyperperfusion was associated with the risk of neurodegeneration in iRBD patients,18 and interactions between the dopaminergic system and the hippocampus is an important function in the brain for synaptic plasticity, adaptation, and motivated behaviors and learning, which is also implicated in the pathophysiology of nonmotor symptoms in PD.19 The elevated metabolic activity in the premotor cortex of the PDRBD-RP contrasts with the PDRP previously showing decreased metabolic activity in the same region.23 The discrepancy between the PDRBD-RP and PD-RP might be due to a distinctive feature of our study population. Our PD patients were very-early-stage de novo PD patients who concurrently manifested RBD symptoms. In a previous study of very-early-stage PD patients, the PD-RP was topographically similar to those at more advanced stages of PD, but the PD-RP in that study did not include the relative hypometabolism in the premotor cortex20 evident in our PDRBD-RP. Previous functional imaging studies have shown increased premotor cortical activity as an important compensatory mechanism in PD patients during sequential movements.21 On the other hand, brain regions within the RBD-RP were also found within regions of the PDRBD-RP. The PDRBD-RP gradually increased from the HC to the iRBD and PDRBD groups; however, the RBD-RP did not differ significantly between patients with PDRBD and iRBD. Our results suggest that the PDRBD-RP includes both pathophysiological aspects of iRBD and compensatory or adaptive mechanisms of early PD in addition to motor features captured by the PD-RP.
We found that the PDRBD-RP expression showed a significant correlation with olfactory and executive dysfunctions in iRBD patients. Hyposmia is one of the premotor symptoms of Lewy body diseases,22 and is also frequently observed in iRBD patients.23 Moreover, the presence of hyposmia is linked to a high probability of neurodegeneration in iRBD patients.24 Defective cognitive performance and mild cognitive impairment (MCI) are frequent features of iRBD patients.2526 Compared with iRBD patients without MCI, those with MCI showed abnormal brain changes such as waking EEG slowing in the posterior cortical regions,27 and hyperperfusion in the putamen and paracentral regions,28 which is similar to brain changes observed in PD and DLB patients. Actually these brain changes are consistent with our study results, since the PDRBD-RP showed relative occipital hypometabolism, as also seen in the RBD-RP. Another study found that cognitive changes in iRBD predicted neurodegeneration.29 The PDRBD-RP was correlated with frontal executive function scores but not memory or visuospatial task scores in our iRBD patients. Executive dysfunction is the most common cognitive deficit detected in early PD,30 and attention and frontal executive dysfunctions have been recently reported as significant indicators of neurodegeneration in iRBD patients, and also DLB-type neurodegeneration.29 Thus, the correlation with olfactory and executive dysfunctions in iRBD patients supports the utility of the PDRBD-RP in detecting early neurodegeneration in iRBD.
Other interesting findings that should be highlighted are the correlations of the RBD-RP with the olfactory function and frontal executive function scores, although these correlations were weaker than those for the PDRBD-RP, and there was a large overlap in the RBD-RP expression between anosmic and normosmic iRBD patients, unlike for the PDRBD-RP. Future studies should compare longitudinal changes between the RBD-RP and the PDRBD-RP because the former might evolve into the latter as the disease progresses.
The iRBD patients in the present study showed a DAT density intermediate between those of the PDRBD patients and HC, with a negative correlation between the PDRBD-RPs. A particularly interesting finding was that the PDRBD-RP was abnormally elevated in about 40% of the iRBD patients (11 of 28) based on the cutoff level of 1.2 (2 SDs from normal values). However, only about half of them (6 of 11; blue square dots in Supplementary Fig. 1 in the online-only Data Supplement) showed decreases in the striatal DAT density (average 18F-FP-CIT uptake in the caudate and putamen) of more than 2 SDs below the normal values, and the remaining 5 iRBD patients with an elevated PDRBD-RP showed normal DAT densities (red square dots in Supplementary Fig. 1 in the online-only Data Supplement). Among patients with an elevated PDRBD-RP, no age differences existed between the subgroups with normal and low DAT densities (p=0.096, Mann-Whitney U test), suggesting that the PDRBD-RP increases before the loss of DAT in iRBD patients, or that an elevated PDRBD-RP with or without DAT loss predicts the progression into the DLB and PD phenotypes of Lewy body diseases, which are two clinical correlates of cortical and brainstem Lewy body diseases in iRBD patients.31 After completing the baseline evaluation, our iRBD patients were prospectively monitored with a 4-year follow-up plan. Up to, 5 of the 11 iRBD patients with an elevated PDRBD-RP had developed Lewy body diseases, 2 were lost to follow-up, and the remaining 4 had an unchanged disease status.
One previous study found that the PD-RP was elevated both in iRBD patients with hyposmia and in patients with abnormal DAT binding.5 However, that study found no significant correlation between the PD-RP and olfactory scores or DAT binding in iRBD patients. The authors suggested that three markers (the PD-RP, olfaction, and DAT imaging) can provide complementary information. We showed direct correlations of the PDRBD-RP with olfactory and executive function scores, and an interesting relationship with DAT binding as described above. Thus, the PDRBD-RP probably reflects pathophysiological changes related to prodromal-phase Lewy body diseases in iRBD patients better than the previous PD-RP, although direct comparisons are needed in future studies.
A few limitations of this study should be considered. First, the RBD in patients in the de novo PDRBD group was not confirmed by polysomnography. However, the RBDSQ showed adequate internal consistency in PD patients and appropriate validity for the screening of RBD in this population, with a recommended cutoff score of 6.32 In addition, we also reproduced the PDRBD-RP in a separate PD cohort manifesting RBD that was confirmed by polysomnography, suggesting that the PDRBD-RP is specific to PDRBD. Second, we did not examine the PDRBD-RP in patients with multiplesystem atrophy (MSA). However, MSA from iRBD is relatively rare and MSA patients usually do not exhibit hyposmia as a prodromal sign. Our hyposmic RBD patients were therefore less likely to have prodromal-stage MSA. Third, we did not consider DLB separately from PD because it shares the pathology of Lewy bodies with PD, and for the prodromal stages both conditions are considered to fall along a spectrum of Lewy body diseases consisting of constipation, RBD, and hyposmia. In addition, PD evolving from iRBD is primarily a postural-instability gait-disorder type of PD that is linked to certain nonmotor symptoms such as autonomic dysfunction, dementia, and visual hallucination, which are also typical features of DLB. Separating PD and DLB would therefore be meaningless in the present prodromal study and, for the same reason, the PDRBD-RP looks more valuable than the previous PD-RP if we incorporate both the types of PD and DLB as our primary research focus.
The findings of this study indicate that the PDRBD-RP represents an appropriate candidate marker of early neurodegeneration in iRBD patients. A long-term follow-up of the PDRBD-RP in combination with olfactory, cognitive, and DAT changes in our iRBD cohort is essential to evaluate its role in both clinical and research settings.


 XML Download