

 PDF
PDF ePub
ePub Citation
 Print
Print


Introduction
Radial probe endobronchial ultrasound (R-EBUS) is a procedure that shows the lung images around the bronchus by transmitting the ultrasound signals generated at the endoscopic ultrasound center to the miniature probe through the driving unit. It shows a 360° view of the lung around the probe tip by advancing the probe till it reaches the pulmonary lesion through the working channel of the bronchoscope12. R-EBUS-guided transbronchial lung biopsy (TBLB) is currently widely performed for peripheral pulmonary lesions (PPLs), such as lung nodules, to obtain tissue samples.
For PPLs, it is well known that the diagnostic yield of R-EBUS-guided TBLB is higher than that of the conventional TBLB without using R-EBUS134. Upon tissue diagnosis for PPLs, the diagnostic yield of conventional TBLB reportedly ranges from <20%5 to 60%67. However, the diagnostic yield of R-EBUS-guided TBLB is known to be around 70%1. The reason behind the higher diagnostic yield of R-EBUS-guided TBLB appears to be the fact that it can correctly guide the probe toward the location of the pulmonary lesion.
To the best of our knowledge, no studies have investigated the usefulness of R-EBUS-guided TBLB for the consolidation or ground-glass opacity (GGO) lesions involving one or more segments of the lung, namely diffuse lung lesions (DLLs), rather than PPLs. In this study, we aimed to determine the utility of R-EBUS-guided TBLB by performing it for diagnosing DLLs and comparing the results with those of conventional TBLB.
Materials and Methods
1. Study design and population
This retrospective study was conducted in a single institution. The study population comprised patients who underwent TBLB via bronchoscopy for DLLs from among those admitted to the Department of Pulmonology of the Daegu Catholic University Medical Center from January 1, 2016 to November 30, 2017. During this period, 410 patients underwent TBLB, and excluding the 283 patients who underwent TBLB for PPLs, 127 patients underwent TBLB for DLLs. Among the patients with DLLs, the 67 patients who underwent R-EBUS-guided TBLB were compared with the 60 who underwent conventional TBLB without using R-EBUS. This study was approved by the Institutional Review Board of the Daegu Catholic University Medical Center (IRB No. CR-18-109), and the requirement of written informed consent was waived due to the retrospective nature of the study.
2. Diffuse lung lesions
In general, diffuse lung diseases include all reticular, nodular, alveolar, and cystic lung diseases. In a narrow sense, it refers to lung disorders, including infiltration, fibrosis, or fluid accumulation in the structures of the secondary pulmonary lobules, and has various differential diagnoses8. In this study, the term “DLLs” was used as a concept that contrasted PPLs. PPLs refer to lesions surrounded by the lung parenchyma, which do not show endobronchial abnormalities in the bronchoscopy findings9. “DLL” was defined as a lung lesion showing an abnormal shadow of the lung involving one or more lung segments on chest computed tomography (CT), and the lung nodule or mass was excluded. Such abnormal shadows were mostly consolidation, GGO lesions, or a combination of both. Moreover, some micronodules, fibrosis, alveolar interstitial thickening, reticular opacity, and honeycombing were also included.
3. Implementation of bronchoscopy
All the bronchoscopies were performed by four experienced respiratory specialists with more than 10 years' experience. Two types of videobronchoscopes were used: BF-260 (Olympus, Tokyo, Japan) and BF-P260F (Olympus). For the video processor unit, EVIS LUCERA CLV-260SL (Olympus) was used, and for the ultrasonic videobronchoscope unit, EVIS EUS EU-ME2 (Olympus) was used. For the probe driving unit, MAJ-1720 (Olympus) was used. For the R-EBUS probe, UM-S20-17S (Olympus) or UM-S20-20R (Olympus) was used, while for the biopsy forceps, FB-231D (Olympus) was used.
Before the procedure, in order to reduce the discomfort, pethidine was used. For the local anesthesia, lidocaine nebulizer was applied to the nasal cavity and the pharyngeal mucosa. Based on the patient's pre-examination condition, conscious sedation was induced by adjusting the dose of midazolam, and based on the patient's condition during the examination, fentanyl was additionally used. The bronchoscopy procedure time was measured as the time from the insertion of the bronchoscope until its removal. After the procedure, in order to reverse the effect of midazolam, flumazenil was used. During the bronchoscopy, the blood pressure, pulse rate, and oxygen saturation were monitored.
4. Blind TBLB
Blind TBLB was defined as TBLB performed using the conventional method, without R-EBUS guidance. All the TBLBs were performed without fluoroscopic guidance. We did not use fluoroscopy because our hospital does not possess the facility to perform fluoroscopy in the bronchoscopy suite, and fluoroscopy is not commonly used when performing TBLB.
Blind TBLB is performed in the following manner. Bronchus subjected to tissue diagnosis is checked in advance via chest CT, and a bronchoscope is inserted up to the orifice of the subsegmental bronchus. Forceps are introduced through the working channel of the bronchoscope and advanced into the part where resistance is felt or the patient complains of chest pain. After withdrawing the forceps by about 1–2 cm, the patient is instructed to perform deep inspiration, and the practitioner waits while opening the forceps. Thereafter, the patient is instructed to perform deep expiration, at the end of which, the forceps are advanced into the distal portion by about 1 cm, and are then closed to perform biopsy10.
5. R-EBUS-guided TBLB
The method of performing R-EBUS-guided TBLB is as follows. First, the biopsy site is checked in advance using the chest CT image, and a bronchoscope is inserted up to the orifice of the subsegmental bronchus. R-EBUS is introduced into the subsegmental bronchus, and ultrasound image is used to determine whether it is a lesion site. If the image is not visible clearly, a proper position is searched by assessing the nearby subsegmental bronchus until a proper image is visible.
Once the location of the subsegmental bronchus of the lung lesions is confirmed with R-EBUS, adhesive medical tape is placed at the site where the orifice of the patient's nostril meets the bronchoscope, to mark the location. Then, the assistant is instructed to tightly hold the part so that the bronchoscope does not move proximally or distally. The R-EBUS image is then observed while the R-EBUS is slowly pulled back proximally after being pushed toward the end of the subsegmental bronchus, the location of which has been confirmed. The R-EBUS is pulled back proximally as far as possible, within the range where a proper and clear image is visible. If the original clear image is not visible, because the image changes while the R-EBUS is being moved proximally, the R-EBUS should again be slightly pushed distally to find the location where a clean image is visible. The R-EBUS is pushed about 0.5 cm further distally from the proximal portion where a proper image is visible. This position is considered the reference point for R-EBUS-guided TBLB.
At this reference point, adhesive medical tape is affixed to the junction where the R-EBUS probe and the inlet of the working channel of the bronchoscope meet. The R-EBUS probe is then removed from the bronchoscope and is aligned with the biopsy forceps on the disinfected table. The location 1 cm proximal to the marked part with adhesive medical tape is then marked, thereafter, the adhesive medical tape is affixed to the same location on the forceps. The reason that the location indicated on the forceps was not marked the same as the location of the probe but was marked 1 cm outside of the location indicated on the probe was to make TBLB possible even at a 1 cm further distal area from the reference point.
The biopsy forceps prepared as mentioned above should then be introduced into the bronchoscope working channel, and the area marked with an adhesive medical tape should be located 1 cm away from the inlet of the working channel of the bronchoscope.
At this time, the tip of the forceps is located at the aforementioned reference point. Then the forceps should be opened when the patient inhales deeply, as instructed. The forceps should then be closed when the patient exhales deeply, to perform the biopsy. If the biopsy specimen is not obtained in this manner, the procedure should be repeated, and biopsy should be performed by pushing the forceps 0.5–1 cm further distal from the area marked with the adhesive medical tape.
The R-EBUS-guided TBLB performed in this study did not involve the use of a guided sheath (GS) because such a GS has not been approved for TBLB in DLLs in South Korea. Moreover, fluoroscopy was not used for the same reason as blind TBLB when performing R-EBUS-guided TBLB.
6. R-EBUS image findings
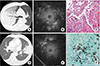
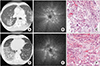
Consolidation on chest CT was observed as an isoechoic tissue-like pattern11 in R-EBUS (Figure 1). GGO lesions have the same snowstorm appearance observed in the normal lung; however, they show a more hyperechoic and coarse R-EBUS signal, called the “blizzard sign.” When a solid part or a consolidation component is included in the GGO lesions, “mixed blizzard signs”1213 are visible. These signs show diffuse heterogeneity with several hyperechoic dots and vessels (Figure 2). In this study, when the probe was inserted and the aforementioned findings appeared, it was judged that the probe was in the target lesion. However, not only the above-mentioned typical findings, but also various other findings were observed in many lesions. Therefore, when similar or mixed findings were obtained, the probe was considered to have been inserted in the lesion. In this study, R-EBUS-guided TBLB was formally performed after six months of the learning period.
7. Final diagnosis
The final diagnosis was based on the patient's symptoms, clinical course, chest CT, bronchoalveolar lavage (BAL) fluid results (if available), laboratory tests, microbiological results, and the pathology results of the biopsy.
In the final diagnosis, bacterial pneumonia was defined as (1) typical clinical manifestation of pneumonia (fever, increased cough with sputum production, change in the shadow on chest radiography, and increased inflammatory markers) and the presence of bacteria in the microbiological examination; or (2) typical clinical manifestations of pneumonia but negative microbiological results of bacteria, neutrophil predominance in the result of BAL (if available), and improved clinical manifestation following antibiotics treatment. Cryptogenic organizing pneumonia was defined as a case where it was diagnosed through lung biopsy results, and the exclusion of any possible cause (which may be relatively evident or require more laborious etiological tests)14. Secondary organizing pneumonia was defined as a case (1) where it was diagnosed based on the lung biopsy results, showed clinical manifestation and positive results in etiological tests, or (2) where there were pneumonia-like chest radiography findings, lymphocyte predominance was shown in the result of BAL, and the clinical manifestation improved after steroid therapy14. Connective tissue disease (CTD)-associated interstitial lung disease (ILD) was defined as interstitial pneumonia on chest CT in patients with CTD without any evidence of infectious or other lung diseases15. Eosinophilic pneumonia included idiopathic acute eosinophilic pneumonia and chronic eosinophilic pneumonia.
8. TBLB diagnostic yield
The diagnostic yield was defined as the percentage of biopsy results that matched the final diagnosis. When chronic inflammation was indicated in the biopsy results, it was considered non-diagnostic while determining the diagnostic yield. Although most chronic inflammation cases show clinical progression to pneumonia, and TBLB results help rule out other diseases, chronic inflammation is a nonspecific finding and cannot be diagnosed as a specific disease based only on the biopsy result. Organizing pneumonia was considered diagnostic regardless of whether it was secondary or cryptogenic. Malignancy was considered diagnostic when calculating the TBLB diagnostic yield. Further, granulomatous inflammation was considered diagnostic if acid-fast bacilli smear or tuberculosis polymerase chain reaction assay was found to be positive in the biopsy tissue. Interstitial inflammation was considered non-diagnostic, and if the finding suggesting bacterial pneumonia was reported in biopsy results, it was considered diagnostic.
9. TBLB complications
Chest radiography was performed within 3 hours after TBLB to confirm the presence of pneumothorax, and TBLB-related bleeding was also checked. The amount of endobronchial bleeding was classified into four stages, ranging from grade 0 to grade 3. Grade 0 was defined as the condition where there was no need for other procedures because of no or little bleeding after the biopsy. Grade 1 comprised cases where suction was performed because of bleeding after the biopsy; however, other endoscopic procedures were not needed. Grade 2 defined cases where an endoscopic procedure for bronchial occlusion was required because of bleeding after the biopsy, or where ice-cold saline was instilled. Grade 3 included cases of severe bleeding requiring surgical intervention or admission to the intensive care unit for hemodynamic or respiratory instability that could not be managed endoscopically1617.
10. Statistical analyses
The test results were expressed as the absolute values, percentages, as well as mean and standard deviation values for normal continuous variables. The median, maximum and minimum values were calculated for non-normal variables. For comparing the various quantitative factors of the clinical characteristics and the biopsy-related outcomes between the R-EBUS-guided TBLB and blind TBLB groups, the Mann-Whitney U test was used. The qualitative factors and biopsy results of the two groups were compared using the chi-square test. Statistical significance was set at p<0.05. For statistical analyses, SPSS version 25 (IBM Corp., Armonk, NY) was used.
Results
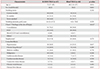
Total 127 patients were included in the study. R-EBUS-guided TBLB was performed for 67 patients, and blind TBLB was performed for 60. The median age of the patients in the R-EBUS-guided TBLB group was 73 years (range, 27–89 years), higher than the median age of 68.5 years (range, 24–87 years) in the blind TBLB group, however, the difference was not statistically significant (p=0.054). There were no differences in the male:female ratio, smoking status, presence of emphysema, and comorbid illnesses between the two groups. In the chest CT findings of the lung lesions where biopsy was performed, consolidation was more frequent in the R-EBUS-guided TBLB group, and GGO was more frequent in the blind TBLB group (p=0.012) (Table 1).
With respect to the procedure time, the median duration in the R-EBUS-guided TBLB group was 21 minutes (range, 10–42 minutes), significantly longer than the median of 15 minutes (range, 8–25 minutes) in the blind TBLB group (p<0.001). There was no difference in the administered dose of midazolam, the sedative used during the procedure, between the two groups (p=0.241). However, the administered dose of the analgesic, fentanyl, was significantly higher in the R-EBUS-guided TBLB group than in the blind TBLB group (p<0.001). In terms of the TBLB location, the right lower lobe was the most common site in both the groups, and there was no difference between the groups. In nine cases, biopsy was performed in two different lobes. The number of BAL tests between the R-EBUS-guided TBLB and blind TBLB groups was similar (p=0.216). The median number of obtained biopsy specimens was 6 (range, 3–13 pieces) in the R-EBUS-guided TBLB group, significantly higher than the median number of 5 (range, 1–8 pieces) in the blind TBLB group (p=0.003). The median size of the obtained biopsy specimens was similar between the two groups (p=0.299) (Table 2).
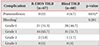
With respect to the procedure-related complications, pneumothorax did not occur in the R-EBUS-guided TBLB group while it was observed in four cases in the blind TBLB group, showing a significantly lower incidence of pneumothorax in the R-EBUS-guided TBLB group (p=0.032). Among the four cases of pneumothorax that occurred in the blind TBLB group, a chest tube was inserted in one case, and the three other cases improved after observation with the administration of oxygen.
Bleeding was comparable in the two groups (p=0.201). There were 21 cases in the R-EBUS-guided TBLB group that did not require other endoscopic procedures (grade 0), and 28 in the blind TBLB group. There were 44 cases requiring suction after the intrabronchial instillation of epinephrine or tranexamic acid (grade 1) in the R-EBUS-guided TBLB group, and 31 in the blind TBLB group. There were two cases with instillation of ice-cold saline due to severe bleeding (grade 2) in the R-EBUS-guided TBLB group and one case in the blind TBLB group. No patient required surgical intervention or admission to the intensive care unit due to endoscopically uncontrolled bleeding (grade 3) in either group (Table 3).
In terms of the biopsy results, chronic inflammation was most common in both groups, followed by organizing pneumonia, malignancy, and granulomatous inflammation (Table 4). There was no statistically significant difference in the biopsy results of the two groups (p=0.385). In terms of the final diagnosis, bacterial pneumonia was the most common diagnosis in both the groups, followed by malignancy, secondary organizing pneumonia, and tuberculosis (Table 5). There was no statistically significant difference in the final diagnosis between the groups (p=0.287). The diagnostic yield was 52.2% in the R-EBUS-guided and 48.3% in the blind TBLB group (p=0.660).
Discussion
Various diseases exhibit DLL findings on chest CT, and distinguishing these diseases is challenging before tissue diagnosis. TBLB is the first procedure that should be performed for the diagnosis of DLLs. TBLB can help diagnose diseases that invade around the terminal and the respiratory bronchioles, such as respiratory bronchiolitis, tuberculosis, lobular infectious pneumonia, and cellular bronchiolitis. Moreover, tissue diagnosis for diseases distributed along the lymphatics, such as sarcoidosis and lymphangitic carcinomatosis, can be established relatively easily with TBLB818. However, when TBLB is performed without fluoroscopic guidance, the practitioner cannot ascertain if the location where the TBLB is performed is the target lesion on chest CT. In this case, if the accurate location information for the lesion can be obtained using R-EBUS, it will be helpful in performing TBLB. Moreover, R-EBUS does not involve radiation hazard and can be easily used with a probe when performing bronchoscopy.
In the study conducted by Descombes et al.19 that analyzed 530 transbronchial biopsy results, the diagnostic yield was 38% when there were 1–3 tissue fragments; however, it was significantly higher at 69% when there were 6–10 tissue fragments. In the R-EBUS-guided TBLB group, there were 6 (range, 3–13) biopsy specimens, while in the blind TBLB group, there were 5 (range, 1–8), showing that a significantly larger number of specimens was obtained in the R-EBUS-guided TBLB group (p=0.003). However, in terms of the diagnostic yield, there was no significant difference between the two groups (p=0.660). This may be attributable to the fact that the difference in the number of tissues used in this study was not large enough to achieve a diagnostic difference, as in the study by Descombes et al.19 (wherein the numbers of tissues were 1–3 vs. 6–10).
The use of same-size biopsy forceps in this study is believed to be a reason for the lack of a difference in the diagnostic yield of DLLs between the two groups. In fact, there was no significant difference in the size of the biopsy specimens obtained between the R-EBUS-guided TBLB and blind TBLB groups. Recently, several studies have reported that transbronchial cryobiopsy in ILD increases the diagnostic yield1720. This is believed to be attributable to the fact that the tissue was significantly larger than the one obtained using conventional forceps. As per the study by Loube et al.21, the large-forceps group can obtain significantly more tissues as compared to the small-forceps group, potentially affecting the diagnostic yield.
The most significant result of this study was the difference in the incidence of the TBLB complication pneumothorax. There was no case of pneumothorax in the R-EBUS-guided TBLB group while four cases were observed in the blind TBLB group, showing that the incidence of pneumothorax was significantly lower in the R-EBUS-guided TBLB group (p=0.032). The incidence of pneumothorax complication due to conventional TBLB has been reported as 5.0%–5.5%2223, and up to 14.3% cases have been reported with the use of mechanical ventilation24. The incidence of total complications caused by R-EBUS-guided TBLB performed in PPLs varies from 0%252627 to 7.4%28. In particular, the incidence of pneumothorax is known to be between 0%25272930 and 5.1%31. As per a meta-analysis of R-EBUS-guided TBLB studies conducted by Steinfort et al.4, the pooled rate of pneumothorax in 14 clinical studies was 1.0% (11 out of 1,090 cases). In the present study on DLLs, the incidence of pneumothorax was also lower in the R-EBUS-guided TBLB group, indicating an apparent advantage of such a procedure.
Biopsy performed at a location <1 cm away from the pleura increases the risk of pneumothorax32. However, if biopsy is performed at a point that is extremely proximal to avoid the occurrence of pneumothorax, the risk of severe bleeding increases. For interstitial lung lesions, performing biopsy closer to the secondary pulmonary lobule (at a more distal location) is known to be appropriate for tissue diagnosis33. Therefore, the location for biopsy performance that allows us to obtain appropriate tissue samples and minimizes the occurrence of pneumothorax and bleeding complications is important. In the present study, the incidence of pneumothorax was low because TBLB was performed in the proximal area, as far away as possible from the pleura, while observing the ultrasound images when performing R-EBUS. Moreover, the frequency of bleeding did not differ between the two groups. This may be because biopsy was performed at 1–1.5 cm distal to the position from where the R-EBUS image was properly observed. Thus, R-EBUS-guided TBLB is considered a safe lung tissue acquisition method that can minimize the occurrence of pneumothorax and bleeding complications. R-EBUS can help determine the appropriate depth of TBLB without complications in the DLLs.
The disadvantage of using R-EBUS-guided TBLB is its prolonged procedure time. The procedure time of the R-EBUS-guided TBLB group was 21 minutes (range, 10–42 minutes); this was significantly longer than the procedure time of 15 minutes (range, 8–25 minutes) in the blind TBLB group. The reason for this longer duration is that the time for observing pulmonary lesion images through R-EBUS was included, and the number of samples for R-EBUS-guided TBLB was higher. Despite the prolonged procedure time of R-EBUS-guided TBLB, there was no difference in the midazolam dose used during the procedure. This is believed to be attributable to the additional use of fentanyl instead of midazolam for appropriate sedation of the patients during R-EBUS-guided TBLB. In the future, if the same number of samples is used for R-EBUS-guided TBLB as those for blind TBLB, the administered fentanyl dose will decrease, reducing the procedure time.
Lichtenstein et al.11 reported that alveolar consolidation in lung ultrasound is an echo structure with a density similar to that of liver parenchyma, and has a tissue-like pattern. In R-EBUS, the interior of the large consolidation was homogenous and appeared to have an isoechoic and tissue-like pattern; the borderline of the consolidation was seen as a hyperechoic shadow (Figure 1). Izumo et al.12 reported that pure GGO was seen as a “blizzard sign” in R-EBUS (i.e., a diffuse hyperintense acoustic shadow). As the solid part of the GGO increased, the proportion of the “mixed blizzard sign” increased, indicating a combination of diffuse heterogeneity with hyperechoic dots, vessels and “blizzard sign.” Based on these findings, it may be possible to determine the precise location for TBLB if R-EBUS images suitable for each lesion type can be observed when the lung lesion is seen as a consolidation, GGO, or a mixed lesion. In this study, TBLB was performed by observing the isoechoic tissue-like pattern or mixed blizzard sign rather than the blizzard sign (Figure 2). The R-EBUS findings that can define ILD lesions including honeycomb or reticular lesions remain unknown; this is a disadvantage of using R-EBUS.
This study has certain limitations. First, it is a retrospective study conducted in a single institution. Further, the number of biopsy specimens at the time of the R-EBUS-guided TBLB was large, and this influenced the procedure time, restricting the comparison of the results obtained under the same condition in the two groups. TBLB was performed without fluoroscopy guidance; this may have partially affected the diagnostic yield of blind TBLB and the incidence of pneumothorax. In addition, in ILD consisting of honeycomb, reticulation or fibrotic lesions, R-EBUS-guided TBLB could not be performed because a proper ultrasound image, could not be obtained; this may be a reason for the non-occurrence of pneumothorax. To address these limitations, prospective studies are required to be conducted in the future.


 XML Download