Journal List > Korean J Radiol > v.20(7) > 1128660

Cho, Chae, Jin, Choi, Lin, Hoffman, Wenzel, Castro, Fain, Jarjour, Schiebler, Barr, Hansel, Cooper, Kleerup, Han, Woodruff, Kanner, Bleecker, Peters, Moore, Lee, Choi, and the National Heart, Lung and Blood Institute's SubPopulations and InteRmediate Outcome Measures In COPD Study (SPIROMICS) and Severe Asthma Research Program (SARP): Structural and Functional Features on Quantitative Chest Computed Tomography in the Korean Asian versus the White American Healthy Non-Smokers

Abstract

Objective

Considering the different prevalence rates of diseases such as asthma and chronic obstructive pulmonary disease in Asians relative to other races, Koreans may have unique airway structure and lung function. This study aimed to investigate unique features of airway structure and lung function based on quantitative computed tomography (QCT)-imaging metrics in the Korean Asian population (Koreans) as compared with the White American population (Whites).

Materials and Methods

QCT data of healthy non-smokers (223 Koreans vs. 70 Whites) were collected, including QCT structural variables of wall thickness (WT) and hydraulic diameter (Dh) and functional variables of air volume, total air volume change in the lung (ΔVair), percent emphysema-like lung (Emph%), and percent functional small airway disease-like lung (fSAD%). Mann-Whitney U tests were performed to compare the two groups.

Results

As compared with Whites, Koreans had smaller volume at inspiration, ΔVair between inspiration and expiration (p < 0.001), and Emph% at inspiration (p < 0.001). Especially, Korean females had a decrease of ΔVair in the lower lobes (p < 0.001), associated with fSAD% at the lower lobes (p < 0.05). In addition, Koreans had smaller Dh and WT of the trachea (both, p < 0.05), correlated with the forced expiratory volume in 1 second (R = 0.49, 0.39; all p < 0.001) and forced vital capacity (R = 0.55, 0.45; all p < 0.001).

Conclusion

Koreans had unique features of airway structure and lung function as compared with Whites, and the difference was clearer in female individuals. Discriminating structural and functional features between Koreans and Whites enables exploration of inter-racial differences of pulmonary disease in terms of severity, distribution, and phenotype.

INTRODUCTION

Ethnicity is an important factor in the prediction of the prevalence of pulmonary disease: The prevalence of asthma is lower in Koreans than in Europeans (1), and among Americans residents of > 10 years' status, Chinese have less prevalence of asthma than do Whites (2). Moreover, the incidence of chronic obstructive pulmonary disease (COPD) is lower in the Western Pacific region than in the American region (3). The different disease prevalence rate in Asians compared to Americans may be associated with their distinct airway structure and lung function; hence, investigating features of the airway and lung is a critical step in understanding the different phenotypes of pulmonary diseases in Asians. The hypothesis of our study was that the quantitative computed tomography (QCT) imaging features of Korean Asians (Koreans) are different from those of White Americans (Whites).
Studies focused on comparative lung function between Asians and Whites have reported findings through genetic and pulmonary function test (PFT): MET-N375S germline mutation in the lung tumors was more frequent in East Asians than in Caucasians (4); total lung capacity (TLC) was larger in Caucasians than in Chinese, but residual volume (RV) had no difference (5). In addition, Whittaker et al. (6) demonstrated that ethnicity is an important predictor of lung function, even among those of similar height.
With regard to QCT imaging, there are few comparative studies including Asians and Whites. Hoffman et al. (7) reported that among the healthy subjects included in their study, Asians had lower emphysema percent than did Whites, but information of additional imaging features such as airway diameter, wall thickness (WT), and registration-derived mechanical metrics was not provided. Recent advancement in QCT techniques enables detection of invisible minimal changes such as those of the luminal diameter and WT (8). Studies have reported the CT features, including increased WT and hydraulic diameter (Dh) in the upper lobes and decreased value of these variables in the lower lobes of patients with severe asthma (9), and decreased normalized Dh in the segmental airways of patients with asthma and those with COPD relative to healthy subjects (10). A study to assess emphysema and functional small airway disease reported the presence of parenchymal change at the voxel level between healthy individuals, patients with asthma, and patients with COPD (10). Another study indicated that registration-derived air volume change in subjects with severe asthma was decreased at the basal lung, associated with increasing air trapping (11).
Studies investigating differences of the segmental structure and lobar function between healthy Koreans and Whites using QCT are needed to clarify the differences of lung function and disease prevalence in these populations. The current study was focused on QCT imaging metrics including an extensive set of multiscale structural and functional features measured at the level of the segmental airways and parenchymal lungs, with the aid of computational techniques (910111213). This study aimed to investigate unique features of airway structure and lung function based on QCT-imaging metrics in the Korean Asian population (Koreans) as compared with the White American population (Whites).

MATERIALS AND METHODS

Korean and White Subjects' Data Set

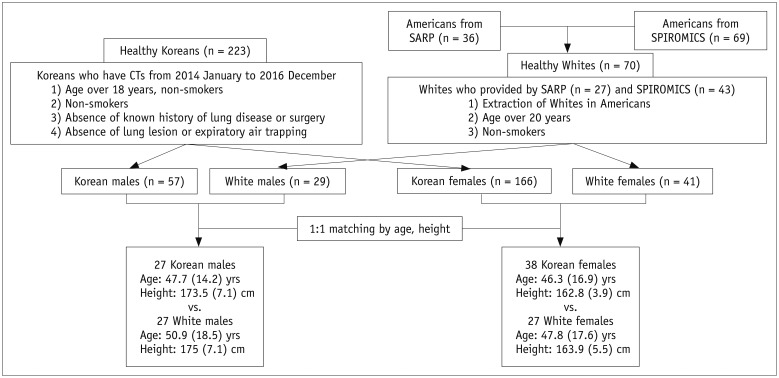
Data of Koreans were collected from Chonbuk National University Hospital (CNUH) and data of Whites were collected from two multicenter studies, parts of the Severe Asthma Research Program (SARP), [University of Pittsburgh, University of Wisconsin, and Washington University in Saint Louis] (14), and SubPopulations and InteRmediate Outcome Measures In COPD Study (SPIROMICS), [Columbia University, Johns Hopkins University, University of California at Los Angeles, University of Michigan, University of California at San Francisco, University of Utah, Wake Forest University] (15). The study was retrospectively designed and approved by the Institutional Review Board at individual sites. Between January 2014 to December 2016, CT datasets of 296 Koreans were collected; inclusion criteria were as follows: 1) age over 18 years; 2) absence of known history of lung disease or surgery; 3) absence of lung lesion or expiratory air trapping on CT images except for some tiny (< 5 mm) benign-looking pulmonary nodules; and 4) PFT reports within 1 week of CT date. Current smokers (n = 40) and former smokers (n = 35) were excluded. Finally, 223 Korean non-smokers were included in the study. Of these, 52 Koreans were part of the previous study of Kim et al. (8). Criteria of the subject selection in SARP and SPIROMICS have been reported (1415).
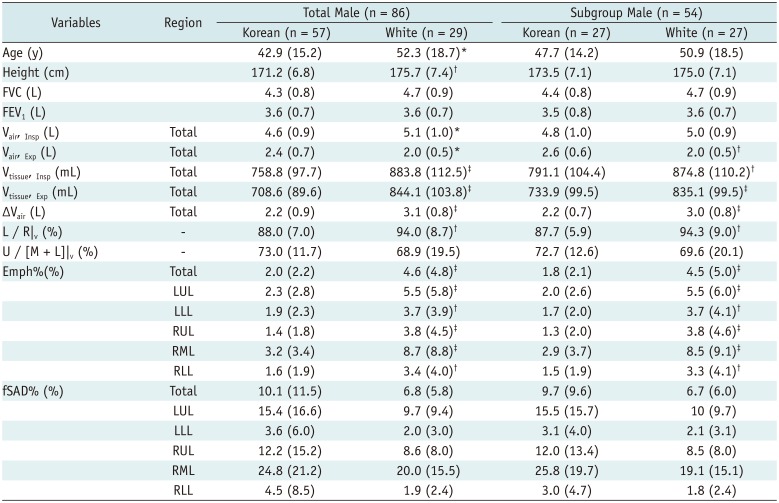
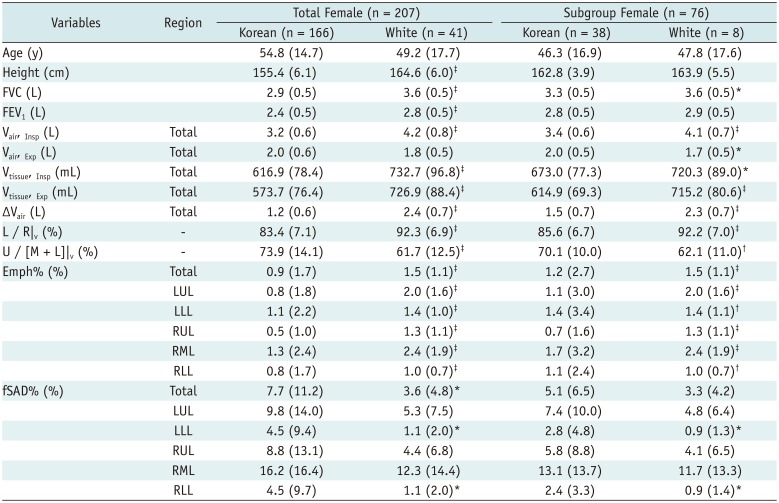
CNUH, SARP, and SPIROMICS had a total number of healthy non-smokers of 223, 36, and 69, respectively. CNUH data consisted of only Koreans, whereas SARP and SPIROMICS data consisted of multiethnic subjects, so we further extracted data of Whites (n = 70) including those of SARP (n = 27) and SPIROMICS (n = 43). Fifty-seven Korean male individuals were compared with 29 White male individuals, and 166 Korean female individuals were compared with 41 White female individuals. To control the variability of sex, age, and height, analysis of covariance (ANCOVA) tests were performed, which are available on (Supplementary Tables 1 and 2). Since sex, age, and height were found to be significantly correlated with imaging metrics, subgroups of Korean and White subjects of similar age range and height were compared (27 Korean male individuals vs. 27 White male individuals; 38 Korean female individuals vs. 38 White female individuals). The flowchart of subject selection is shown in Figure 1. Major criteria used to define healthy subject were as follows (Table 1): 1) inexperienced smoking, 2) % predicted value of forced expiratory volume in 1 second (FEV1) of > 80% and forced vital capacity (FVC) of > 80%, 3) FEV1/FVC of > 70%. PFTs of CNUH, SARP, and SPIROMICS were performed according to the American Thoracic Society guidelines (16).
The imaging protocols between projects are provided in Supplementary Table 3. Inspiratory scans (Insp) were acquired at TLC, whereas expiration scans (Exp) at either functional residual capacity (FRC) or RV. In CNUH and SARP, the Exp were acquired at FRC, whereas those in SPIROMICS at RV. Statistical analysis of the volumetric difference between CT-based FRC and RV is shown in Supplementary Table 4.

QCT Imaging Metrics

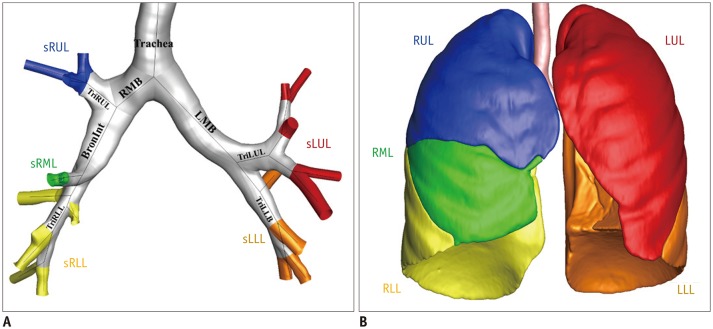
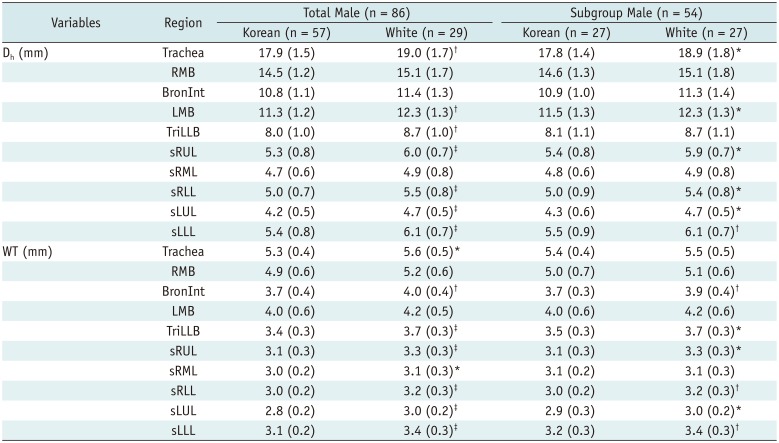
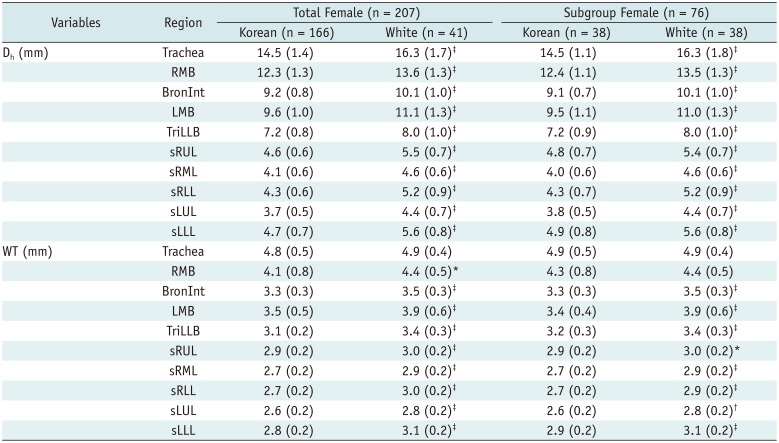
Quantitative analysis of the airways and lobes was performed using Apollo software (VIDA Diagnostics, Coralville, IA, USA) including 39 imaging-based metrics of 20 structural and 19 functional variables at multiscale regions (Fig. 2). For structural variables, WT and Dh were extracted at five central airways and five subgroups of the lobes (Fig. 2A). Dh (4 × luminal area ÷ perimeter of luminal area) was used to assess the non-circular airway shape (9). The five central airways included the trachea, right main bronchus (RMB), bronchus intermedius (BronInt), left main bronchus (LMB), and trifurcation of left lower bronchus (TriLLB); the five subgroups included the right upper lobe (sRUL), right middle lobe (sRML), right lower lobe (sRLL), left upper lobe (sLUL), and left lower lobe (sLLL).
Functional variables included air and tissue volume at in- and expiration (Vair, Insp, Vtissue, Insp, Vair, Exp, and Vtissue, Exp). Imaging registration technique between inspiration and Exp was used to further extract functional variables including the total air volume change in the lung (ΔVair), ratio of the air volume changes at the upper lobes to those at the middle and lower lobes (U / [M + L]|v), and ratio of the air volume changes in the left to those in the right lobes (L / R|v) (1117). Fraction-threshold method was used for percent emphysema-like lung (Emph%), and functional small airway disease-like lung (fSAD%) (18) at the total lung and five lobes (Fig. 2B). In this study, imaging metrics were performed according to Choi et al. (911).

Statistical Analysis

Mann-Whitney U test (19) was used to compare the structural and functional metrics of the segmental airways and lobar/total lung between Korean and White subjects, and the significance level was set to 0.05. Of total 33 statistical tests performed, the false discovery rate was 5.4%. Pearson correlation tests were performed for associations of the imaging variables with inspiratory volume (ΔVair, FEV1, and FVC) among 293 total subjects (223 Koreans and 70 Whites). Software R was used for statistical analyses (20).

RESULTS

Comparison of Functional Variables between Koreans and Whites

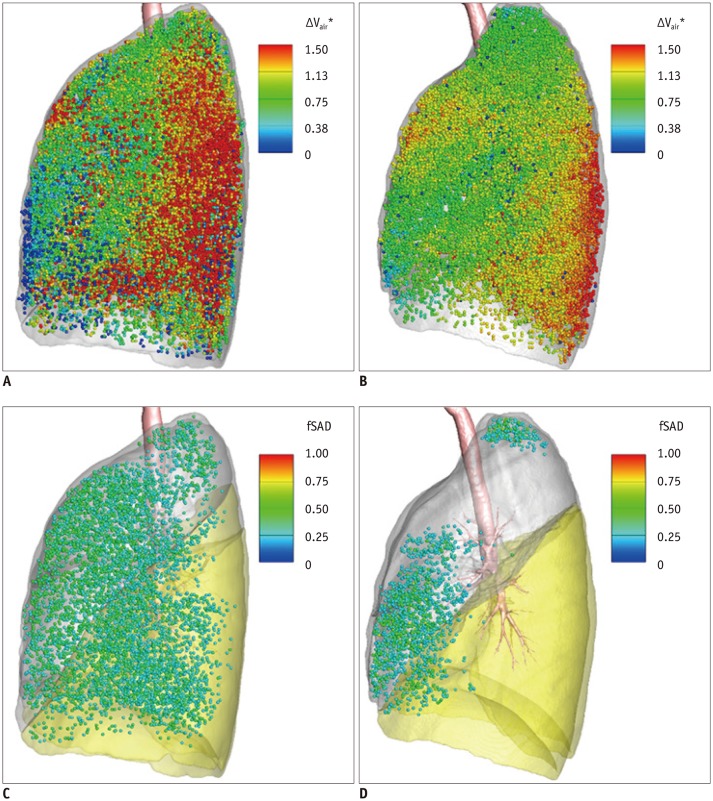
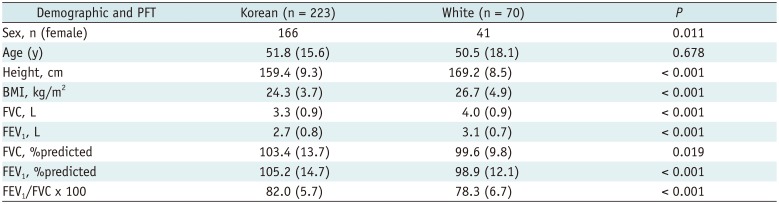
Functional differences between Koreans and Whites are shown in Table 2 (male individuals) and Table 3 (female individuals). The subjects' height and age were significantly different between Koreans and Whites; to eliminate confounding effects, age and height-matched subgroups of male and female individuals were selected to achieve similar distribution between Koreans and Whites. The results of subgroup analyses were consistent with those of the entire samples (Tables 2, 3). Koreans had smaller Vair, Insp, Vtissue, Insp, Vtissue, Exp, and ΔVair, and larger Vair, Exp, compared with Whites in both the male and female subgroups. The L / R|v had decreased value in the Koreans as compared to the Whites in both subgroups (Korean males: 87.7 ± 5.9%, White males: 94.3 ± 9%, p = 0.008, Korean females: 85.6 ± 6.7%, White females: 92.2 ± 7%, p < 0.001), but the U / [M + L]|v had increased value in the female subgroup of Koreans (Korean females: 70.1 ± 10%, White females: 62.1 ± 11%, p = 0.002). The local ΔVair normalized by the median of ΔVair was calculated for Korean female individuals (age, 30 years; height, 160 cm; weight, 58 kg) and White female individuals (age, 23 years; height, 156.5 cm; weight, 53 kg); the distribution of larger ΔVair at the upper lobes and smaller ΔVair at the lower lobes in a representative Korean female subject relative to a representative White female subject is shown in Figure 3A and B. The analysis of correlation of PFT-based FEV1 and FVC values with functional metrics revealed that in the entire cohort (n = 293), the FEV1 and FVC were significantly correlated with the ΔVair (R = 0.55 and 0.64; both p < 0.001) and L / R|v (R = 0.47 and 0.48; both p < 0.001).
The Emph% had smaller value at the total lung and five lobar regions in Koreans compared with values in Whites (total lung; Korean males: 1.8 ± 2.1%, White males: 4.5 ± 5.0%, p < 0.001, Korean females: 1.2 ± 2.7%, White females: 1.5 ± 1.1%, p < 0.001), whereas the fSAD% had greater value in Korean female individuals (LLL; Korean females: 2.8 ± 4.8%, White females: 0.9 ± 1.3%, p = 0.04, RLL; Korean females: 2.4 ± 3.3%, White females: 0.9 ± 1.4%, p = 0.03). The distribution of fSAD-like regions in Korean vs. White subjects is shown in Figure 3C and D; total fSAD% of the subjects was 13.9% and 2.0%, respectively, and fSAD-like lung portion had greater distribution at both lower lobes in Korean female subjects, compared with that of White female subjects (p < 0.02 at LLL and RLL).

Structural Comparison and Correlation with Inspiratory Volume

Structural metrics of Dh and WT were compared between Koreans and Whites (Tables 4, 5) at five central airways and subgroups of regions (sLUL, sLLL, sRUL, sRML, and sRLL). The Dh of Korean female subjects was smaller than that of Whites at the central airways and subgroups of regions (p < 0.001 for all), whereas the Dh of Korean male subjects was smaller except at the RMB, BronInt, and sRML. Compared with Whites, the tracheal WT and RMB of Koreans were similar, but significantly smaller at most of the airways in Koreans. The difference of WT between Whites and Koreans was greater in female than in male subjects, which was a consistent finding through age-and-height-matching. Correlation analysis of Dh and WT with functional metrics of ΔVair, FEV1, and FVC in the entire cohort (n = 293) revealed that the Dh in the trachea was significantly correlated with the ΔVair, FEV1, and FVC (R = 0.60, 0.49, and 0.55; all p < 0.001); the tracheal WT was significantly correlated with the ΔVair, FEV1, and FVC (0.41, 0.39, and 0.45; all p < 0.001).

DISCUSSION

Functional differences in the lungs by race were usually investigated through spirometry or on the basis of genetics (456). Advanced QCT imaging analysis and collaboration between Korea and the USA enabled exploration of structural and functional differences between Koreans and Whites at a multiscale level. To the best of our knowledge, this is the first comparative study of airway structure and lung function in Koreans versus Whites. QCT allows a clear understanding of the physiology of airway structure and lung function according to race, which may not be explained through only spirometry and genetics. For more reliable analyses, Koreans and Whites were categorized into subgroups to control the variability of sex, height, and age due to sample distribution.
The QCT imaging metrics demonstrated that Koreans had different features of lung function than Whites: Koreans had smaller Vtissue, Insp and Vtissue, Exp, compared with Whites, which under the assumption of equal tissue density, indicated that the lung had smaller mass (weight) in Koreans; with regard to the air volume, Koreans had smaller Vair, Insp and larger Vair, Exp, leading to smaller ΔVair, and the ΔVair was significantly correlated with the FEV1 and FVC (R = 0.55, 0.64). These findings can be explained by the results of a previous PFT-based study of the functional differences between Asians and Whites (5) which indicated that Chinese had smaller TLC compared to Whites. Another study reported a decreased value of the pulmonary-function indices FEV1 and FVC in Asian-Americans (21), which could explain the decrease of ΔVair in Koreans. Our results showed that Koreans have a decrease of L / R|v, suggesting that Koreans may use more ventilation of the right lung than the left lung when breathing. This is associated with lower Vair, Insp in Koreans, so they had a decreased ΔVair of left lung relative to the right lung. Koreans had significantly lower Emph% considered an indicator of the presence of emphysema-like lung, at the entire lobes than Whites; similarly, the study of Multi-Ethnic Study of Atherosclerosis (MESA) of Hoffman et al. (7) reported that Asians had lower emphysema score than Whites.
Regarding airway structures, Koreans had significantly decreased Dh and WT at the proximal airways as compared to Whites. The Dh and WT measured at the level of inspiration showed significant correlation with the functional metrics of ΔVair, FEV1, and FVC, which is similar to the finding of correlation of the normalized Dh with FEV1 %predicted, and FEV1/FVC values reported through a study including healthy individuals and patients with asthma (9). In our study using a QCT and PFT-based approach, the results through subgroup analysis of the healthy non-smokers confirmed that the reduction of airway diameter was associated with the reduced air volume changes.
For more reliable quantitative analysis, the male and female subjects were divided to dissociate the sex-related effect of airway dimension and lung size. Compared with Whites, Koreans of the female but not male subgroup showed decreased Dh and WT at the proximal airway regions, as well as increased fSAD% and decreased air volume change at the lower lobes (U / [M + L]|v). The finding of reduced air volume change may be due to structural difference of the airways such as smaller Dh and WT in Korean female individuals than in White female individuals; these features could be associated with hormonal or environmental effect of the female sex (2223).
This study has some limitations. First, this was a retrospective study including Koreans from a single center (residing in a nearby region); hence, the findings might be affected by specific environmental influences (dust, gas, and fumes), so that Korean subjects employed in this study might not represent entire Korean population. A prospective multinational and multicenter study with larger number of subjects is required to confirm our results. Second, the scanners, scanning parameters, coaching compliance varied according to centers and subjects (Supplementary Table 3), which may have led to variation in the values of fSAD% and Emph%. Nevertheless, our findings such as the differences of airway size and air volume change can be considered as reliable, because similar finding of air volume change between Koreans and Whites was reported by a previous study using PFT-based approach (521). Fraction-threshold methods were used in our study to control the intersite variability of Emph% and fSAD% (11), and the results obtained combined with those of the MESA study clearly indicated that Koreans had significantly decreased Emph% compared to Whites (7).
In conclusion, QCT imaging metrics revealed several unique structural and functional features of Koreans as compared with Whites, which may be associated with the differences of PFT and disease prevalence or manifestation. Differentiating structural and functional features between Koreans and Whites enables further exploration of inter-racial differences of pulmonary disease in terms of severity, distribution, and phenotype. Further studies including more subjects with a genetic approach are necessary to fully understand the differences in lung function and airway structure according to ethnicity, which is a key to the differences in disease prevalence or therapeutic response. The findings obtained would enable development of personalized medicine.

Notes

This study was supported by the Korea Ministry of Environment (MOE) as “The Environmental Health Action Program” [RE201806039, and RE201806027], Basic Science Research Program through the National Research Foundation of Korea funded by the Ministry of Education [NRF-2017R1D1A1B03034157, and NRF-2016R1D1A1B03936078], and National Institutes of Health (NIH) [S10 RR022421, U01 HL114494, U10 HL109152-04, 109257-04, 109168-04, 109172-04, 109046-04, 109250-05, 109164, 109086-04, and HHSN268200900013C, 268200900014C, 268200900015C, 268200900016C, 268200900017C, 268200900018C, 268200900019C, 268200900020C].

Conflicts of Interest: Eric A. Hoffman is a shareholder in VIDA diagnostics, a company that is commercializing lung image analysis software derived by the University of Iowa lung imaging group. He is also a member of the Siemens CT advisory board. Sean B. Fain receives grant funding from GE Healthcare. Mark L. Schiebler is a shareholder in Stemina Biomarker Discovery, Inc. and Healthmyne, Inc.

References

1. Song WJ, Kang MG, Chang YS, Cho SH. Epidemiology of adult asthma in Asia: toward a better understanding. Asia Pac Allergy. 2014; 4:75–85. PMID: 24809012.
crossref
2. Iqbal S, Oraka E, Chew GL, Flanders WD. Association between birthplace and current asthma: the role of environment and acculturation. Am J Public Health. 2014; 104(Suppl 1):S175–S182. PMID: 24354818.
crossref
3. Adeloye D, Chua S, Lee C, Basquill C, Papana A, Theodoratou E, et al. Global Health Epidemiology Reference Group (GHERG). Global and regional estimates of COPD prevalence: systematic review and meta-analysis. J Glob Health. 2015; 5:020415. PMID: 26755942.
crossref
4. Krishnaswamy S, Kanteti R, Duke-Cohan JS, Loganathan S, Liu W, Ma PC, et al. Ethnic differences and functional analysis of MET mutations in lung cancer. Clin Cancer Res. 2009; 15:5714–5723. PMID: 19723643.
crossref
5. Yang TS, Peat J, Keena V, Donnelly P, Unger W, Woolcock A. A review of the racial differences in the lung function of normal Caucasian, Chinese and Indian subjects. Eur Respir J. 1991; 4:872–880. PMID: 1955009.
6. Whittaker AL, Sutton AJ, Beardsmore CS. Are ethnic differences in lung function explained by chest size? Arch Dis Child Fetal Neonatal Ed. 2005; 90:F423–F428. PMID: 15871993.
crossref
7. Hoffman EA, Ahmed FS, Baumhauer H, Budoff M, Carr JJ, Kronmal R, et al. Variation in the percent of emphysema-like lung in a healthy, nonsmoking multiethnic sample. The MESA lung study. Ann Am Thorac Soc. 2014; 11:898–907. PMID: 24983825.
crossref
8. Kim SS, Jin GY, Li YZ, Lee JE, Shin HS. CT quantification of lungs and airways in normal Korean subjects. Korean J Radiol. 2017; 18:739–748. PMID: 28670169.
crossref
9. Choi S, Hoffman EA, Wenzel SE, Castro M, Fain SB, Jarjour NN, et al. Quantitative assessment of multiscale structural and functional alterations in asthmatic populations. J Appl Physiol (1985). 2015; 118:1286–1298. PMID: 25814641.
crossref
10. Choi S, Haghighi B, Choi J, Hoffman EA, Comellas AP, Newell JD, et al. Differentiation of quantitative CT imaging phenotypes in asthma versus COPD. BMJ Open Respir Res. 2017; 4:e000252.
crossref
11. Choi S, Hoffman EA, Wenzel SE, Tawhai MH, Yin Y, Castro M, et al. Registration-based assessment of regional lung function via volumetric CT images of normal subjects vs. severe asthmatics. J Appl Physiol (1985). 2013; 115:730–742. PMID: 23743399.
crossref
12. Choi S, Hoffman EA, Wenzel SE, Castro M, Lin CL. Improved CT-based estimate of pulmonary gas trapping accounting for scanner and lung-volume variations in a multicenter asthmatic study. J Appl Physiol (1985). 2014; 117:593–603. PMID: 25103972.
crossref
13. Choi S, Hoffman EA, Wenzel SE, Castro M, Fain S, Jarjour N, et al. National Heart, Lung and Blood Institute's Severe Asthma Research Program. Quantitative computed tomographic imaging-based clustering differentiates asthmatic subgroups with distinctive clinical phenotypes. J Allergy Clin Immunol. 2017; 140:690–700.e8. PMID: 28143694.
crossref
14. Moore WC, Bleecker ER, Curran-Everett D, Erzurum SC, Ameredes BT, Bacharier L, et al. National Heart, Lung, Blood Institute's Severe Asthma Research Program. Characterization of the severe asthma phenotype by the National Heart, Lung, and Blood Institute's Severe Asthma Research Program. J Allergy Clin Immunol. 2007; 119:405–413. PMID: 17291857.
crossref
15. Couper D, LaVange LM, Han M, Barr RG, Bleecker E, Hoffman EA, et al. SPIROMICS Research Group. Design of the Subpopulations and Intermediate Outcomes in COPD Study (SPIROMICS). Thorax. 2014; 69:491–494.
16. Crapo RO, Hankinson JL, Irvin C, Maclntyre NR, Voter KZ, Wise RA, et al. Standardization of Spirometry, 1994 update. American Thoracic Society. Am J Respir Crit Care Med. 1995; 152:1107–1136. PMID: 7663792.
crossref
17. Jahani N, Choi S, Choi J, Iyer K, Hoffman EA, Lin CL. Assessment of regional ventilation and deformation using 4D-CT imaging for healthy human lungs during tidal breathing. J Appl Physiol (1985). 2015; 119:1064–1074. PMID: 26316512.
crossref
18. Hoff BA, Pompe E, Galbán S, Postma DS, Lammers JJ, Ten Hacken NHT, et al. CT-based local distribution metric improves characterization of COPD. Sci Rep. 2017; 7:2999. PMID: 28592874.
crossref
19. Mann HB, Whitney DR. On a test of whether one of two random variables is stochastically larger than the other. Ann Math Statist. 1947; 18:50–60.
crossref
20. Lawrence MA. Easy analysis and visualization of factorial experiments. R package version 4.1-1. 2012. Available at: https://cran.r-project.org/web/packages/ez/ez.pdf.
21. Korotzer B, Ong S, Hansen JE. Ethnic differences in pulmonary function in healthy nonsmoking Asian-Americans and European-Americans. Am J Respir Crit Care Med. 2000; 161(4 Pt 1):1101–1108. PMID: 10764297.
crossref
22. Becklake MR, Kauffmann F. Gender differences in airway behaviour over the human life span. Thorax. 1999; 54:1119–1138. PMID: 10567633.
crossref
23. Peat JK, Salome CM, Woolcock AJ. Factors associated with bronchial hyperresponsiveness in Australian adults and children. Eur Respir J. 1992; 5:921–929. PMID: 1426199.

Supplementary Materials

The Data Supplement is available with this article at https://doi.org/10.3348/kjr.2019.0083.

SUPPLEMENTARY MATERIALS

kjr-20-1236-s001.pdf

Supplementary Table 1

ANCOVA Tests of QCT-Based Functional Variables with Race (Korean vs. White), Sex, Height, and Age
kjr-20-1236-s002.pdf

Supplementary Table 2

ANCOVA Tests of QCT-Based Structural Variables with Race (Korean vs. White), Sex, Height, and Age
kjr-20-1236-s003.pdf

Supplementary Table 3

Scanner-Specific Protocol Settings for CNUH, SARP, and SPIROMICS
kjr-20-1236-s004.pdf

Supplementary Table 4

Comparison of Expiratory Measurements between SARP (FRC) and SPIROMICS (RV)
kjr-20-1236-s005.pdf
Fig. 1

Flow chart of subject selection of male and female subgroups.

Values are presented as mean (standard deviation). COPD = chronic obstructive pulmonary disease, SARP = Severe Asthma Research Program, SPIROMICS = SubPopulations and InteRmediate Outcome Measures In COPD Study
kjr-20-1236-g001
Fig. 2

A. Five central airways and five subgroups of segmental airway. B. Frontal view of color-coded five lobes.

Hydraulic diameter and wall thickness included regions in A. Percent emphysema-like lung and percent fSAD involved regions in B. BronInt = bronchus intermedius, fSAD = functional small airway disease-like lung, LLL = left lower lobe, LMB = left main bronchus, LUL = left upper lobe, RLL = right lower lobe, RMB = right main bronchus, RML = right middle lobe, RUL = right upper lobe, sLLL = subgrouped LLL including branches of LB6 and LB8 to LB10, sLUL = subgrouped LUL including branches of LB1 to LB5, sRLL = subgrouped RLL including branches of RB6 to RB10, sRML = subgrouped RML including branches of RB4 and RB5, sRUL = subgrouped RUL including branches of RB1 to RB3, TriLLB = trifurcation of left lower bronchus,TriLUL = trifurcation of LUB, TriRLL = trifurcation of RLL, TriRUL = trifurcation of RUB
kjr-20-1236-g002
Fig. 3

Distribution of ΔVair* (A, B), and fSAD in Korean (left column) and White female (right column) samples (C, D).

Left lateral view is shown, and each cube represents average of about 1000 voxels; voxels in C and D are labeled as 0 (non-fSAD) to 1 (fSAD). ΔVair* = air volume change normalized by median value
kjr-20-1236-g003
Table 1

Demographic and PFT Information of Koreans and Whites

kjr-20-1236-i001
Demographic and PFT Korean (n = 223) White (n = 70) P
Sex, n (female) 166 41 0.011
Age (y) 51.8 (15.6) 50.5 (18.1) 0.678
Height, cm 159.4 (9.3) 169.2 (8.5) > 0.001
BMI, kg/m2 24.3 (3.7) 26.7 (4.9) > 0.001
FVC, L 3.3 (0.9) 4.0 (0.9) > 0.001
FEV1, L 2.7 (0.8) 3.1 (0.7) > 0.001
FVC, %predicted 103.4 (13.7) 99.6 (9.8) 0.019
FEV1, %predicted 105.2 (14.7) 98.9 (12.1) > 0.001
FEV1/FVC x 100 82.0 (5.7) 78.3 (6.7) > 0.001

Values are presented as mean (SD). BMI = body mass index, FEV1 = forced expiratory volume in 1 second, FVC = forced vital capacity, PFT = pulmonary function test, SD = standard deviation

Table 2

Comparison of PFT Information and Functional Variables between Korean Male Subjects and White Male Subjects

kjr-20-1236-i002
Variables Region Total Male (n = 86) Subgroup Male (n = 54)
Korean (n = 57) White (n = 29) Korean (n = 27) White (n = 27)
Age (y) 42.9 (15.2) 52.3 (18.7)* 47.7 (14.2) 50.9 (18.5)
Height (cm) 171.2 (6.8) 175.7 (7.4) 173.5 (7.1) 175.0 (7.1)
FVC (L) 4.3 (0.8) 4.7 (0.9) 4.4 (0.8) 4.7 (0.9)
FEV1 (L) 3.6 (0.7) 3.6 (0.7) 3.5 (0.8) 3.6 (0.7)
Vair, Insp (L) Total 4.6 (0.9) 5.1 (1.0)* 4.8 (1.0) 5.0 (0.9)
Vair, Exp (L) Total 2.4 (0.7) 2.0 (0.5)* 2.6 (0.6) 2.0 (0.5)
Vtissue, Insp (mL) Total 758.8 (97.7) 883.8 (112.5) 791.1 (104.4) 874.8 (110.2)
Vtissue, Exp (mL) Total 708.6 (89.6) 844.1 (103.8) 733.9 (99.5) 835.1 (99.5)
ΔVair (L) Total 2.2 (0.9) 3.1 (0.8) 2.2 (0.7) 3.0 (0.8)
L / R|v (%) - 88.0 (7.0) 94.0 (8.7) 87.7 (5.9) 94.3 (9.0)
U / [M + L]|v (%) - 73.0 (11.7) 68.9 (19.5) 72.7 (12.6) 69.6 (20.1)
Emph%(%) Total 2.0 (2.2) 4.6 (4.8) 1.8 (2.1) 4.5 (5.0)
LUL 2.3 (2.8) 5.5 (5.8) 2.0 (2.6) 5.5 (6.0)
LLL 1.9 (2.3) 3.7 (3.9) 1.7 (2.0) 3.7 (4.1)
RUL 1.4 (1.8) 3.8 (4.5) 1.3 (2.0) 3.8 (4.6)
RML 3.2 (3.4) 8.7 (8.8) 2.9 (3.7) 8.5 (9.1)
RLL 1.6 (1.9) 3.4 (4.0) 1.5 (1.9) 3.3 (4.1)
fSAD% (%) Total 10.1 (11.5) 6.8 (5.8) 9.7 (9.6) 6.7 (6.0)
LUL 15.4 (16.6) 9.7 (9.4) 15.5 (15.7) 10 (9.7)
LLL 3.6 (6.0) 2.0 (3.0) 3.1 (4.0) 2.1 (3.1)
RUL 12.2 (15.2) 8.6 (8.0) 12.0 (13.4) 8.5 (8.0)
RML 24.8 (21.2) 20.0 (15.5) 25.8 (19.7) 19.1 (15.1)
RLL 4.5 (8.5) 1.9 (2.4) 3.0 (4.7) 1.8 (2.4)

Values are presented as mean (SD). *p < 0.05, p < 0.01, p < 0.001. Emph% = percent emphysema-like lung, fSAD% = percent functional small airway disease-like lung, LLL = left lower lobe, L / R|v = ratio of air volume changes in left to those in right lobes, LUL = left upper lobe, RLL = right lower lobe, RML = right middle lobe, RUL = right upper lobe, U / [M + L]|v = ratio of air volume changes at upper lobes to those at middle and lower lobes, Vair, Exp = air volume at expiration, Vair, Insp = air volume at inspiration, Vtissue, Exp = tissue volume at expiration, Vtissue, Insp = tissue volume at inspiration, ΔVair = total air volume change in lung

Table 3

Comparison of PFT Information and Functional Variables between Korean Female Subjects and White Female Subjects

kjr-20-1236-i003
Variables Region Total Female (n = 207) Subgroup Female (n = 76)
Korean (n = 166) White (n = 41) Korean (n = 38) White (n = 8)
Age (y) 54.8 (14.7) 49.2 (17.7) 46.3 (16.9) 47.8 (17.6)
Height (cm) 155.4 (6.1) 164.6 (6.0) 162.8 (3.9) 163.9 (5.5)
FVC (L) 2.9 (0.5) 3.6 (0.5) 3.3 (0.5) 3.6 (0.5)*
FEV1 (L) 2.4 (0.5) 2.8 (0.5) 2.8 (0.5) 2.9 (0.5)
Vair, Insp (L) Total 3.2 (0.6) 4.2 (0.8) 3.4 (0.6) 4.1 (0.7)
Vair, Exp (L) Total 2.0 (0.6) 1.8 (0.5) 2.0 (0.5) 1.7 (0.5)*
Vtissue, Insp (mL) Total 616.9 (78.4) 732.7 (96.8) 673.0 (77.3) 720.3 (89.0)*
Vtissue, Exp (mL) Total 573.7 (76.4) 726.9 (88.4) 614.9 (69.3) 715.2 (80.6)
ΔVair (L) Total 1.2 (0.6) 2.4 (0.7) 1.5 (0.7) 2.3 (0.7)
L / R|v (%) - 83.4 (7.1) 92.3 (6.9) 85.6 (6.7) 92.2 (7.0)
U / [M + L]|v (%) - 73.9 (14.1) 61.7 (12.5) 70.1 (10.0) 62.1 (11.0)
Emph% (%) Total 0.9 (1.7) 1.5 (1.1) 1.2 (2.7) 1.5 (1.1)
LUL 0.8 (1.8) 2.0 (1.6) 1.1 (3.0) 2.0 (1.6)
LLL 1.1 (2.2) 1.4 (1.0) 1.4 (3.4) 1.4 (1.1)
RUL 0.5 (1.0) 1.3 (1.1) 0.7 (1.6) 1.3 (1.1)
RML 1.3 (2.4) 2.4 (1.9) 1.7 (3.2) 2.4 (1.9)
RLL 0.8 (1.7) 1.0 (0.7) 1.1 (2.4) 1.0 (0.7)
fSAD% (%) Total 7.7 (11.2) 3.6 (4.8)* 5.1 (6.5) 3.3 (4.2)
LUL 9.8 (14.0) 5.3 (7.5) 7.4 (10.0) 4.8 (6.4)
LLL 4.5 (9.4) 1.1 (2.0)* 2.8 (4.8) 0.9 (1.3)*
RUL 8.8 (13.1) 4.4 (6.8) 5.8 (8.8) 4.1 (6.5)
RML 16.2 (16.4) 12.3 (14.4) 13.1 (13.7) 11.7 (13.3)
RLL 4.5 (9.7) 1.1 (2.0)* 2.4 (3.3) 0.9 (1.4)*

Values are presented as mean (SD). *p < 0.05, p < 0.01, p < 0.001.

Table 4

Comparison of Structural Variables between Korean Male Subjects and White Male Subjects

kjr-20-1236-i004
Variables Region Total Male (n = 86) Subgroup Male (n = 54)
Korean (n = 57) White (n = 29) Korean (n = 27) White (n = 27)
Dh (mm) Trachea 17.9 (1.5) 19.0 (1.7) 17.8 (1.4) 18.9 (1.8)*
RMB 14.5 (1.2) 15.1 (1.7) 14.6 (1.3) 15.1 (1.8)
BronInt 10.8 (1.1) 11.4 (1.3) 10.9 (1.0) 11.3 (1.4)
LMB 11.3 (1.2) 12.3 (1.3) 11.5 (1.3) 12.3 (1.3)*
TriLLB 8.0 (1.0) 8.7 (1.0) 8.1 (1.1) 8.7 (1.1)
sRUL 5.3 (0.8) 6.0 (0.7) 5.4 (0.8) 5.9 (0.7)*
sRML 4.7 (0.6) 4.9 (0.8) 4.8 (0.6) 4.9 (0.8)
sRLL 5.0 (0.7) 5.5 (0.8)‡ 5.0 (0.9) 5.4 (0.8)*
sLUL 4.2 (0.5) 4.7 (0.5) 4.3 (0.6) 4.7 (0.5)*
sLLL 5.4 (0.8) 6.1 (0.7) 5.5 (0.9) 6.1 (0.7)
WT (mm) Trachea 5.3 (0.4) 5.6 (0.5)* 5.4 (0.4) 5.5 (0.5)
RMB 4.9 (0.6) 5.2 (0.6) 5.0 (0.7) 5.1 (0.6)
BronInt 3.7 (0.4) 4.0 (0.4) 3.7 (0.3) 3.9 (0.4)
LMB 4.0 (0.6) 4.2 (0.5) 4.0 (0.6) 4.2 (0.6)
TriLLB 3.4 (0.3) 3.7 (0.3) 3.5 (0.3) 3.7 (0.3)*
sRUL 3.1 (0.3) 3.3 (0.3) 3.1 (0.3) 3.3 (0.3)*
sRML 3.0 (0.2) 3.1 (0.3)* 3.1 (0.2) 3.1 (0.3)
sRLL 3.0 (0.2) 3.2 (0.3) 3.0 (0.2) 3.2 (0.3)
sLUL 2.8 (0.2) 3.0 (0.2) 2.9 (0.3) 3.0 (0.2)*
sLLL 3.1 (0.2) 3.4 (0.3) 3.2 (0.3) 3.4 (0.3)

Values are presented as mean (SD). *p < 0.05, p < 0.01, p < 0.001. BronInt = bronchus intermedius, Dh = hydraulic diameter, LMB = left main bronchus, RMB = right main bronchus, sLLL = subgrouped LLL including branches of LB6 and LB8 to LB10, sLUL = subgrouped LUL including branches of LB1 to LB5, sRLL = subgrouped RLL including branches of RB6 to RB10, sRML = subgrouped RML including branches of RB4 and RB5, sRUL = subgrouped RUL including branches of RB1 to RB3, TriLLB = trifurcation of left lower bronohus, WT = wall thickness

Table 5

Comparison of Structural Variables between Korean Female Subjects and White Female Subjects

kjr-20-1236-i005
Variables Region Total Female (n = 207) Subgroup Female (n = 76)
Korean (n = 166) White (n = 41) Korean (n = 38) White (n = 38)
Dh (mm) Trachea 14.5 (1.4) 16.3 (1.7) 14.5 (1.1) 16.3 (1.8)
RMB 12.3 (1.3) 13.6 (1.3) 12.4 (1.1) 13.5 (1.3)
BronInt 9.2 (0.8) 10.1 (1.0) 9.1 (0.7) 10.1 (1.0)
LMB 9.6 (1.0) 11.1 (1.3) 9.5 (1.1) 11.0 (1.3)
TriLLB 7.2 (0.8) 8.0 (1.0) 7.2 (0.9) 8.0 (1.0)
sRUL 4.6 (0.6) 5.5 (0.7) 4.8 (0.7) 5.4 (0.7)
sRML 4.1 (0.6) 4.6 (0.6) 4.0 (0.6) 4.6 (0.6)
sRLL 4.3 (0.6) 5.2 (0.9) 4.3 (0.7) 5.2 (0.9)
sLUL 3.7 (0.5) 4.4 (0.7) 3.8 (0.5) 4.4 (0.7)
sLLL 4.7 (0.7) 5.6 (0.8) 4.9 (0.8) 5.6 (0.8)
WT (mm) Trachea 4.8 (0.5) 4.9 (0.4) 4.9 (0.5) 4.9 (0.4)
RMB 4.1 (0.8) 4.4 (0.5)* 4.3 (0.8) 4.4 (0.5)
BronInt 3.3 (0.3) 3.5 (0.3) 3.3 (0.3) 3.5 (0.3)
LMB 3.5 (0.5) 3.9 (0.6) 3.4 (0.4) 3.9 (0.6)
TriLLB 3.1 (0.2) 3.4 (0.3) 3.2 (0.3) 3.4 (0.3)
sRUL 2.9 (0.2) 3.0 (0.2) 2.9 (0.2) 3.0 (0.2)*
sRML 2.7 (0.2) 2.9 (0.2) 2.7 (0.2) 2.9 (0.2)
sRLL 2.7 (0.2) 3.0 (0.2) 2.7 (0.2) 2.9 (0.2)
sLUL 2.6 (0.2) 2.8 (0.2) 2.6 (0.2) 2.8 (0.2)
sLLL 2.8 (0.2) 3.1 (0.2) 2.9 (0.2) 3.1 (0.2)

Values are presented as mean (SD). *p < 0.05, p < 0.01, p < 0.001

TOOLS
Similar articles