

 PDF
PDF ePub
ePub Citation
 Print
Print


INTRODUCTION
In the new eighth edition of the lung cancer staging system, the T descriptor is further subdivided, and every centimeter difference can result in a change in the tumor stage (1). Therefore, precise and consistent measurement of lesion size on CT has become critical for preoperative clinical staging of lung cancer.
Since the pathologic T-stage is theoretically determined by the longest diameter of the lesion on the resected specimen, size measurement on CT needs to be performed using multiplanar reconstructions (MPR) to accurately reflect tumor size. In this regard, the Fleischner Society has emphasized that MPR in the coronal and sagittal planes should be used when assessing nodule size, in addition to transverse plane images (2). Interestingly, the Fleischner Society does not recommend oblique reformations because of concerns regarding the ability to reproduce the same degree of obliquity during follow-up. However, the diameter in three-dimensional (3D) space containing the longest axis of the 3D tumor volume may show the best correlation with the measurement of the longest dimension of the resected specimen in pathologic examinations.
Several studies have been conducted to determine an accurate and coherent method for tumor size measurement (3456). Heidinger et al. (4) reported that for solid lung adenocarcinomas ≤ 30 mm, the long-axis CT diameter better reflects the pathologic T-stage than the average of the long and short diameters. Ridge et al. (6) showed that combining MPR measurement with axial measurement of lung cancers resulted in upstaging of T-stage by about 20% for two readers using the seventh edition of the lung cancer staging system. However, the application of MPR measurement led to slightly decreased agreement between CT-defined and pathologic stages, and between observers.
Recently, using the eighth edition of the lung cancer staging system, Ahn et al. (7) demonstrated that MPR measurement was similar to axial measurements in terms of diagnostic accuracy and interobserver agreement. However, they included only subsolid nodules of pathologically confirmed T1 stages.
Since MPR measurements in routine lung cancer work-up require more time and effort, the potential diagnostic improvements should be verified in a large population including all the various T-stages in the eighth edition of the lung cancer staging system; this would facilitate wide acceptance of MPR measurements. Therefore, the purpose of this study was to retrospectively investigate whether tumor size assessment on MPR CT images better reflects the pathologic T-stage than evaluation on axial images and to evaluate the additional value of measurements in 3D space.
MATERIALS AND METHODS
This retrospective study was approved by the Institutional Review Board of our center, which waived the requirement for patients' informed consent (approval number: 2018-0519).
Study Population
A retrospective search of the electronic medical records of our hospital between June 2013 and November 2016 was performed by one radiologist (with 2 years of experience in chest CT). A total of 1661 patients who had undergone preoperative chest CT within 30 days before surgical resection of primary lung cancer were identified.
Patients were enrolled on the basis of the following criteria: 1) available thin-section axial chest CT data (slice thickness, 1–1.25 mm) that could be reformatted to sagittal and coronal planes (2891011); 2) lung cancers manifesting as solid nodules on CT; and 3) no history of neoadjuvant chemotherapy or radiotherapy. Lung cancers that were not clearly marginated due to accompanying lung parenchymal collapse or a central location were excluded by two radiologists (with 2 and 16 years' experience in chest CT, respectively) in consensus.
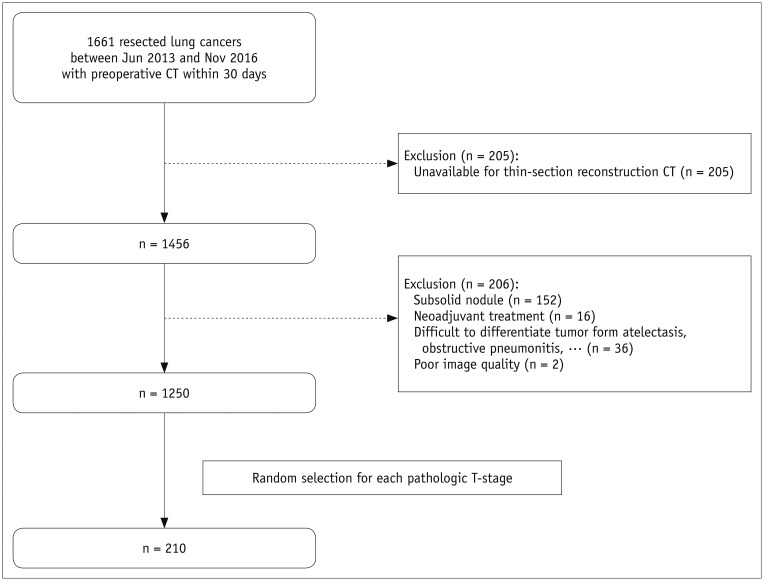
From the 1250 patients identified as meeting the study criteria, 30 were randomly selected from each pathologic T-stage (T1a, T1b, T1c, T2a, T2b, T3, and T4) by using a pseudo-random number generating algorithm. Figure 1 presents the acquisition process for the study population.
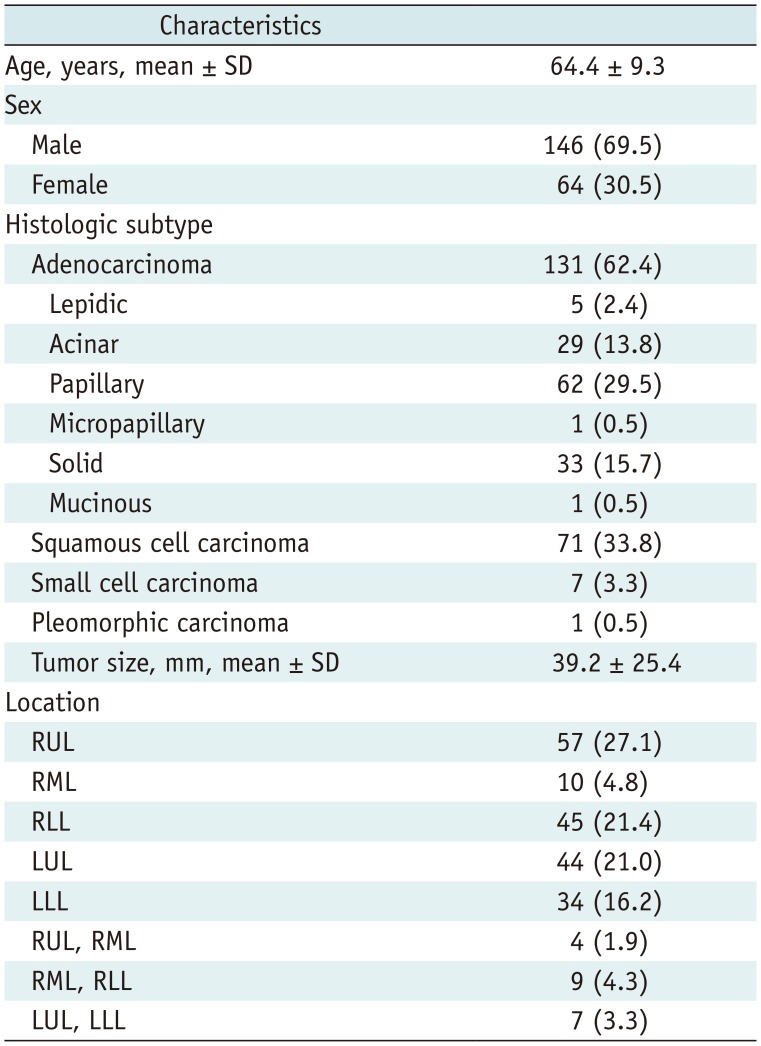
The final study population of 210 patients (mean age, 64.4 ± 9.3 years; range, 35–84 years) consisted of 146 men (mean age, 65.0 ± 8.7 years) and 64 women (mean age, 62.9 ± 10.5 years). The mean interval between CT and surgery was 15 days (range, 0–30 days). The baseline characteristics are summarized in Table 1.
Image Acquisition
Chest CT was performed using one of the following scanners: Somatom Definition, Sensation-16 (Siemens Healthineers, Forchheim, Germany), LightSpeed 16, and Lightspeed VCT (GE Healthcare, Milwaukee, WI, USA), with settings of 120 kVp and 150–200 mAs, pitch of 0.875–1, and collimation of 1–1.25 mm. All CT data were acquired in the supine position with breathing suspended at full inspiration. Scan coverage was from the lung bases to the level of the thoracic inlet. Contrast enhancement was performed in all patients with 90–120 mL of intravenous iopromide (Ultravist, 300 mg I/mL; Bayer AG, Berlin, Germany) being injected at a rate of 3 mL/sec using an automatic power injector, and scanning started after a delay of 50 seconds. CT images were reconstructed using a high-frequency algorithm.
Size Measurement of Lung Cancers on CT
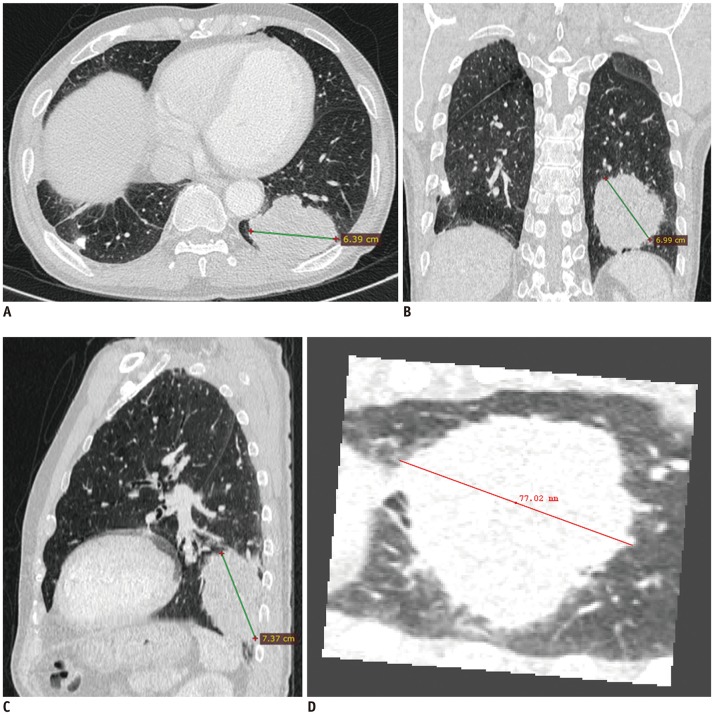
All CT data were anonymized and stored for review. Two readers (with 6 and 10 years of experience in thoracic radiology, respectively) who were blinded to pathologic size independently evaluated the 210 target lesions in the axial, coronal, and sagittal planes using a lung window setting (width, 1500 HU; level, −500 HU) (2) and commercial software (RadiAnt, Medixant, Poznan, Poland). The two readers were instructed to measure the axial diameter first and then measure the lesion on the other two planes in the order of their own preference at that time. Measurement of the MPR diameters required approximately 1 minute. For spiculated nodules, the spiculation was excluded from the measurement, while for cystic nodules the length of the largest nodular solid component was measured (2).
All diameters were measured using 0.1-mm increments, with the measurements then being rounded to the closest millimeter (2). The largest of the three diameter measurements was considered as the MPR diameter. Clinical T-stages were determined on the basis of axial and MPR diameters according to the size criteria in the eighth edition of the tumor node metastasis (TNM) classification. Other T-descriptors were not considered in staging.
Measurement of the Longest Diameter on 3D by Using a Volumetrically Segmented Tumor Mask
To obtain the longest diameter of the 3D tumor volume, commercial software (Aview, Coreline Soft, Seoul, Korea) was used to segment the lesion on each section. The software automatically created an initial tumor mask, after which one radiologist manually corrected the volume of interest (VOI). Two radiologists confirmed the final VOI mask in consensus. The longest diameter within the VOI was then identified as the longest diameter on 3D images. This measurement required about 20–30 minutes per lesion.
Pathologic Assessment
All surgically resected lung specimens were formalin-fixed and sectioned along their longest dimension. The longest diameter was then measured with a standard ruler and recorded in the pathologic report by two pathologists experienced in lung cancer assessments. The size in the pathologic report determined in routine clinical practice was used as the reference standard. Pathologic T-stages were reassigned on the basis of only tumor size according to the eighth edition TNM classification.
Statistical Analysis
The mean axial and MPR diameters, longest diameter on 3D images, and pathologic sizes were calculated and compared using paired t tests. Agreements between pathologic and CT measurements were assessed using Bland-Altman plots and single-measure intraclass correlation coefficients (ICC). Inter-reader agreement was assessed by ICCs. The diagnostic accuracies of axial and MPR diameters for the determination of T-stage on CT were determined and compared using McNemar's test for the two readers according to the eighth edition of the lung cancer staging system (112). Furthermore, to determine whether the effect of MPR measurement depends on the T-stages, T1a and T1b were grouped together into Group 1 and the other T-stages (T1c or higher) were grouped into Group 2. The diagnostic accuracies of axial and MPR diameters were compared within each group by using McNemar's test. The diagnostic accuracy of the longest diameter on 3D images was also evaluated.
Statistical analyses were performed using MedCalc statistical software (version 18.2.1; MedCalc Software bvba, Ostend, Belgium). Data are presented as mean ± standard deviation. P < 0.05 was considered to indicate statistical significance.
RESULTS
Size Measurement on Pathology and CT
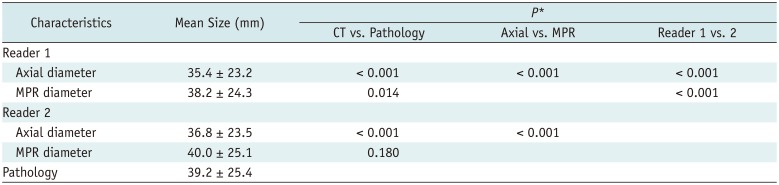
The mean size of lung cancers on pathological assessments was 39.2 ± 25.4 mm. The mean sizes on axial and MPR images were 35.4 ± 23.2 mm and 38.2 ± 24.3 mm, respectively, for reader 1, and 36.8 ± 23.5 mm and 40.0 ± 25.1 mm, respectively, for reader 2. MPR diameters were determined on 68 axial, 63 coronal, and 79 sagittal planes by reader 1, and on 94 axial, 54 coronal, and 62 sagittal planes by reader 2. The longest diameter on 3D images was 44.6 ± 27.7 mm, which was significantly greater than the CT measurements reported by both readers and the pathologic diameter (p < 0.001, all).
The axial diameters measured by each of the readers were significantly smaller than the pathologic diameters (p < 0.001, both). The MPR diameters measured by reader 1 were also significantly smaller than the pathologic diameters (p = 0.014), although there were no significant differences between the pathologic diameters and the MPR diameters of reader 2 (p = 0.180). The tumor measurements reported by reader 1 were significantly smaller than those reported by reader 2 on both axial and MPR CT (p < 0.001, both) (Table 2).
The difference between the axial and pathologic diameters was −3.9 ± 6.6 mm for reader 1 and −2.4 ± 7.9 mm for reader 2. The difference between the MPR and pathologic diameters was −1.0 ± 5.8 mm for reader 1 and 0.7 ± 7 mm for reader 2. For both readers, the differences between MPR and pathologic diameters were significantly less than those between axial and pathologic diameters (p < 0.001, both).
The ICC between the MPR diameter of reader 1 and the pathologic diameter was the highest (0.97; 95% confidence interval [CI], 0.96–0.98). The MPR and axial diameters of both readers showed a similar level of agreement with the pathologic diameter (0.97 [0.96–0.98] vs. 0.96 [0.95–0.97] for reader 1; 0.95 [0.94–0.96] vs. 0.95 [0.93–0.96] for reader 2). The ICC between the pathologic diameter and the longest diameter in the 3D space was 0.95 [0.93–0.96]. The ICCs for interobserver agreement were 0.98 [0.98–0.99] for the axial diameter and 0.98 [0.97–0.99] for the MPR diameter.
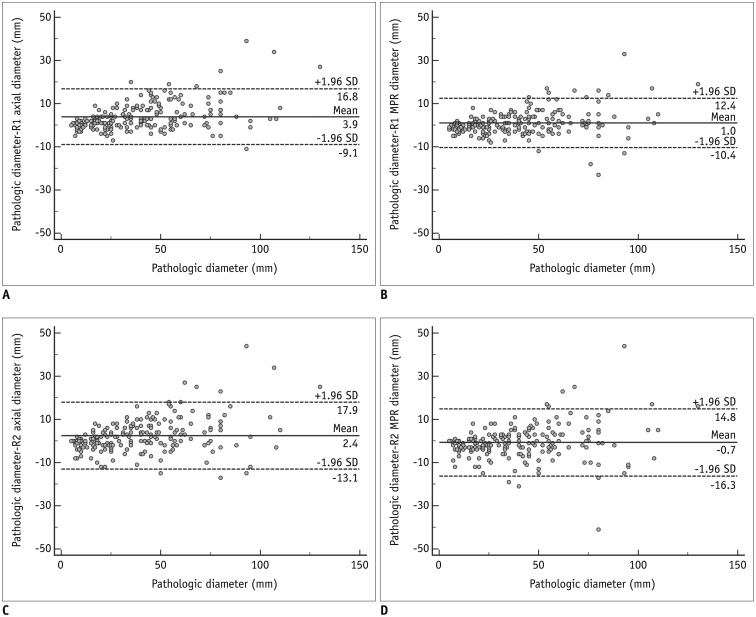
Bland-Altman plots showing differences between pathologic and CT diameters are displayed in Figure 2. The 95% limits of agreement between the CT diameters reported by reader 1 and pathological assessments ranged from −9.1 mm to 16.8 mm (mean difference, 3.9 mm) for axial diameter, and from −10.4 mm to 12.4 mm (mean difference, 1.0 mm) for MPR diameter. For reader 2, the 95% limits of agreement ranged from −13.1 mm to 17.9 mm (mean difference, 2.4 mm) for axial diameter, and from −16.3 mm to 14.8 mm (mean difference, −0.7 mm) for MPR diameter. Differences between the longest diameter on 3D and the pathologic diameter showed the widest 95% limits of agreement (CI, −22.2 mm to 11.4 mm; mean difference, −5.4 mm).
Diagnostic Accuracy of T-Staging
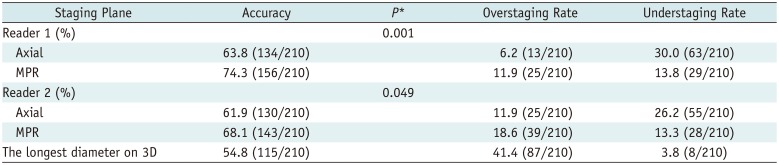
The diagnostic accuracy of T-staging by axial diameter was 63.8% (134/210) for reader 1 and 61.9% (130/210) for reader 2. Overstaging using the axial plane alone was reported in 6.2% (13/210) and 11.9% (25/210) of cases for readers 1 and 2, respectively, whereas understaging was reported in 30.0% (63/210) and 26.2% (55/210) of cases. The diagnostic accuracy of T-staging by MPR diameter was 74.3% (156/210) and 68.1% (143/210) for readers 1 and 2, respectively. When using MPR planes, 11.9% (25/210) and 18.6% (39/210) were overstaged by readers 1 and 2, respectively, while 13.8% (29/210) and 13.3% (28/210) were understaged (Table 3).
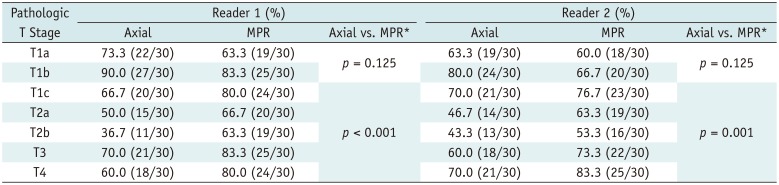
For both readers, MPR diameter resulted in significant improvements in diagnostic accuracy compared with axial diameter alone (p = 0.001 for reader 1, and p = 0.049 for reader 2). When the T-stages were divided into two groups (Group 1, T1a/b; Group 2, T1c or higher), the diagnostic accuracy did not show any significant difference between MPR and axial diameters in Group 1 (73.3% [44/60] vs. 81.7% [49/60] for reader 1; 63.3% [38/60] vs. 71.7% [43/60] for reader 2; p = 0.125, both readers); however, MPR diameter had significantly better diagnostic accuracy than axial diameter in Group 2 (74.7% [112/150] vs. 68.7% [103/150] for reader 1, p < 0.001; 70.0% [105/150] vs. 58.0% [81/150] for reader 2, p = 0.001) (Fig. 3). Table 4 presents the diagnostic accuracy of axial and MPR CT for each pathologic stage.
The longest diameter on 3D showed an accuracy of 54.8% (115/210). Tumor measurements in 3D space resulted in overstaging in 41.4% of cases (87/210), while 3.8% of patients (8/210) were understaged. The diagnostic accuracy of the longest diameter on 3D was significantly lower than that of the MPR diameter for both readers (p < 0.001 for reader 1, p = 0.001 for reader 2) (Table 3).
DISCUSSION
In this study, we demonstrated that size measurements on MPR CT significantly improved the diagnostic accuracy of T-staging, and the addition of 3D space data for lesion measurement did not improve the accuracy of T-staging.
There is an emphasis on lesion size for tumor staging in the eighth edition of the lung cancer staging classification. Accurate measurement of lesions on CT has therefore become more important for preoperative clinical staging. We found that the difference between the pathologic and CT diameters was significantly smaller when the diameter was measured on MPR images as opposed to axial images, suggesting that the MPR diameter is closer to the pathologic diameter and is more accurate than the axial diameter. These findings were linked to significant improvements in the diagnostic accuracy of T-staging. Therefore, we believe that MPR measurements are necessary for preoperative clinical staging to accurately assess lesion size and improve diagnostic accuracy.
More interestingly, the improvement in diagnostic accuracy depended on lesion size in our study. The diagnostic accuracy of the axial diameter was slightly higher than that of the MPR diameter in the T1a and T1b groups without statistical significance. In contrast, for the T1c or higher groups, MPR diameter resulted in significant improvements in diagnostic accuracy for both readers. This is probably because larger tumors tend to grow unevenly in different directions, with accompanying parenchymal changes, and therefore evaluation with variable CT planes could help to accurately determine tumor extent.
Our results for the T1a and T1b subgroups correspond well with the results of the study by Ahn et al. (7). In their study, T-stages of 247 subsolid nodules were determined by the size of the solid portion according to the eighth edition TNM standards. Of the 247 lesions, 231 were T1b or lower, with only 16 T1c lesions. They found that agreement between clinical and pathological T-staging was slightly better on axial measurements than on MPR measurements (50.0% vs. 46.2%, p = 0.084).
Another issue concerning the application of MPR measurement is interobserver agreement. The chances of variability in the measurements would presumably be higher when three planes are used instead of one. Although Ridge et al. (6) did not estimate interobserver agreement for the largest MPR diameter, lower interobserver agreement (ICC) was found for the sagittal and coronal diameters than for the axial diameter (0.90 for axial, 0.87 for sagittal, and 0.75 for coronal plane). However, our results showed almost the same interobserver agreement (ICC, 0.98 vs. 0.98) for MPR and axial-only measurements. Ahn et al. (7) showed similar results for interobserver agreement (0.83 vs. 0.82 for MPR and axial diameter, respectively).
In this study, we also evaluated whether the longest diameter on 3D could yield results closer to the pathologic size. Although off-axis oblique reformations are not currently recommended because of poor reproducibility (2), they could become more reproducible and applicable with advances in techniques. However, according to our results, adding the longest diameter on 3D to the T-staging did not improve the diagnostic accuracy and instead reduced it.
Theoretically, the longest diameter on 3D would be the closest to the pathologic diameter, but the reality is different because of the inherent limitations of CT. Since CT does not always allow the differentiation of tumor from associated atelectasis, inflammation, surrounding edema, and even adjacent mucus impaction, CT measurements tend to overestimate tumor size in comparison with pathologic size, as shown in several previous studies (131415). Furthermore, the in vivo state of a tumor in inflated lung tissues on CT could be slightly different to that of the pathological resected specimen, which may have shrunk and deformed during tissue processing. It is also possible that tumor parts could be lost or impaired during the operation. Consequently, our results support the opinion in the Fleischner Society guidelines that the additional effort to find the longest diameter in the off-axis plane is not currently recommended.
Our study has several limitations. First, our study had a retrospective design, and therefore it may be subject to bias. Second, we only included solid lesions. However, as T-staging is determined by the size of the solid portion even if the lesion includes ground glass opacity, our study could also be applicable to part-solid lesions. Furthermore, Ahn et al. (7) presented similar results to ours. Third, our study used the same number of patients for each pathologic T-stage, which is different from the natural incidence. Although the natural incidences of T-stages can vary according to time and place, further external validation of our results is needed. Fourth, our study addressed the accuracy of T-stages only on the basis of tumor size and did not consider other T-descriptors such as invasion to adjacent structures or separate nodules. However, in our study population, only 19 of 210 patients showed upstaging due to other T-descriptors, mostly visceral pleural invasion. Finally, since our study used the pathologic diameter as a reference standard, it is unclear whether the MPR diameter better reflects patient prognosis or affects treatment decision. Therefore, further studies are warranted to determine the association between MPR measurements and clinical outcomes.
In conclusion, size measurement on MPR CT can help to accurately determine preoperative clinical T-stages in lung cancers without impairing interobserver agreement. The size in the 3D space showed no added value.
 XML Download