Journal List > Korean J Radiol > v.20(7) > 1128656

Kim, Kim, Lee, Cha, Lim, Kang, and Oh: Accuracy of Model-Based Iterative Reconstruction for CT Volumetry of Part-Solid Nodules and Solid Nodules in Comparison with Filtered Back Projection and Hybrid Iterative Reconstruction at Various Dose Settings: An Anthropomorphic Chest Phantom Study

Abstract

Objective

To investigate the accuracy of model-based iterative reconstruction (MIR) for volume measurement of part-solid nodules (PSNs) and solid nodules (SNs) in comparison with filtered back projection (FBP) or hybrid iterative reconstruction (HIR) at various radiation dose settings.

Materials and Methods

CT scanning was performed for eight different diameters of PSNs and SNs placed in the phantom at five radiation dose levels (120 kVp/100 mAs, 120 kVp/50 mAs, 120 kVp/20 mAs, 120 kVp/10 mAs, and 80 kVp/10 mAs). Each CT scan was reconstructed using FBP, HIR, or MIR with three different image definitions (body routine level 1 [IMR-R1], body soft tissue level 1 [IMR-ST1], and sharp plus level 1 [IMR-SP1]; Philips Healthcare). The SN and PSN volumes including each solid/ground-glass opacity portion were measured semi-automatically, after which absolute percentage measurement errors (APEs) of the measured volumes were calculated. Image noise was calculated to assess the image quality.

Results

Across all nodules and dose settings, the APEs were significantly lower in MIR than in FBP and HIR (all p < 0.01). The APEs of the smallest inner solid portion of the PSNs (3 mm) and SNs (3 mm) were the lowest when MIR (IMR-R1 and IMR-ST1) was used for reconstruction for all radiation dose settings. (IMR-R1 and IMR-ST1 at 120 kVp/100 mAs, 1.06 ± 1.36 and 8.75 ± 3.96, p < 0.001; at 120 kVp/50 mAs, 1.95 ± 1.56 and 5.61 ± 0.85, p = 0.002; at 120 kVp/20 mAs, 2.88 ± 3.68 and 5.75 ± 1.95, p = 0.001; at 120 kVp/10 mAs, 5.57 ± 6.26 and 6.32 ± 2.91, p = 0.091; at 80 kVp/10 mAs, 5.84 ± 1.96 and 6.90 ± 3.31, p = 0.632). Image noise was significantly lower in MIR than in FBP and HIR for all radiation dose settings (120 kVp/100 mAs, 3.22 ± 0.66; 120 kVp/50 mAs, 4.19 ± 1.37; 120 kVp/20 mAs, 5.49 ± 1.16; 120 kVp/10 mAs, 6.88 ± 1.91; 80 kVp/10 mAs, 12.49 ± 6.14; all p < 0.001).

Conclusion

MIR was the most accurate algorithm for volume measurements of both PSNs and SNs in comparison with FBP and HIR at low-dose as well as standard-dose settings. Specifically, MIR was effective in the volume measurement of the smallest PSNs and SNs.

INTRODUCTION

The findings of the national lung cancer screening trial (NLST) indicated the need for appropriate low-dose chest CT screening and accurate surveillance of pulmonary nodules (1). The recently published guideline by the Fleischner society recommends a follow-up period of at least 5 years for persistent solitary part-solid nodules (PSNs) with diameters ≥ 6 mm (2). Iterative reconstruction (IR) is a good option to reduce the radiation dose in CT screening while maintaining diagnostic quality (3). In addition, several studies have revealed that the latest IR technique, model-based iterative reconstruction (MIR), produces diagnostically acceptable images in low-dose chest CT in comparison with conventional filtered back projection (FBP) and hybrid iterative reconstruction (HIR), which were previously used algorithms (456). Several studies have also revealed that MIR provides more accurate lung nodule volume measurement in solid nodules (SNs) and ground-glass nodules (GGNs) (789).
Meanwhile, volumetry of lung nodules is an effective and accurate method to provide consistent measurements in comparison with non-volumetric measurements (10111213). Therefore, several guidelines for pulmonary nodule management stated that volumetry is the preferred method over diameter measurement for nodule growth detection, although volumetry is substantially dependent on the specific software used (214).
In cases involving PSNs, it is important to evaluate the inner solid portion of the PSN because this portion is directly related to the prognosis when the PSN is lung cancer (15). Therefore, the Fleischner society guideline recommends that the internal solid component should be evaluated along with the overall size of the nodule (2). However, because an outer ground-glass opacity (GGO) portion surrounds the inner solid portion of the PSN, it may be difficult to accurately measure the volume by performing segmentation in comparison with a pure SN. Therefore, it would be useful to perform a phantom study targeting the PSN to evaluate the accuracy of the volume measurement of the PSN inner solid portion. However, such studies so far have only been performed on SNs and/or GGNs.
Thus, the purpose of this study was to investigate the accuracy of MIR for volume measurement of PSNs and SNs of various sizes in comparison with FBP and HIR at various radiation dose settings.

MATERIALS AND METHODS

Anthropomorphic Chest Phantom and Synthetic Lung Nodules

A commercially available multipurpose anthropomorphic thoracic phantom (Lungman; Kyoto Kagaku Co., Ltd, Kyoto, Japan) was used to simulate the human thorax. This phantom consisted of a life-size anatomical model of a human male thorax with soft tissue substitute materials and synthetic bones, all with X-ray attenuation properties very close to those of the corresponding human tissues. In the phantom lung, three-dimensional synthetic pulmonary vessels and bronchi were inserted.
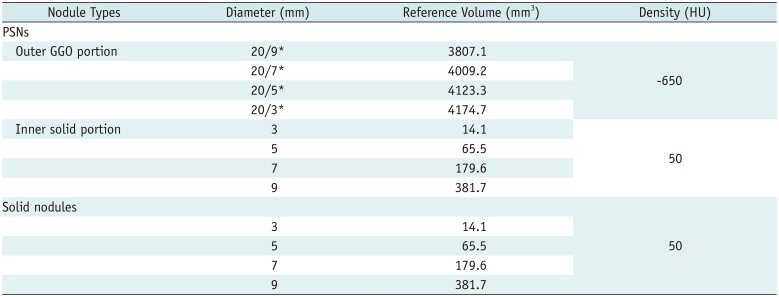
A total of eight spherical synthetic pulmonary nodules were used, and the characteristics of these nodules are described and shown in Table 1 and Supplementary Figure 1: four different-sized solid portions in 20-mm PSNs (outer GGO portion with four different diameters of the inner solid portions [20/3, 20/5, 20/7, and 20/9 mm]) and four different-sized SNs (3, 5, 7, and 9 mm). The attenuation of the outer GGO portion of the PSN was −650 HU and those of the inner solid portions of the PSN and SN were 50 HU. These nodules were randomly placed in the phantom and fixed using double-sided tape (Supplementary Fig. 2).

CT Image Acquisition

All CT images were obtained using a Philips IQon 128-slice spectral CT (Philips Healthcare, Cleveland, OH, USA). The scanning was repeated four times, and the locations of all nodules were different for each CT scan. The image acquisitions were carried out using five different radiation dose levels (120 kVp/100 mAs, 120 kVp/50 mAs, 120 kVp/20 mAs, 120 kVp/10 mAs, and 80 kVp/10 mAs). The study protocol and radiation dose data are summarized in Supplementary Table 1. The scan parameters were as follows: collimation, 64 × 0.625 mm; beam width, 40 mm; slice thickness, 0.67 mm; pitch, 1.08; and rotation time, 0.75 seconds.

Image Reconstruction Algorithms

Four series of CT scans with five different radiation dose settings were reconstructed with FBP, HIR (iDose4; Philips Healthcare), or MIR (IMR; Philips Healthcare). For noise reduction, level 4 was used for HIR and level 1 was used for MIR. For HIR, reconstruction filter B was used. In IMR, instead of the filter kernel, image sharpness was controlled by the “Image Definition” (6). In this study, three different image definitions were used: body routine level 1 (IMR-R1), body soft tissue level 1 (IMR-ST1), and sharp plus level 1 (IMR-SP1). Overall, five different reconstruction algorithms (FBP, iDose4, IMR-R1, IMR-ST1, and IMR-SP1) were used in each series and in each dose setting. Thus, a total of 100 reconstruction imaging datasets were finally obtained and analyzed.

Nodule Volume and Image Noise Measurements

The volumes of all the nodules from the first datasets were measured by two radiologists (with 3 and 9 years of experience in thoracic imaging), to obtain the interobserver variability, and measurements for the remaining datasets were obtained by one radiologist using a commercially available software (Aquarius iNtuition Edition, Terarecon, Foster City, CA, USA) used for nodule volumetry in a previous study (9).
Semi-automatic nodule segmentation was performed by clicking in the center of each nodule. The default segmentation attenuation thresholds representing GGO and solid components were −850 HU and −300 HU, respectively. Further adjustments of these thresholds were performed by the radiologists when nodule segmentation by the software was judged to be inadequate in consensus. However, most segmentation procedures were performed with a single click without manual modification. For PSNs, the volumes of each outer GGO portion and each inner solid portion in one PSN were measured and recorded separately.
For analysis of the difference between the measured volume data and the reference volume, the absolute percentage measurement error (APE) was calculated (6). The APE of each nodule volume was calculated as follows: |measured nodule volume in each algorithm - reference nodule volume| × 100 / reference nodule volume. The APE was presented as mean ± standard deviation (SD) values.
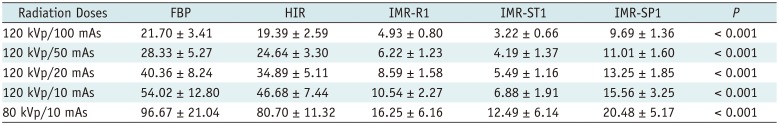
Image noise was also calculated to assess the image quality by averaging three different SD values of attenuation: the values in the two different lung fields of the phantom (right posteromedial lung field near the mediastinum and left posterolateral lung field near the thoracic wall at the level of the heart) and that in the room air outside the chest wall (3 cm away from the anteromedial chest wall) using a circular region of interest with an area of 120 mm2.

Statistical Analysis

For the repeated-measures data analysis, repeated-measures analysis of variance (RM ANOVA) was performed. Bonferroni correction was used to adjust the significance level and confidence interval for multiple comparisons of main effects. When the sphericity assumption by Mauchly's test of sphericity was not met, the p value from the Greenhouse-Geisser correction was used for tests of within-subjects effects. Intraclass correlation coefficient (ICC) was used to evaluate interobserver variability. These results were interpreted as follows: < 0.40, poor agreement; 0.40–0.59, fair agreement; 0.60–0.74, good agreement; and 0.75–1.00, excellent agreement (16). A p value of less than 0.05 was considered statistically significant. All statistical analyses were performed using SPSS (version 20; IBM Corp., Armonk, NY, USA).

RESULTS

The Mean APE according to Nodule Type in the Five Reconstruction Algorithms

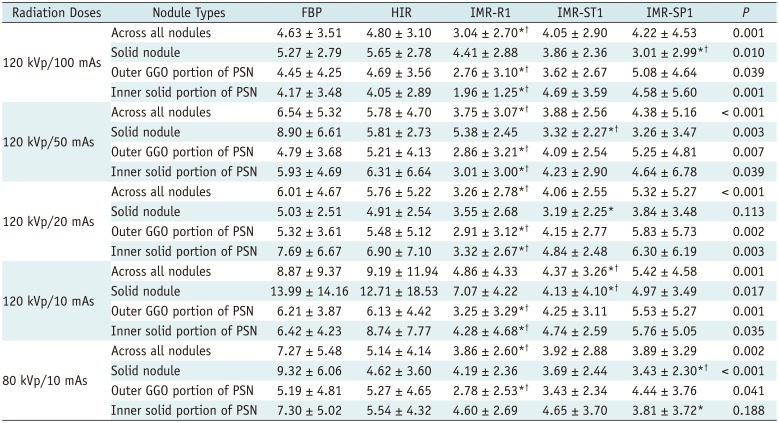
The APEs according to different nodule types, radiation doses, and reconstruction algorithms are listed in Table 2. Across all nodules at all dose settings, the APEs were significantly lower with MIR than with FBP and HIR (all p < 0.01). All the APEs of the SNs, the inner solid portion of the PSNs, and the outer GGO portions of the PSNs at all dose settings except SN with 120 kVp/20 mAs and the inner solid portion of the PSNs with 80 kVp/10 mAs were significantly lower in MIR (IMR-R1, IMR-ST1, or IMR-SP1) than in FBP and HIR (all p < 0.05). However, the APEs of the SNs with 120 kVp/20 mAs and the inner solid portions of the PSNs at 80 kVp/10 mAs were also lower in MIR than in FBP and HIR, although these differences were not significant.
The lowest APEs of the outer GGO portion of the PSN were demonstrated in IMR-R1 among the algorithms at all dose level settings (all p < 0.05). In addition, the APEs of the solid portion of the PSNs at all dose level settings except 80 kVp/10 mAs showed significantly lowest values in IMR-R1 among the algorithms (all p < 0.05). The APE of the solid portion of the PSNs at 80 kVp/10 mAs showed the lowest value in IMR-SP1, but there was no significant difference. For SNs, the APEs at 120 kVp/50 mAs, 120 kVp/20 mAs, and 120 kVp/10 mAs were the lowest in IMR-ST1 among the algorithms (all p < 0.05, except 120 kVp/20 mAs), and the APEs at 120 kVp/100 mAs and 80 kVp/10 mAs were the lowest in IMR-SP1 (all p ≤ 0.01).

The Mean APE according to Different Nodule Types and Nodule Sizes in Five Reconstruction Algorithms

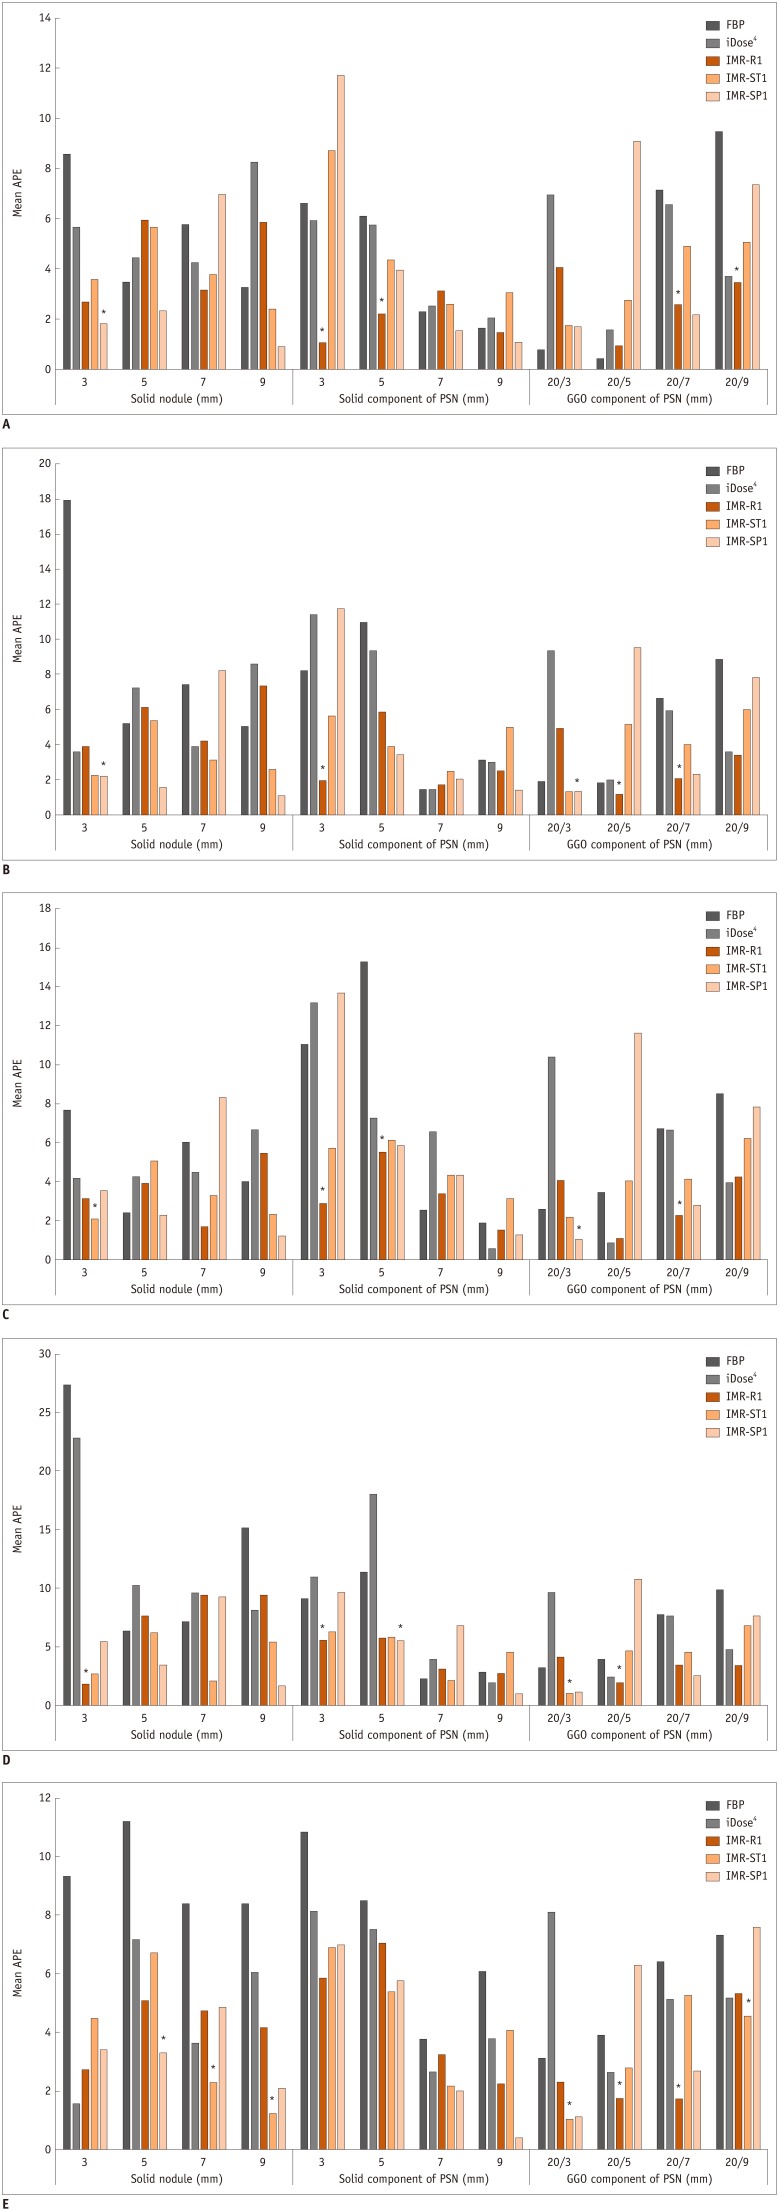
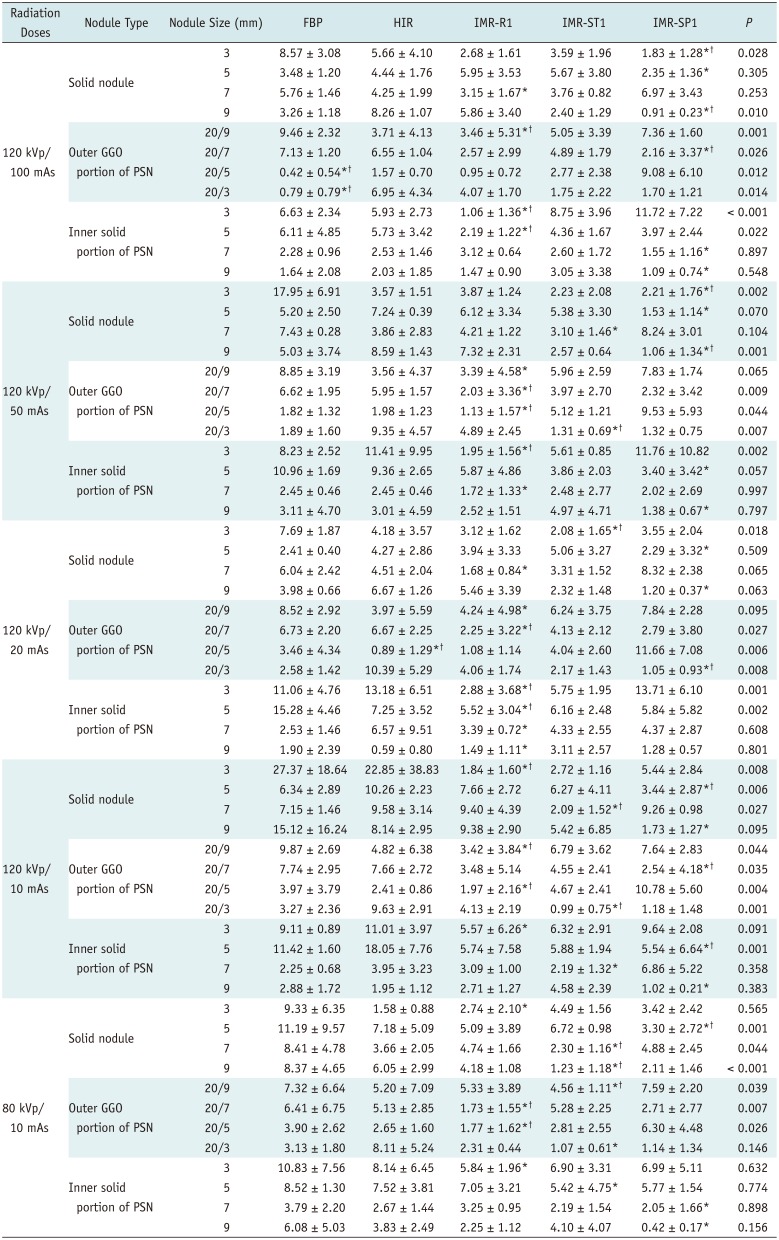
Table 3 and Figure 1 show the APEs according to different nodule types and nodule sizes with five different radiation dose settings.
The lowest APEs of all the nodules with different types and sizes were observed with MIR (IMR-R1, IMR-ST1, or IMR-SP1) at all dose settings, except for the outer GGO portion of the 20/5 mm and 20/3 mm PSNs at 120 kVp/100 mAs and the 20/5 mm PSNs at 120 kVp/20 mAs, although not all values were statistically significant. The outer GGO portion of the 20/5 mm and 20/3 mm PSNs at 120 kVp/100 mAs showed the lowest APE in FBP (all p < 0.05). However, the APE of the outer GGO portion of the 20/3 mm PSNs at 120 kVp/100 mAs in FBP showed only a significant difference with HIR (p = 0.008) and not with MIR (all p > 0.05). Moreover, the APE of the outer GGO portion of the 20/5 mm PSN at 120 kVp/100 mAs in FBP did not show a significant difference with IMR-R1 or IMR-ST1 (p > 0.999 and p = 0.501, respectively). Other sizes of the outer GGO portions of the PSNs showed the lowest APEs in MIR with statistically significant differences among the algorithms (all p < 0.05), except 20/9 mm at 120 kVp/50 mAs and 120 kVp/20 mAs, and 20/3 mm at 80 kVp/10 mAs. The outer GGO portion of the 20/5 mm PSNs at 120 kVp/20 mAs showed the lowest APE in HIR (p < 0.05). However, the APE of the outer GGO portion of the 20/5 mm PSNs showed a significant difference only with IMR-SP1 (p = 0.04) and not with IMR-R1 or IMR-ST1 (p > 0.999 and p = 0.741, respectively).
The APEs of the smallest inner solid portion of the PSNs (3 mm) and SNs (3 mm) were lowest when MIR (IMR-R1 and IMR-ST1) was used for reconstruction for all radiation dose settings, although not all values were statistically significant (Fig. 2). The APEs of the smallest inner solid portion of the PSNs (3 mm) with all dose settings except 80 kVp/10 mAs showed the lowest value in MIR, and the APEs of the smallest SNs (3 mm) were significantly the lowest on all dose settings except 120 kVp/10 mAs and 80 kVp/10 mAs.
The APEs of the smallest outer GGO portion of the PSNs (20/9 mm) were also the lowest in MIR among the algorithms on all dose settings, and significant differences were shown at 120 kVp/100 mAs, 120 kVp/10 mAs, and 80 kVp/10 mAs.

Image Noise in Five Reconstruction Protocols at Different Radiation Dose Settings

The measured image noise values are reported in Table 4. Image noise was significantly lower in MIR than in FBP and HIR on all radiation dose settings. Among the MIR settings, IMR-ST1 showed the lowest image noise.

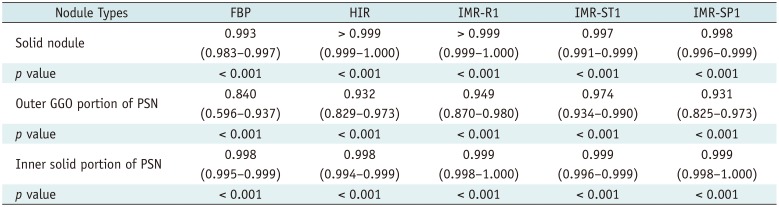
Interobserver Variability of Measured Parameters

The results of interobserver variability of volume measurements for each type of nodule are listed in Table 5. The two radiologists showed very good agreement for all nodule volume measurements (ICC, 0.840 to < 0.999).

DISCUSSION

Our study demonstrated that MIR was the most accurate algorithm for volume measurements of both PSNs and SNs in comparison with FBP and HIR at low-dose as well as standard-dose settings. Specifically, the volume of the smallest inner solid portion of the PSNs (3 mm) and SNs (3 mm) as well as the outer GGO portions of the PSNs (20/9 mm) were most accurately measured when MIR was used for reconstruction with all radiation dose settings. MIR was also superior to both FBP and HIR from the aspect of image noise.
There have been several studies on the accuracy of volume measurements of SNs or GGNs in MIR in comparison with those in FBP and HIR (7891718). Kim et al. (17) performed CT scans on a thoracic phantom containing SNs and GGNs (diameters of 10 and 12 mm; +100, −630, and −800 HU) at various dose settings (from 120 kVp/10 mAs to 120 kVp/100 mAs), but volume measurement accuracy was not significantly different between the algorithms. These results are presumably due to the fact that the nodule size in their study was larger than that in our study: the diameter of the largest nodule size we used was 9 mm. In their subsequent study using smaller-sized nodules (diameters of 3, 5, 8, 10, and 12 mm with the same densities), IR did not have a significant impact on diameter measurement error for SNs, but MIR was associated with significantly decreased relative diameter measurement error for GGNs (18). However, in their study, volumetry was not performed. Chen et al. (9) performed volumetry of two SNs (diameters of 9.5 mm and 4.8 mm) using two different software programs at variable dose settings, and one program showed superior accuracy compared to FBP only in MIR but, in another program, MIR and HIR showed superior accuracy compared to FBP. Gavrielides et al. (7) performed CT volumetry of GGNs (diameters of 5 mm and 10 mm with −800, −630, −10 HU) at standard dose (4.1 mGy) to below screening levels (0.3 mGy). For the nodules, MIR improved the measurement accuracy for 5-mm GGNs (−800 HU and −630 HU), but for other nodules, the effect of IR was small. A recent study performed by Maruyama et al. (8) involved volume measurement of GGNs (diameters of 5, 8, 10, and 12 mm with −630 HU) in two kinds of MIR, HIR, and FBP, and the errors with both kinds of MIR were smaller than those with FBP.
All of the above studies (7891718) were phantom studies with only SNs and/or GGNs, and there have not been any phantom studies using PSNs. There was only one study using PSNs, but it was performed in vivo (19). In that study, the longest diameter and volume of the PSNs and those of their solid components were significantly higher using MIR than those using FBP, but the differences were within the range of measurement variability. However, this study was limited by the fact that there was no reference for the volume of PSNs.
Nodule size can strongly affect the accuracy in measurements of the nodule volume (20). However, we have demonstrated that MIR is the most accurate and useful algorithm for volume measurement of the 3-mm solid portion of PSNs and 3-mm SNs at all radiation dose settings, including the ultra-low-dose setting. Of note, this is the first study to our knowledge to include nodules less than 5 mm. Therefore, volume measurement using MIR with low-dose CT can be considered especially for small SNs or solid portions of PSNs of at least 3 mm in diameter.
In this study, three different image definitions for MIR were used: IMR-R1, IMR-ST1, and IMR-SP1. For the volume measurement of both the inner solid portion and the outer GGN portion of PSNs, IMR-R1 was the most accurate algorithm at all dose settings, with the exception of the volume measurement of the solid component of PSNs at 80 kVp/10 mAs. For SNs, IMR-ST1 or IMR-SP1 showed more accurate volume measurements than IMR-R1. Therefore, the use of specific image definitions in MIR, such as IMR-R1 for PSNs and IMR-ST1 or IMR-SP1 for SNs, should be also considered for accurate volume measurements.
Interobserver variability of the volume measurements was very good in this study. We performed semi-automatic segmentation with a single click in the middle of the nodules, and manual modification was rarely performed. Because the software we used is also used by many institutions for multiple purposes, and it is developed for processing images from multiple vendors, we believe that our results can be reproduced by other researchers.
Our study has several limitations, most of which are the inherent limitations in phantom studies. First, the shapes of the simulated nodules in the present study were all spherical, and the densities of nodules were only +50 HU and −650 HU, limiting the generalizability to other shapes and densities. In addition, the stimulated PSNs used in this study may be different from PSNs in human lung parenchyma in terms of the segmentation of the solid portion, because the vascular structure could not pass through the solid portion in the phantom. Second, the lack of true lung parenchyma in the chest phantom may have contributed to increased measurement reproducibility. Third, noise can be artificially low with IR in an homogeneous phantom because IR can reduce noise more prominently in homogeneous tissue than in inhomogeneous tissue (21). Therefore, further clinical study of this aspect is needed. Fourth, we set −300 HU as the threshold CT number between the GGO and the solid component, which was also used in a previous study (22). However, a recent study showed that the optimal border for the CT number between the GGO and solid component to perform receiver operating characteristic analysis for postoperative recurrence was 0 HU, rather than −300 HU (23). Therefore, in a further study, we recommend setting various thresholds.
In conclusion, MIR was the most accurate algorithm for volume measurements of both PSNs and SNs in comparison with FBP and HIR at low-dose settings as well as at standard-dose settings, especially in the smallest inner solid portions of PSNs (3 mm) and SNs (3 mm). Among the three different image definitions of IMR, IMR-R1 was superior for PSN evaluation, and IMR-ST1 and IMR-SP1 were superior for SN evaluation.

Notes

This study was supported by a National Research Foundation of Korea (NRF) grant funded by the Korean government (MSIP) (NRF-2016R1A2B4012155 and NRF-2018R1D1A1B07049989).

This study was supported by a Korea University Ansan Hospital Grant (O1801231, O1700681).

This study was supported by Dong-Kook Pharmaceutical.

Conflicts of Interest: The authors have no potential conflicts of interest to disclose.

References

1. National Lung Screening Trial Research Team. Aberle DR, Adams AM, Berg CD, Black WC, Clapp JD, Fagerstrom RM, et al. Reduced lung-cancer mortality with low-dose computed tomographic screening. N Engl J Med. 2011; 365:395–409. PMID: 21714641.
crossref
2. MacMahon H, Naidich DP, Goo JM, Lee KS, Leung ANC, Mayo JR, et al. Guidelines for management of incidental pulmonary nodules detected on CT images: from the Fleischner Society 2017. Radiology. 2017; 284:228–243. PMID: 28240562.
3. Vardhanabhuti V, Loader RJ, Mitchell GR, Riordan RD, Roobottom CA. Image quality assessment of standard- and low-dose chest CT using filtered back projection, adaptive statistical iterative reconstruction, and novel model-based iterative reconstruction algorithms. AJR Am J Roentgenol. 2013; 200:545–552. PMID: 23436843.
crossref
4. Katsura M, Matsuda I, Akahane M, Sato J, Akai H, Yasaka K, et al. Model-based iterative reconstruction technique for radiation dose reduction in chest CT: comparison with the adaptive statistical iterative reconstruction technique. Eur Radiol. 2012; 22:1613–1623. PMID: 22538629.
crossref
5. Yuki H, Oda S, Utsunomiya D, Funama Y, Kidoh M, Namimoto T, et al. Clinical impact of model-based type iterative reconstruction with fast reconstruction time on image quality of low-dose screening chest CT. Acta Radiol. 2016; 57:295–302. PMID: 25817455.
crossref
6. Kim C, Lee KY, Shin C, Kang EY, Oh YW, Ha M, et al. Comparison of filtered back projection, hybrid iterative reconstruction, model-based iterative reconstruction, and virtual monoenergetic reconstruction images at both low- and standard-dose settings in measurement of emphysema volume and airway wall thickness: a CT phantom study. Korean J Radiol. 2018; 19:809–817. PMID: 29962888.
crossref
7. Gavrielides MA, Berman BP, Supanich M, Schultz K, Li Q, Petrick N, et al. Quantitative assessment of nonsolid pulmonary nodule volume with computed tomography in a phantom study. Quant Imaging Med Surg. 2017; 7:623–635. PMID: 29312867.
crossref
8. Maruyama S, Fukushima Y, Miyamae Y, Koizumi K. Usefulness of model-based iterative reconstruction in semi-automatic volumetry for ground-glass nodules at ultra-low-dose CT: a phantom study. Radiol Phys Technol. 2018; 11:235–241. PMID: 29429016.
crossref
9. Chen B, Barnhart H, Richard S, Robins M, Colsher J, Samei E. Volumetric quantification of lung nodules in CT with iterative reconstruction (ASiR and MBIR). Med Phys. 2013; 40:111902. PMID: 24320435.
crossref
10. Hasegawa M, Sone S, Takashima S, Li F, Yang ZG, Maruyama Y, et al. Growth rate of small lung cancers detected on mass CT screening. Br J Radiol. 2000; 73:1252–1259. PMID: 11205667.
crossref
11. Jennings SG, Winer-Muram HT, Tarver RD, Farber MO. Lung tumor growth: assessment with CT--comparison of diameter and cross-sectional area with volume measurements. Radiology. 2004; 231:866–871. PMID: 15163822.
crossref
12. Kim C, Lee SM, Choe J, Chae EJ, Do KH, Seo JB. Volume doubling time of lung cancer detected in idiopathic interstitial pneumonia: comparison with that in chronic obstructive pulmonary disease. Eur Radiol. 2018; 28:1402–1409. PMID: 29038933.
crossref
13. Devaraj A, van Ginneken B, Nair A, Baldwin D. Use of volumetry for lung nodule management: theory and practice. Radiology. 2017; 284:630–644. PMID: 28825886.
crossref
14. Callister ME, Baldwin DR, Akram AR, Barnard S, Cane P, Draffan J, et al. on behalf of the British Thoracic Society Standards of Care Committee. British Thoracic Society guidelines for the investigation and management of pulmonary nodules. Thorax. 2015; 70(Suppl 2):ii1–ii54. PMID: 26082159.
15. Cohen JG, Reymond E, Lederlin M, Medici M, Lantuejoul S, Laurent F, et al. Differentiating pre- and minimally invasive from invasive adenocarcinoma using CT-features in persistent pulmonary part-solid nodules in Caucasian patients. Eur J Radiol. 2015; 84:738–744. PMID: 25623825.
crossref
16. Cicchetti DV. Guidelines, criteria, and rules of thumb for evaluating normed and standardized assessment instruments in psychology. Psychological Assessment. 1994; 6:284–290.
crossref
17. Kim H, Park CM, Song YS, Lee SM, Goo JM. Influence of radiation dose and iterative reconstruction algorithms for measurement accuracy and reproducibility of pulmonary nodule volumetry: a phantom study. Eur J Radiol. 2014; 83:848–857. PMID: 24572380.
crossref
18. Kim H, Park CM, Chae HD, Lee SM, Goo JM. Impact of radiation dose and iterative reconstruction on pulmonary nodule measurements at chest CT: a phantom study. Diagn Interv Radiol. 2015; 21:459–465. PMID: 26359871.
crossref
19. Cohen JG, Kim H, Park SB, van Ginneken B, Ferretti GR, Lee CH, et al. Comparison of the effects of model-based iterative reconstruction and filtered back projection algorithms on software measurements in pulmonary subsolid nodules. Eur Radiol. 2017; 27:3266–3274. PMID: 28058482.
crossref
20. Doo KW, Kang EY, Yong HS, Woo OH, Lee KY, Oh YW. Accuracy of lung nodule volumetry in low-dose CT with iterative reconstruction: an anthropomorphic thoracic phantom study. Br J Radiol. 2014; 87:20130644. PMID: 25026866.
crossref
21. Willemink MJ, de Jong PA, Leiner T, de Heer LM, Nievelstein RA, Budde RP, et al. Iterative reconstruction techniques for computed tomography Part 1: technical principles. Eur Radiol. 2013; 23:1623–1631. PMID: 23314600.
crossref
22. Shikuma K, Menju T, Chen F, Kubo T, Muro S, Sumiyoshi S, et al. Is volumetric 3-dimensional computed tomography useful to predict histological tumour invasiveness? Analysis of 211 lesions of cT1N0M0 lung adenocarcinoma. Interact Cardiovasc Thorac Surg. 2016; 22:831–838. PMID: 26920725.
crossref
23. Kamiya S, Iwano S, Umakoshi H, Ito R, Shimamoto H, Nakamura S, et al. Computer-aided volumetry of part-solid lung cancers by using CT: solid component size predicts prognosis. Radiology. 2018; 287:1030–1040. PMID: 29533722.
crossref

Supplementary Materials

The Data Supplement is available with this article at https://doi.org/10.3348/kjr.2018.0893.

Supplementary Fig. 1

Characteristics of eight spherical synthetic pulmonary nodules.
kjr-20-1195-s001.pdf

Supplementary Fig. 2

Randomly placed synthetic pulmonary nodules in anthropomorphic chest phantom.
kjr-20-1195-s002.pdf

Supplementary Table 1

Summary of Study Protocol and Radiation Dose Dat
kjr-20-1195-s003.pdf
Fig. 1

Mean APE according to different nodule types and nodule sizes with five different radiation dose settings.

APEs according to different nodule types and nodule sizes on (A) 120 kVp/100 mAs, (B) 120 kVp/50 mAs, (C) 120 kVp/20 mAs, (D) 120 kVp/10 mAs, (E) 80 kVp/10 mAs. Nodules with significantly lower APEs in MIR are marked with single asterisk (*). iDose4 and IMR; Philips Healthcare. APE = absolute percentage measurement error, FBP = filtered back projection, GGO = ground-glass opacity, IMR-R1 = body routine level 1, IMR-ST1 = body soft tissue level 1, IMR-SP1 = sharp plus level 1, MIR = model-based iterative reconstruction, PSN = part-solid nodule
kjr-20-1195-g001
Fig. 2

CT images of PSNs at different radiation dose settings.

Images of PSNs (outer GGO portion, 20 mm; inner solid portion, 3 mm) at five radiation dose settings reconstructed with FBP, HIR (iDose4), and MIR with three different image definitions (IMR-R1, IMR-ST1, IMR-SP1). HIR = hybrid iterative reconstruction
kjr-20-1195-g002
Table 1

Characteristics of Eight Spherical Synthetic Nodules

kjr-20-1195-i001
Nodule Types Diameter (mm) Reference Volume (mm3) Density (HU)
PSNs
Outer GGO portion 20/9* 3807.1 −650
20/7* 4009.2
20/5* 4123.3
20/3* 4174.7
Inner solid portion 3 14.1 50
5 65.5
7 179.6
9 381.7
Solid nodules 50
3 14.1
5 65.5
7 179.6
9 381.7

*Whole nodule diameter/diameter of each inner solid portion. GGO = ground-glass opacity, PSN = part-solid nodule

Table 2

APEs of Synthetic Nodules according to Different Nodule Types, Radiation Doses, and Reconstruction Algorithms

kjr-20-1195-i002
Radiation Doses Nodule Types FBP HIR IMR-R1 IMR-ST1 IMR-SP1 P
120 kVp/100 mAs Across all nodules 4.63 ± 3.51 4.80 ± 3.10 3.04 ± 2.70*† 4.05 ± 2.90 4.22 ± 4.53 0.001
Solid nodule 5.27 ± 2.79 5.65 ± 2.78 4.41 ± 2.88 3.86 ± 2.36 3.01 ± 2.99*† 0.010
Outer GGO portion of PSN 4.45 ± 4.25 4.69 ± 3.56 2.76 ± 3.10*† 3.62 ± 2.67 5.08 ± 4.64 0.039
Inner solid portion of PSN 4.17 ± 3.48 4.05 ± 2.89 1.96 ± 1.25*† 4.69 ± 3.59 4.58 ± 5.60 0.001
120 kVp/50 mAs Across all nodules 6.54 ± 5.32 5.78 ± 4.70 3.75 ± 3.07*† 3.88 ± 2.56 4.38 ± 5.16 < 0.001
Solid nodule 8.90 ± 6.61 5.81 ± 2.73 5.38 ± 2.45 3.32 ± 2.27*† 3.26 ± 3.47 0.003
Outer GGO portion of PSN 4.79 ± 3.68 5.21 ± 4.13 2.86 ± 3.21*† 4.09 ± 2.54 5.25 ± 4.81 0.007
Inner solid portion of PSN 5.93 ± 4.69 6.31 ± 6.64 3.01 ± 3.00*† 4.23 ± 2.90 4.64 ± 6.78 0.039
120 kVp/20 mAs Across all nodules 6.01 ± 4.67 5.76 ± 5.22 3.26 ± 2.78*† 4.06 ± 2.55 5.32 ± 5.27 < 0.001
Solid nodule 5.03 ± 2.51 4.91 ± 2.54 3.55 ± 2.68 3.19 ± 2.25* 3.84 ± 3.48 0.113
Outer GGO portion of PSN 5.32 ± 3.61 5.48 ± 5.12 2.91 ± 3.12*† 4.15 ± 2.77 5.83 ± 5.73 0.002
Inner solid portion of PSN 7.69 ± 6.67 6.90 ± 7.10 3.32 ± 2.67*† 4.84 ± 2.48 6.30 ± 6.19 0.003
120 kVp/10 mAs Across all nodules 8.87 ± 9.37 9.19 ± 11.94 4.86 ± 4.33 4.37 ± 3.26*† 5.42 ± 4.58 0.001
Solid nodule 13.99 ± 14.16 12.71 ± 18.53 7.07 ± 4.22 4.13 ± 4.10*† 4.97 ± 3.49 0.017
Outer GGO portion of PSN 6.21 ± 3.87 6.13 ± 4.42 3.25 ± 3.29*† 4.25 ± 3.11 5.53 ± 5.27 0.001
Inner solid portion of PSN 6.42 ± 4.23 8.74 ± 7.77 4.28 ± 4.68*† 4.74 ± 2.59 5.76 ± 5.05 0.035
80 kVp/10 mAs Across all nodules 7.27 ± 5.48 5.14 ± 4.14 3.86 ± 2.60*† 3.92 ± 2.88 3.89 ± 3.29 0.002
Solid nodule 9.32 ± 6.06 4.62 ± 3.60 4.19 ± 2.36 3.69 ± 2.44 3.43 ± 2.30*† < 0.001
Outer GGO portion of PSN 5.19 ± 4.81 5.27 ± 4.65 2.78 ± 2.53*† 3.43 ± 2.34 4.44 ± 3.76 0.041
Inner solid portion of PSN 7.30 ± 5.02 5.54 ± 4.32 4.60 ± 2.69 4.65 ± 3.70 3.81 ± 3.72* 0.188

IMR-R1, IMR-ST-1, and IMR-SP1; Philips Healthcare. *Lowest values, Statistically significant value. APE = absolute percentage measurement error, FBP = filtered back projection, HIR = hybrid iterative reconstruction, IMR-R1 = body routine level 1, IMR-ST1 = body soft tissue level 1, IMR-SP1 = sharp plus level 1

Table 3

APEs of Synthetic Nodules according to Different Nodule Types, Radiation Doses, and Reconstruction Algorithms

kjr-20-1195-i003
Radiation Doses Nodule Type Nodule Size (mm) FBP HIR IMR-R1 IMR-ST1 IMR-SP1 P
120 kVp/100 mAs Solid nodule 3 8.57 ± 3.08 5.66 ± 4.10 2.68 ± 1.61 3.59 ± 1.96 1.83 ± 1.28*† 0.028
5 3.48 ± 1.20 4.44 ± 1.76 5.95 ± 3.53 5.67 ± 3.80 2.35 ± 1.36* 0.305
7 5.76 ± 1.46 4.25 ± 1.99 3.15 ± 1.67* 3.76 ± 0.82 6.97 ± 3.43 0.253
9 3.26 ± 1.18 8.26 ± 1.07 5.86 ± 3.40 2.40 ± 1.29 0.91 ± 0.23*† 0.010
Outer GGO portion of PSN 20/9 9.46 ± 2.32 3.71 ± 4.13 3.46 ± 5.31*† 5.05 ± 3.39 7.36 ± 1.60 0.001
20/7 7.13 ± 1.20 6.55 ± 1.04 2.57 ± 2.99 4.89 ± 1.79 2.16 ± 3.37*† 0.026
20/5 0.42 ± 0.54*† 1.57 ± 0.70 0.95 ± 0.72 2.77 ± 2.38 9.08 ± 6.10 0.012
20/3 0.79 ± 0.79*† 6.95 ± 4.34 4.07 ± 1.70 1.75 ± 2.22 1.70 ± 1.21 0.014
Inner solid portion of PSN 3 6.63 ± 2.34 5.93 ± 2.73 1.06 ± 1.36*† 8.75 ± 3.96 11.72 ± 7.22 < 0.001
5 6.11 ± 4.85 5.73 ± 3.42 2.19 ± 1.22*† 4.36 ± 1.67 3.97 ± 2.44 0.022
7 2.28 ± 0.96 2.53 ± 1.46 3.12 ± 0.64 2.60 ± 1.72 1.55 ± 1.16* 0.897
9 1.64 ± 2.08 2.03 ± 1.85 1.47 ± 0.90 3.05 ± 3.38 1.09 ± 0.74* 0.548
120 kVp/50 mAs Solid nodule 3 17.95 ± 6.91 3.57 ± 1.51 3.87 ± 1.24 2.23 ± 2.08 2.21 ± 1.76*† 0.002
5 5.20 ± 2.50 7.24 ± 0.39 6.12 ± 3.34 5.38 ± 3.30 1.53 ± 1.14* 0.070
7 7.43 ± 0.28 3.86 ± 2.83 4.21 ± 1.22 3.10 ± 1.46* 8.24 ± 3.01 0.104
9 5.03 ± 3.74 8.59 ± 1.43 7.32 ± 2.31 2.57 ± 0.64 1.06 ± 1.34*† 0.001
Outer GGO portion of PSN 20/9 8.85 ± 3.19 3.56 ± 4.37 3.39 ± 4.58* 5.96 ± 2.59 7.83 ± 1.74 0.065
20/7 6.62 ± 1.95 5.95 ± 1.57 2.03 ± 3.36*† 3.97 ± 2.70 2.32 ± 3.42 0.009
20/5 1.82 ± 1.32 1.98 ± 1.23 1.13 ± 1.57*† 5.12 ± 1.21 9.53 ± 5.93 0.044
20/3 1.89 ± 1.60 9.35 ± 4.57 4.89 ± 2.45 1.31 ± 0.69*† 1.32 ± 0.75 0.007
Inner solid portion of PSN 3 8.23 ± 2.52 11.41 ± 9.95 1.95 ± 1.56*† 5.61 ± 0.85 11.76 ± 10.82 0.002
5 10.96 ± 1.69 9.36 ± 2.65 5.87 ± 4.86 3.86 ± 2.03 3.40 ± 3.42* 0.057
7 2.45 ± 0.46 2.45 ± 0.46 1.72 ± 1.33* 2.48 ± 2.77 2.02 ± 2.69 0.997
9 3.11 ± 4.70 3.01 ± 4.59 2.52 ± 1.51 4.97 ± 4.71 1.38 ± 0.67* 0.797
120 kVp/20 mAs Solid nodule 3 7.69 ± 1.87 4.18 ± 3.57 3.12 ± 1.62 2.08 ± 1.65*† 3.55 ± 2.04 0.018
5 2.41 ± 0.40 4.27 ± 2.86 3.94 ± 3.33 5.06 ± 3.27 2.29 ± 3.32* 0.509
7 6.04 ± 2.42 4.51 ± 2.04 1.68 ± 0.84* 3.31 ± 1.52 8.32 ± 2.38 0.065
9 3.98 ± 0.66 6.67 ± 1.26 5.46 ± 3.39 2.32 ± 1.48 1.20 ± 0.37* 0.063
Outer GGO portion of PSN 20/9 8.52 ± 2.92 3.97 ± 5.59 4.24 ± 4.98* 6.24 ± 3.75 7.84 ± 2.28 0.095
20/7 6.73 ± 2.20 6.67 ± 2.25 2.25 ± 3.22*† 4.13 ± 2.12 2.79 ± 3.80 0.027
20/5 3.46 ± 4.34 0.89 ± 1.29*† 1.08 ± 1.14 4.04 ± 2.60 11.66 ± 7.08 0.006
20/3 2.58 ± 1.42 10.39 ± 5.29 4.06 ± 1.74 2.17 ± 1.43 1.05 ± 0.93*† 0.008
Inner solid portion of PSN 3 11.06 ± 4.76 13.18 ± 6.51 2.88 ± 3.68*† 5.75 ± 1.95 13.71 ± 6.10 0.001
5 15.28 ± 4.46 7.25 ± 3.52 5.52 ± 3.04*† 6.16 ± 2.48 5.84 ± 5.82 0.002
7 2.53 ± 1.46 6.57 ± 9.51 3.39 ± 0.72* 4.33 ± 2.55 4.37 ± 2.87 0.608
9 1.90 ± 2.39 0.59 ± 0.80 1.49 ± 1.11* 3.11 ± 2.57 1.28 ± 0.57 0.801
120 kVp/10 mAs Solid nodule 3 27.37 ± 18.64 22.85 ± 38.83 1.84 ± 1.60*† 2.72 ± 1.16 5.44 ± 2.84 0.008
5 6.34 ± 2.89 10.26 ± 2.23 7.66 ± 2.72 6.27 ± 4.11 3.44 ± 2.87*† 0.006
7 7.15 ± 1.46 9.58 ± 3.14 9.40 ± 4.39 2.09 ± 1.52*† 9.26 ± 0.98 0.027
9 15.12 ± 16.24 8.14 ± 2.95 9.38 ± 2.90 5.42 ± 6.85 1.73 ± 1.27* 0.095
Outer GGO portion of PSN 20/9 9.87 ± 2.69 4.82 ± 6.38 3.42 ± 3.84*† 6.79 ± 3.62 7.64 ± 2.83 0.044
20/7 7.74 ± 2.95 7.66 ± 2.72 3.48 ± 5.14 4.55 ± 2.41 2.54 ± 4.18*† 0.035
20/5 3.97 ± 3.79 2.41 ± 0.86 1.97 ± 2.16*† 4.67 ± 2.41 10.78 ± 5.60 0.004
20/3 3.27 ± 2.36 9.63 ± 2.91 4.13 ± 2.19 0.99 ± 0.75*† 1.18 ± 1.48 0.001
Inner solid portion of PSN 3 9.11 ± 0.89 11.01 ± 3.97 5.57 ± 6.26* 6.32 ± 2.91 9.64 ± 2.08 0.091
5 11.42 ± 1.60 18.05 ± 7.76 5.74 ± 7.58 5.88 ± 1.94 5.54 ± 6.64*† 0.001
7 2.25 ± 0.68 3.95 ± 3.23 3.09 ± 1.00 2.19 ± 1.32* 6.86 ± 5.22 0.358
9 2.88 ± 1.72 1.95 ± 1.12 2.71 ± 1.27 4.58 ± 2.39 1.02 ± 0.21* 0.383
80 kVp/10 mAs Solid nodule 3 9.33 ± 6.35 1.58 ± 0.88 2.74 ± 2.10* 4.49 ± 1.56 3.42 ± 2.42 0.565
5 11.19 ± 9.57 7.18 ± 5.09 5.09 ± 3.89 6.72 ± 0.98 3.30 ± 2.72*† 0.001
7 8.41 ± 4.78 3.66 ± 2.05 4.74 ± 1.66 2.30 ± 1.16*† 4.88 ± 2.45 0.044
9 8.37 ± 4.65 6.05 ± 2.99 4.18 ± 1.08 1.23 ± 1.18*† 2.11 ± 1.46 < 0.001
Outer GGO portion of PSN 20/9 7.32 ± 6.64 5.20 ± 7.09 5.33 ± 3.89 4.56 ± 1.11*† 7.59 ± 2.20 0.039
20/7 6.41 ± 6.75 5.13 ± 2.85 1.73 ± 1.55*† 5.28 ± 2.25 2.71 ± 2.77 0.007
20/5 3.90 ± 2.62 2.65 ± 1.60 1.77 ± 1.62*† 2.81 ± 2.55 6.30 ± 4.48 0.026
20/3 3.13 ± 1.80 8.11 ± 5.24 2.31 ± 0.44 1.07 ± 0.61* 1.14 ± 1.34 0.146
Inner solid portion of PSN 3 10.83 ± 7.56 8.14 ± 6.45 5.84 ± 1.96* 6.90 ± 3.31 6.99 ± 5.11 0.632
5 8.52 ± 1.30 7.52 ± 3.81 7.05 ± 3.21 5.42 ± 4.75* 5.77 ± 1.54 0.774
7 3.79 ± 2.20 2.67 ± 1.44 3.25 ± 0.95 2.19 ± 1.54 2.05 ± 1.66* 0.898
9 6.08 ± 5.03 3.83 ± 2.49 2.25 ± 1.12 4.10 ± 4.07 0.42 ± 0.17* 0.156

*Lowest values, Statistically significant values.

Table 4

Image Noise Values of Five Different Reconstruction Algorithms

kjr-20-1195-i004
Radiation Doses FBP HIR IMR-R1 IMR-ST1 IMR-SP1 P
120 kVp/100 mAs 21.70 ± 3.41 19.39 ± 2.59 4.93 ± 0.80 3.22 ± 0.66 9.69 ± 1.36 < 0.001
120 kVp/50 mAs 28.33 ± 5.27 24.64 ± 3.30 6.22 ± 1.23 4.19 ± 1.37 11.01 ± 1.60 < 0.001
120 kVp/20 mAs 40.36 ± 8.24 34.89 ± 5.11 8.59 ± 1.58 5.49 ± 1.16 13.25 ± 1.85 < 0.001
120 kVp/10 mAs 54.02 ± 12.80 46.68 ± 7.44 10.54 ± 2.27 6.88 ± 1.91 15.56 ± 3.25 < 0.001
80 kVp/10 mAs 96.67 ± 21.04 80.70 ± 11.32 16.25 ± 6.16 12.49 ± 6.14 20.48 ± 5.17 < 0.001
Table 5

Interobserver Variability of Nodule Volume Measurements (ICC)

kjr-20-1195-i005
Nodule Types FBP HIR IMR-R1 IMR-ST1 IMR-SP1
Solid nodule 0.993 (0.983–0.997) > 0.999 (0.999–1.000) > 0.999 (0.999–1.000) 0.997 (0.991–0.999) 0.998 (0.996–0.999)
p value < 0.001 0.001 0.001 0.001 0.001
Outer GGO portion of PSN 0.840 (0.596–0.937) 0.932 (0.829–0.973) 0.949 (0.870–0.980) 0.974 (0.934–0.990) 0.931 (0.825–0.973)
p value < 0.001 0.001 0.001 0.001 0.001
Inner solid portion of PSN 0.998 (0.995–0.999) 0.998 (0.994–0.999) 0.999 (0.998–1.000) 0.999 (0.996–0.999) 0.999 (0.998–1.000)
p value < 0.001 < 0.001 0.001 0.001 0.001

Results of ICC are displayed in 95% confidence interval of relative differences in percentage. ICC = intraclass correlation coefficient

TOOLS
Similar articles