

 PDF
PDF ePub
ePub Citation
 Print
Print


INTRODUCTION
Establishment of a Fontan circuit is the standard treatment for patients with a functionally single ventricle (12). The Fontan procedure is usually preceded by a bidirectional Glenn shunt and is frequently accompanied by creation of a temporary fenestration to the pulmonary venous atrium (345). The Fontan circulation is characterized by an elevated systemic venous pressure and low cardiac output that results in profound and prolonged hemodynamic disturbances in all body organs with various consequences (12). The liver and intestines are particularly vulnerable to injury from elevated systemic venous pressures, resulting in chronic hepatic parenchymal damage and protein-losing enteropathy (PLE) (6789).
Although there have been growing concerns about the systemic and pulmonary complications of the Fontan operation, the underlying hemodynamic mechanisms are not well understood. We hypothesized that exploration of the regional blood flow distribution may yield new insights into Fontan-related complications. We aimed to assess the blood flow distribution in fenestrated and completed Fontan circulations in comparison with healthy controls by using phase-contrast magnetic resonance imaging (PCMRI).
Go to : 
MATERIALS AND METHODS
The institutional Research Ethics Board approved the study and waived the requirement for patient consent. We identified 39 children (18 females and 21 males; mean age, 9.3 years; age range, 3.3–17.0 years), including 15 with fenestrated Fontan circulation and 24 with completed Fontan circulation who underwent PCMRI of the thoracic and abdominal major vessels as a part of their MRI assessment. The patients' blood flow data from PCMRI were compared with those from 19 healthy children (12 females and 7 males; mean age, 13.6 years; age range, 9.0–17.0 years) who were included in a previous study (10). MRI was performed under general anesthesia (GA) in all patients with fenestrated Fontan circulation and 6 patients with completed Fontan circulation. The remaining 18 patients with completed Fontan circulation underwent MRI without GA. All healthy volunteers underwent MRI without GA in a fasting state and at 20–30 minutes after a standardized meal, as described in the previous study (10).
The patients were divided into three groups for data analysis:
MRI was performed on a 1.5T unit (MAGNETOM Avanto, Siemens Healthineers, Erlangen, Germany) using the institutional standard protocol, with PCMRI performed in a free-breathing condition (1011). The blood flow volume was directly measured in through-planes of the vessels, as illustrated in Figures 1 and 2.
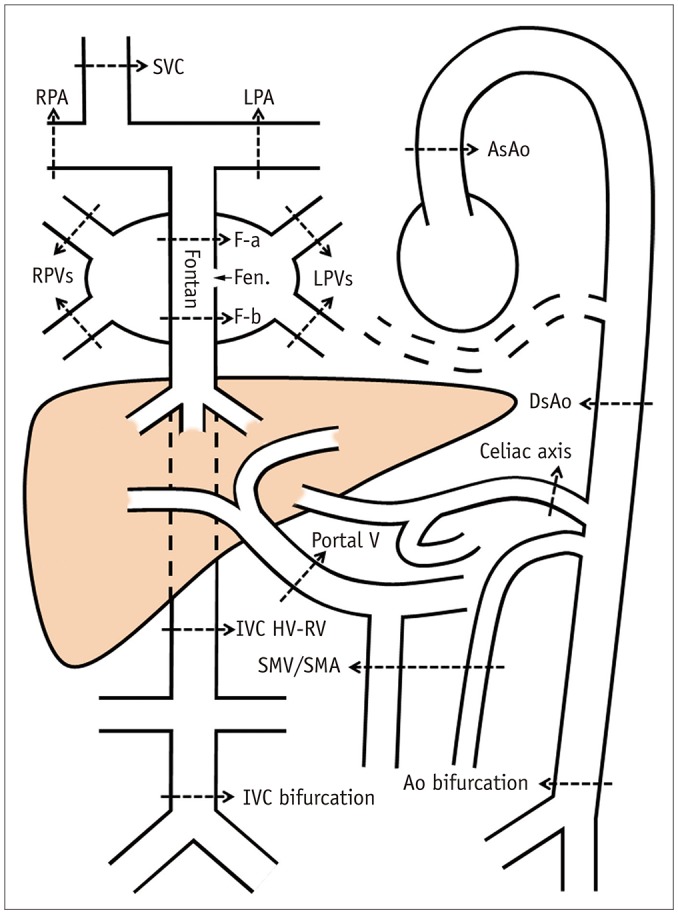 | Fig. 1Drawing showing locations of blood flow sampling for phase-contrast magnetic resonance imaging.Ao = aorta, AsAo = ascending aorta, DsAo = descending aorta at diaphragm, F-a = Fontan above fenestration, F-b = Fontan below fenestration, Fen. = fenestration, HV-RV = between hepatic venous and renal venous connections, IVC = inferior vena cava, LPA = left pulmonary artery, LPVs = left pulmonary veins, RPA = right pulmonary artery, RPVs = right pulmonary veins, SMA = superior mesenteric artery, SMV = superior mesenteric vein, SVC = superior vena cava
|
When the blood flow volumes could not be directly measured, they were calculated by using the following formulas:
Blood flow volumes were assessed using commercially available software (Q-Flow Version 5.6; Medis Medical Imaging Systems BV, Leiden, The Netherlands) and indexed to the body surface area. For assessment of interobserver agreement, two observers performed independent evaluations of the blood flow volumes for the randomly selected 11 MRI studies, yielding a total of 187 measurements.
For Groups 1 and 2, in which MRI data were obtained under GA, the flow data were compared with healthy control data obtained in the fasting state (10). For Group 3, in which MRI data were obtained without GA, the flow data were compared with the healthy control data obtained 20–30 minutes after a standardized meal (10). For comparison of the magnitude of the flow volume differences, the ratios of the mean flow volumes in the patient groups and healthy controls were calculated.
Statistical Analyses
All blood flow volumes were reported as mean ± standard deviation values. Pairs of datasets were compared using two-tailed independent- and dependent-sample t tests when appropriate and any three datasets were compared using analyses of variance. The Bland-Altman test was used for assessment of interobserver variability. Prism 7 (GraphPad Software, Inc., La Jolla, CA, USA) was used for statistical analyses.
Go to :
RESULTS
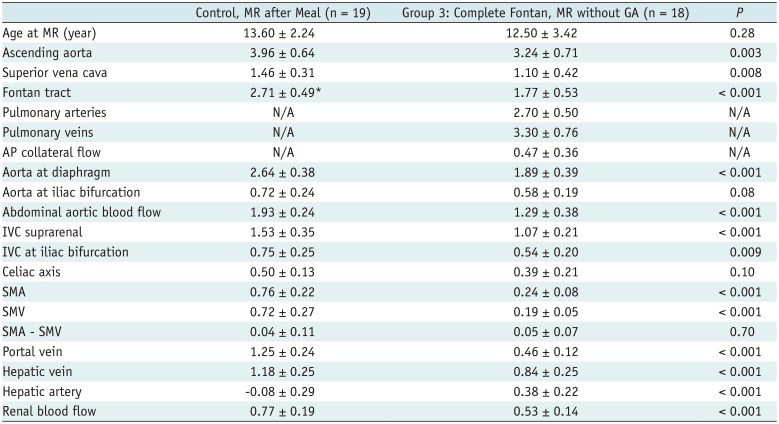
The demographic profiles of the patients and healthy controls are summarized in Table 1. The group with completed Fontan circulation included 5 patients who underwent Fontan operation without fenestration and 19 patients in whom the fenestration in the Fontan tract was closed either spontaneously (n = 6) or by catheter intervention (n = 13). All 15 patients with fenestrated Fontan circulation and 6 patients with completed Fontan circulation underwent MRI under GA. All the remaining patients underwent MRI without GA. Therefore, Groups 1, 2, and 3 consisted of 15, 6, and 18 patients, respectively.
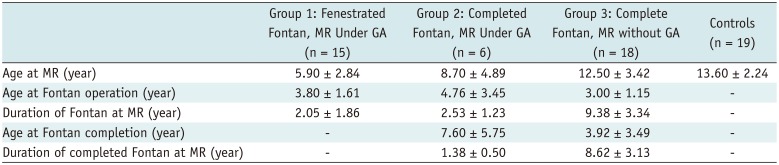
Table 1
Patients' Demographic Data
![]()
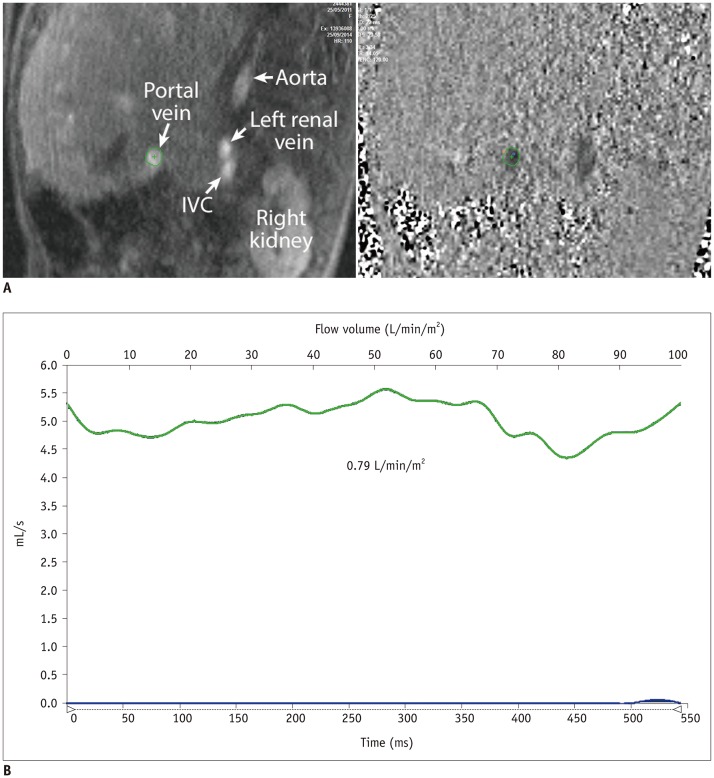
Interobserver agreement for the 187 PCMRI measurements between the two readers was excellent (R2 = 0.9962) (Fig. 3).

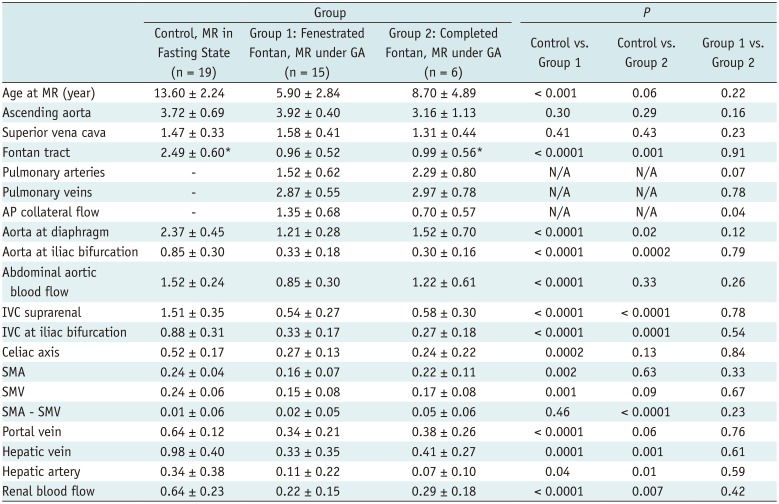
PCMRI data for patients and healthy controls are listed in Tables 2 and 3. The ratios between the blood flow in patients and healthy controls are summarized in Table 4. The difference between Groups 1 and 3 is shown graphically in Figure 4.
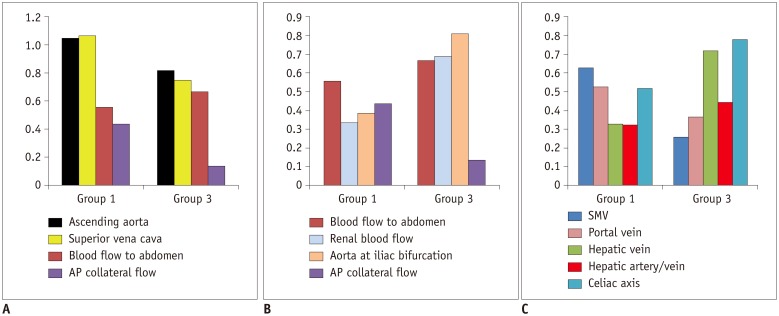 | Fig. 4Graphs showing blood flow distribution in patient groups in comparison with healthy controls.Y axis represents ratios between mean values of blood flow volumes in patient groups and healthy controls, except for ratio between hepatic arterial and venous flows (hepatic artery/vein) and AP collateral flow. Y axis for AP collateral flow indicates contribution of AP collateral flow to total pulmonary venous return. AP= aortopulmonary
|
Table 2
Phase-Contrast MR Data Obtained in Fasting State from Healthy Controls and Fenestrated (Group 1) and Completed (Group 2) Fontan Circulation Patients under GA
![]()
Table 3
Phase-Contrast MR Data from Healthy Controls after Meal and Patients with Closed Fenestration without GA (Group 3)
![]()
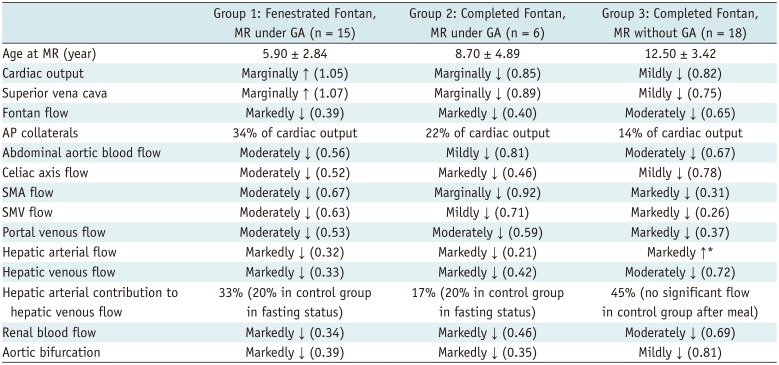
Table 4
Summary of Differences in Blood Flow among Fenestrated and Completed Fontan Circulation Groups Compared to Controls
Numbers in parentheses are ratios between flow volumes of patients and healthy control groups. Decreased blood flow volume was graded mildly, moderately and markedly when ratio was > 0.75, 0.50–0.75, and < 0.50, respectively. When difference did not reach statistical significance, it was described as ‘marginally.’ *As hepatic arterial flow is normally negligible after meal, flow ratio between patients and healthy controls is not applicable. ↑ = increased, ↓ = decreased
![]()
Group 1 (fenestrated Fontan circulation group with magnetic resonance [MR] under GA) showed marginally higher cardiac output (3.92 ± 0.40 vs. 3.72 ± 0.69 L/min/m2, p = 0.30) and marginally higher superior vena caval flow (1.58 ± 0.41 vs. 1.47 ± 0.33 L/min/m2, p = 0.41), both of which did not reach statistical significance. This group showed a large amount of aortopulmonary collateral flow, accounting for 34% of the cardiac output and 44% of the total pulmonary blood flow.
Group 3 (completed Fontan group with MRI without GA) showed mildly decreased cardiac output (3.24 ± 0.71 vs. 3.96 ± 0.64 L/min/m2, p = 0.003) with decreased flow throughout the body. This group showed a relatively small amount of aortopulmonary collateral flow as compared to Group 1 (14% vs. 34% of cardiac output).
Groups 1 and 3 showed moderately decreased blood flow to the abdomen (1.21 ± 0.28 vs. 2.37 ± 0.45 L/min/m2, p < 0.001 and 1.89 ± 0.39 vs. 2.64 ± 0.38 L/min/m2, p < 0.001, respectively). Group 1 showed moderately decreased superior mesenteric and portal venous flows (0.15 ± 0.08 vs. 0.24 ± 0.06 L/min/m2, p = 0.001, and 0.34 ± 0.21 vs. 0.64 ± 0.12 L/min/m2, p < 0.0001, respectively) and markedly decreased hepatic venous flow (0.33 ± 0.35 vs. 0.98 ± 0.40 L/min/m2, p = 0.0001). Group 3 showed markedly decreased superior mesenteric and portal venous flows (0.19 ± 0.05 vs. 0.72 ± 0.27 L/min/m2, p < 0.001 and 0.46 ± 0.12 vs. 1.25 ± 0.24 L/min/m2, p < 0.001, respectively). Despite the markedly reduced portal venous flow, the hepatic venous flow was only moderately decreased in Group 3 (0.84 ± 0.25 vs. 1.18 ± 0.25 L/min/m2, p = 0.0002), owing to the markedly increased hepatic arterial flow (0.38 ± 0.22 vs. −0.08 ± 0.29 L/min/m2, p < 0.001). Group 1 showed markedly reduced hepatic arterial flow that showed only a mildly increased contribution to hepatic venous flow in comparison with the control group (Table 4).
Group 1 showed a markedly decreased renal blood flow and flow through the aorta at the iliac bifurcation (0.22 ± 0.15 vs. 0.64 ± 0.23 L/min/m2, p < 0.001, and 0.85 ± 0.30 vs. 1.52 ± 0.24 L/min/m2, p < 0.001, respectively). In contrast, Group 3 showed moderately decreased renal blood flow and mildly reduced flow through the aorta at the iliac bifurcation (0.53 ± 0.14 vs. 0.77 ± 0.19 L/min/m2, p < 0.001 and 0.58 ± 0.19 vs. 0.72 ± 0.24 L/min/m2, p = 0.08, respectively).
Group 2 (completed Fontan circulation group with MR under GA) showed flow data similar to those in the fenestrated Fontan circulation group except for the tendency toward decreased cardiac output and superior vena caval flow (3.16 ± 1.13 vs. 3.92 ± 0.40 L/min/m2, p = 0.16 and 1.31 ± 0.44 vs. 1.58 ± 0.41 L/min/m2, p = 0.23, respectively) (Table 2). The blood flow to the abdomen was mildly reduced (1.52 ± 0.70 vs. 2.37 ± 0.45 L/min/m2, p = 0.02).
Go to :
DISCUSSION
Maintenance of the pulmonary circulation without ventricular pumping after the Fontan operation requires high systemic venous pressure, which in turn causes perpetual and pervasive effects on all body organs (12). In addition, the impaired transpulmonary flow results in low cardiac output, causing further reduction in organ perfusion. As each organ has different venous drainage mechanisms and vascular reactions to the altered circulation, the consequences of systemic venous hypertension and altered cardiac output are not uniform throughout the body. Therefore, assessment of the blood flow volume in various body parts is fundamentally important in understanding the various complications of the Fontan operation. The present study provides novel information regarding the distribution of regional blood flow in patients with Fontan circulation. In the following discussion, we use the superior vena caval flow as the surrogate for cerebral blood flow (1213) and the blood flow through the descending aorta at the iliac bifurcation as the surrogate for the flow volume to the musculoskeletal system.
The present study showed significant differences in blood flow distribution between the fenestrated and completed Fontan groups. The fenestrated Fontan group showed normal or marginally increased cardiac output, while the completed Fontan group showed decreased cardiac output. Such changes in cardiac output in Fontan circulation do not affect all organs equally. Two important factors affect the distribution of the cardiac output in the body parts in Fontan circulation: the extent of the aortopulmonary collaterals (111415) and the autoregulation mechanism of the cerebral circulation (1213). The difference in the ages of the patients in the study groups in the present investigation might also have contributed to the differences in blood flow distribution, although the effect of these differences should be minimal.
Aortopulmonary collateral flow accounts for 35–40% of the cardiac output in fenestrated Fontan circulation (16), which is similar to that seen in a bidirectional Glenn shunt (1114). Because of the diversion of such a large proportion of the cardiac output to the lungs, the blood flow available to the rest of the body is significantly compromised in the fenestrated Fontan status, despite the marginally increased cardiac output. After completion of Fontan circulation, the aortopulmonary collaterals regress spontaneously with time (15). In our pediatric patients with completed Fontan circulation, the aortopulmonary collaterals were still present but constituted a lesser volume than that in the fenestrated Fontan group.
Because of autoregulation in response to low systemic arterial oxygen saturation and high carbon dioxide content, cerebral blood flow is increased in patients with a bidirectional Glenn shunt (1213). In the fenestrated Fontan circulation patients that typically show bidirectional Glenn physiology (8), the cerebral blood flow is maintained at a normal or increased level despite the decreased amount of available blood flow. In completed Fontan circulation with a normal arterial oxygen saturation, mildly reduced cerebral blood flow may reflect reduced cardiac output in the absence of or a less pronounced cerebral autoregulation mechanism.
As a consequence of the combined effects of the two factors described above, the abdominal organs and musculoskeletal system were more severely underperfused in the fenestrated than in the completed Fontan circulation group.
The liver and intestine are particularly vulnerable to reduced perfusion in the Fontan circulation because of their high vascularity and the presence of the hepatic sinusoids between the hepatic and portal veins. This study has confirmed reduced blood flow to the liver and intestines in children with fenestrated and complete Fontan circulation that is considered to be an important predisposing factor for chronic liver disease and PLE.
The completed Fontan circulation group showed a more pronounced decrease in superior mesenteric and portal venous flows than the fenestrated Fontan circulation group, reflecting the effect of elevated systemic venous pressure. However, the hepatic venous flow was less pronouncedly decreased in the completed Fontan circulation group than in the fenestrated Fontan circulation group because of the marked increase in hepatic arterial flow. This finding indicates that reduced portal venous flow is partly compensated by the so-called hepatic arterial buffer response (HABR) (17). HABR appears less effective in the fenestrated Fontan circulation than in the completed Fontan circulation group because of the more severely compromised availability of the arterial supply to the abdomen.
The patients with completed Fontan circulation who underwent MRI under GA (Group 2) were younger than the rest of the patients with completed Fontan circulation who were imaged awake (Group 3), and showed mixed flow profiles of the fenestrated and completed Fontan circulation hemodynamics, including a marginally decreased cardiac output and cerebral blood flow and a rather large aortopulmonary collateral flow.
Renal arterial flow is diminished in Fontan circulation patients due to decreased cardiac output and increased renal venous pressure (18). The current study confirmed that the renal blood flow volume was reduced in children with Fontan circulation, with the decrease being more severe in the fenestrated Fontan circulation group than in the completed Fontan circulation group. Failure of intrinsic autoregulation of renal blood flow in conjunction with chronic liver disease in these children may result in a form of renal failure called hepatorenal syndrome. Anne et al. (19) demonstrated a high incidence of pathologic microalbuminuria in patients with Fontan circulation.
This retrospective study is limited by the small number and heterogeneity of the patient population. The clinical, laboratory, and imaging findings could not be correlated with the flow information. A significant number of MR studies were performed under GA, which could affect the hemodynamics. While the blood flow distribution undoubtedly changes according to the ventilation setting, such as positive pressure and the level of oxygenation, as well as the anesthetic agent or agents used, it was not possible to determine the net effect of GA in this retrospective study. Although such limitations would hardly be overcome even if the study were performed prospectively, future studies should attempt harmonization by setting uniform general guidelines for GA in patients with Fontan circulation. Importantly, inconsistent meal status is an additional major weakness of the current study in the completed circulation Fontan group imaged awake. PCMRI in fasting status and after a standardized meal would further clarify the physiology of Fontan circulation. Finally, direct comparison of the data between the fenestrated and completed Fontan circulation groups was limited by the different age distribution of the patients.
In conclusion, PCMRI is feasible for hemodynamic assessment of the fenestrated and completed Fontan circulation. Our study shows regional redistribution of blood flow as well as changes in the cardiac output in both circulations. The completed Fontan circulation is characterized by reduced cardiac output with diffusely decreased flow to body organs. The fenestrated Fontan circulation is characterized by normal cardiac output. However, the abdominal organs, including the kidneys and the musculoskeletal system, are more severely underperfused in fenestrated Fontan circulation than in completed Fontan circulation because of the diversion of a large amount of blood flow to the aortopulmonary collateral circulation and the brain. Further prospective studies with a baseline study early after the Fontan operation and regular follow-up are required to correlate the regional flow distribution with imaging, laboratory, and clinical findings and long-term outcomes.
Go to :
 XML Download