

 PDF
PDF ePub
ePub Citation
 Print
Print


INTRODUCTION
Idiopathic adhesive capsulitis of the shoulder (ACS) is a condition with an uncertain etiology, characterized by painful, gradual loss of both active and passive glenohumeral motion (1). Although the etiology is controversial, the underlying pathology is thought to be a combination of synovial inflammation and fibrosis of the joint capsule (2). The prevalence of ACS in the general population is 2–5%, and commonly affects patients aged more than 40 years with slight female predominance (3).
The clinical diagnostic criteria for ACS include shoulder pain and limited passive and active range of motion for more than 3 months, without other causes that can explain the symptoms (4). However, diagnosis is often challenging due to overlapping clinical features of multiple shoulder joint conditions; therefore, imaging may be needed (5).
Ultrasound (US) imaging is indicated in patients clinically suspected with ACS (5). Previous studies reported that US features of ACS mainly involve the coracohumeral ligament (CHL) (678) and inferior glenohumeral ligament (9). However, recognition of these features on conventional US is difficult due to their small dimension and unclear visualization. Shear-wave ultrasound elastography (SWE) or strain ultrasound elastography (SE), which has been used for the assessment of Achilles and common extensor tendinous lesions are potentially more sensitive than conventional US in detecting pathologic changes in tendons (101112). With this data, we wondered that the possibility of changes in the supraspinatus tendon (SST) and infraspinatus tendon (IST) as periarticular tendons instead of the CHL and inferior glenohumeral ligament on US elastography, because the pathophysiology of ACS involves a diffuse inflammation along the synovial surface of the joint capsule, glenohumeral ligaments, and periarticular tendons (13). To our knowledge, the elasticities of the SST and IST has not been investigated in symptomatic shoulders with ACS when compared to normal shoulders using US elastography. We hypothesized that elasticities of the SST and IST are higher in individuals with symptomatic shoulders with ACS than in those with normal shoulders. Thus, the primary aim of the current study was to compare the elasticity of the SST and IST in patients with ACS with those in individuals with normal shoulders with an optimal cut-off value to differentiate between the two groups. The secondary aim was to evaluate the relationship between age and elastic modulus using SWE and SE.
MATERIALS AND METHODS
Study Population
This prospective case-control study was conducted between November 2017 and March 2018 and was approved by the Institutional Review Board. Informed consent was obtained from each participant.
An orthopedic shoulder surgeon with 15 years' experience performed the initial selection of the study participants through clinical history and physical examination at the outpatient clinic, following which one musculoskeletal radiologist double-checked the selection when the shoulder US was performed on the same day. The inclusion criteria in the ACS group were 1) age more than 40 years; 2) shoulder symptoms throughout the previous 6 months; 3) painful restriction of both active and passive flexion and external rotation aside the body; and 4) no history of fracture, dislocation, arthritis, bursitis, or tumor around the shoulder joints. Exclusion criteria were 1) history of shoulder surgery or trauma; 2) presence of cervical radiculopathy, other central or peripheral neurologic deficits of the upper limb; and 3) definite tendon tear, calcifying tendinopathy, or bursitis observed in US. Tendinopathy was defined as thickening (more than 8 mm) with hypoechogenicity of the affected tendon (14).
The inclusion criteria for the control group (healthy individuals or asymptomatic contralateral shoulders of the participants) were 1) age more than 40 years and an asymptomatic shoulder; 2) normal shoulder range of motion; 3) no history of shoulder surgery or trauma; 4) no history of fracture, dislocation, arthritis, bursitis, or tumor; and 5) no evidence of tendon tear, calcifying tendinopathy, or bursitis observed in US.
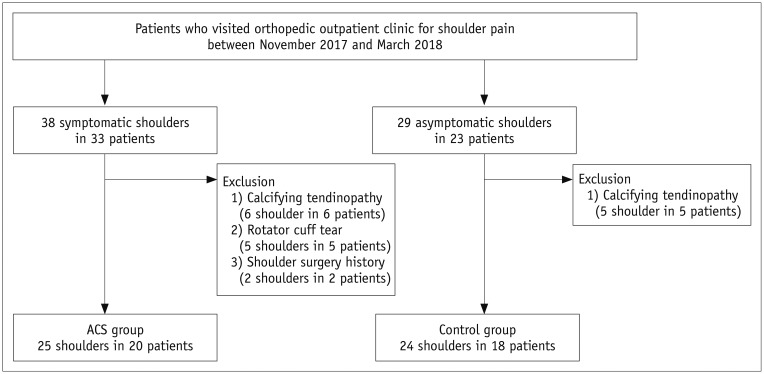
Finally, 25 symptomatic shoulders in 20 patients in ACS group (6 men and 14 women; 53.5 ± 7.9 years) and 24 normal shoulders in 18 patients in control group (12 men and 6 women; 52.6 ± 10.5 years) were included (Fig. 1).
SWE and SE Examinations
All participants underwent SWE and SE examinations of unilateral or bilateral shoulders, after conventional US, with the same protocol and US scanner (LOGIQ E9; GE Healthcare, Milwaukee, WI, USA), by one musculoskeletal radiologist with 2-years' of experience. As a pilot study, two radiologists with 19 years' experience and 2 years' experience, respectively, were trained in musculoskeletal elastography with the US applicator to minimize motion artifact on SWE and applied standardized compression on SE for 1 month before enrollment of participants. The results of the pilot study (ACS group, 10 shoulders in 7 patients; control group, 9 shoulders in 5 patients) were not included in the present study and were only used for sample size calculation and evaluation of inter-observer agreement. All participants were examined while being seated with the shoulder in a neutral position (upper arm kept down to the mid-axillary line without abduction, adduction, external rotation, or internal rotation) and elbow extension. Longitudinal images of the SST and IST were obtained with the transducer at the distal SST and IST near the greater tuberosity with an oblique coronal plane. Images of the anterior to mid SST were obtained to measure elasticity of SST and mid- to posterior IST to measure elasticity of IST because the boundary of the junction of the SST-IST is ambiguous. Detailed SWE and SE techniques are described in Supplementary Materiais.
Quantitative Measurement of Elasticity on SWE and SE Images
For quantitative measurement, we set the range of the velocity, stiffness, and strain ratio. We set the 0–10 m/s for range of the velocity, 0–300 kPa for range of the stiffness, and 0–1 for range of the strain ratio. Quantitative measurement of the elasticity was retrospectively performed by one musculoskeletal radiologist who did not perform the daily SWE and SE examinations, in random order at the workstation (LOGIQ E9) of the US scanner by retrieving elastography images. The reviewer blinded to the history of the participants, B-mode US findings, and final diagnosis. For SWE, a circular region of interest (ROI) of size 0.09 cm2 was set in the target tendon at 0.5–1 cm from the greater tuberosity. The point of the highest value (the most reddish) was set as the center of the ROI except just near the cortex. The circular ROI in the quantitative analysis provided the size of the ROI, maximum, minimum, standard deviation, and mean velocity in meter per second (m/s) and stiffness in kilopascal (kPa) (Fig. 2A). The maximum, minimum, and mean velocity and stiffness were used for statistical analyses. In SE, two circular ROIs were set in the target tendon (same manner as SWE) and subcutaneous fat layer and provided the strain ratio (strain ratio = subcutaneous fat tissue strain/target tendon strain) (Fig. 2B), which was used for statistical analyses. The size of the ROI in the SE was not predefined due to unavailability of information regarding the same. All measurements were performed twice and an average was recorded for statistical analyses.
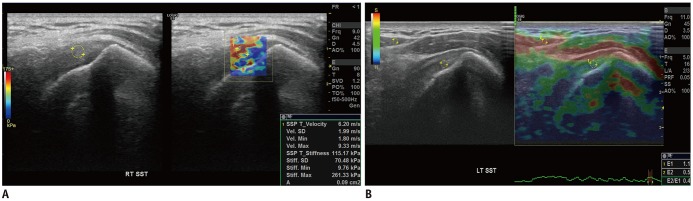
Fig. 2
Measurement of elastic modulus with shear-wave (A) and strain (B) ultrasound elastography.
A. 65-year-old woman with ACS. Circular ROI of size 0.09-cm2 was set in target tendon at 0.5–1 cm from greater tuberosity (ROI1). Maximum, minimum, SD, and mean velocity in meter per second (m/s) and stiffness in kilopascal (kPa) are autogenerated. B. 75-year-old man with normal shoulder. Two circular ROIs were set in target tendon at 0.5–1 cm from greater tuberosity (ROI1) and subcutaneous fat (ROI2). Strain ratio (ROI2/ROI1) is autogenerated. ROI = region of interest, SD = standard deviation, SST = supraspinatus tendon
![]()
Statistical Analyses
Descriptive statistics were reported using the median and interquartile ranges because a preliminary Kolmogorov-Smirnov test demonstrated that the samples did not follow a normal distribution. The four components in the statistical analyses were 1) comparison of velocity, stiffness, and strain ratio using the Mann-Whitney U test; 2) calculation of the cut-off value of the velocity, stiffness, and strain ratio using the receiver operating characteristic (ROC) curve; 3) calculation of the correlation coefficient (ρ) between elasticity and age using Spearman correlation; and 4) calculation of the inter-observer agreement using intraclass correlation coefficient (ICC). Areas under the ROC curves (AUCs) and 95% confidence intervals were calculated. Optimal cut-off values were defined as the point at which the value of “sensitivity + specificity-1” was maximum (Youden's index) (15). The Spearman correlation coefficient was interpreted as follows: less than 0.2, none; 0.21–0.50, weak; 0.51–0.80, moderate; and more than 0.81, strong (16). The ICC of 0.01–0.20 indicated slight agreement; 0.21–0.40, fair; 0.41–0.60, moderate; 0.61–0.80, substantial; and 0.81–1.00 was considered almost perfect (17). P values less than 0.05 were considered statistically significant.
RESULTS
SWE and SE Examinations in the ACS and Control Groups
The baseline characteristics and inter-observer agreement are described in the Supplementary Materials (in the online-only Data Supplement). Table 1 shows results of SWE and SE. A significant difference was observed between the ACS and control groups in all parameters of the SST and IST in SWE (all p values < 0.001). The mean, minimum, and maximum velocities of the SST and IST in the ACS group were significantly faster than those in the control group. The mean, minimum, and maximum stiffness values of the SST and IST in the ACS group were significantly higher than those in the control group. SST and IST strain ratios from SE were significantly different between the ACS and control groups (all p values < 0.001). Specifically, SST and IST strain ratio in the ACS group were significantly lower in the control group. The inter-observer agreements of the SWE and SE examinations are described in the Supplementary Materials.
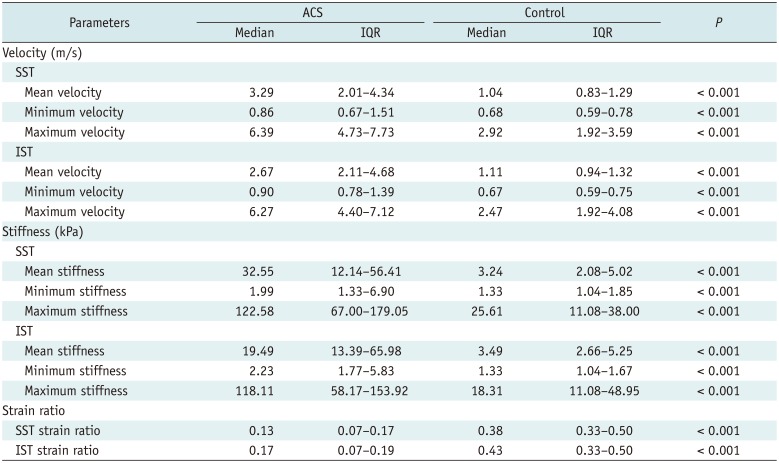
Table 1
Results of SWE and SE
![]()
Optimal Cut-Off Value of Elastography Parameters in Differentiating the ACS and Control Groups
Table 2 shows the optimal cut-off value with diagnostic performance of SWE and SE parameters. In SWE, SST mean velocity (cut-off, 1.69 m/s) and IST mean velocity (cut-off, 1.80 m/s) showed high AUC of > 0.970. Similarly, SST mean stiffness (cut-off, 8.53 kPa) and IST mean stiffness (cut-off, 9.76 kPa) showed high AUC of > 0.970 (Fig. 3). SST (cut-off, 0.21) and IST strain ratios (cut-off, 0.23) in the SE also showed high AUC of > 0.980 (Fig. 4).
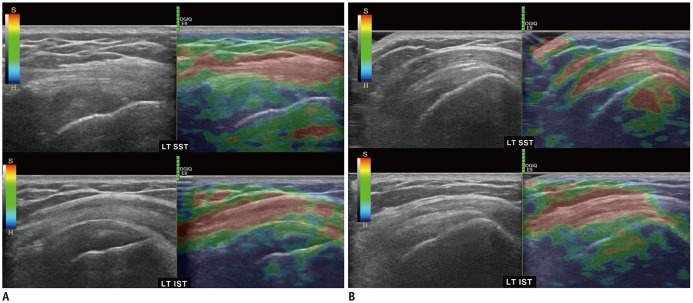
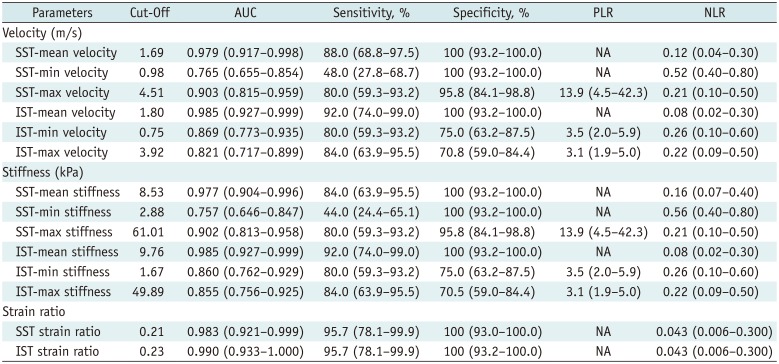
Fig. 3
Symptomatic shoulder in ACS group (A) and normal shoulder in control group (B) with shear-wave ultrasound elastography.
A. 43-year-old man with ACS. Color in SST (upper) and IST (lower) is yellow to red, which indicates that tendons are stiff (SST-mean velocity, 4.12 m/s; SST-mean stiffness, 50.87 kPa; IST-mean velocity, 5.33 m/s; IST-mean stiffness, 85.33 kPa). B. 47-year-old man with normal shoulder. Color in SST (upper) and IST (lower) is entirely blue, which indicates that tendon is soft (SST-mean velocity, 1.06 m/s; SST-mean stiffness, 3.36 kPa; IST-mean velocity, 0.98 m/s; IST-mean stiffness, 2.88 kPa). IST = infraspinatus tendon
![]()
Fig. 4
Symptomatic shoulder in ACS group (A) and normal shoulder in control group (B) with strain ultrasound elastography.
A. 51-year-old man with ACS. Color in SST (upper) and IST (lower) is green to dark blue, which indicates that tendons are stiff (SST-strain ratio, 0.06; IST-strain ratio, 0.05). B. 47-year-old man with normal shoulder. Color in box in SST (upper) and IST (lower) is yellowish, which indicates that tendon is soft (SST-strain ratio, 0.33; IST-strain ratio, 0.33).
![]()
Table 2
Diagnostic Performance of Shear-Wave and Strain US Elastography Parameters
![]()
Elasticity of the SST and IST in the ACS and Control Groups according to Age
In the control group, no (ρ = −0.019 to 0.075) or weak (ρ = 0.239) correlations were observed between elastography parameters and age. Similarly, in the ACS group, no correlations (ρ = −0.066 to 0.149) or weak correlations (ρ = −0.340 to −0.283) were observed between elastography parameters and age. Moderate or strong correlation was not observed between elastography parameters and age (Table 3).
Table 3
Relationship between Elastic Modulus and Age
![]()
DISCUSSION
In patients with non-acute shoulder pain, US of the musculoskeletal system is preferred due to higher cost-effectiveness compared to magnetic resonance (MR) (18). US elastography is being used increasingly in recent times to evaluate the mechanical properties (elasticity) of tissues (1011). SWE and SE are two different methods that follow different principles of elastography. SWE quantitatively displays the velocity and stiffness of the shear waves resulting from applied acoustic radiation force and provides an indirect estimation of tissue stiffness from the velocity of shear waves (1920). SE semi-quantitatively displays the strain ratio (subcutaneous fat/tendon) resulting from manual compression of tissues, and shows a lower value in hard tissues than in soft tissues (19).
Despite the advantages of US, limited studies (6789212223) have investigated the findings of the technique in ACS (Table 4). ACS patients with symptoms of pain and limited range of motion may not be able to maintain an abducted shoulder position to evaluate the inferior glenohumeral ligament. Moreover, as noted by Michelin et al. (9), CHL is not easily measurable by US owing to unclear differentiation in the rotator interval, especially in ACS. Additionally, previous studies have reported that CHL was not observed in 10–20% of patients with ACS (624). Limitations of Doppler US for the diagnosis of ACS lie in the invasive nature of the procedure and ability to detect only larger vessels with signals above the noise level and flow velocities above the threshold of the wall filter (2526). Thus, the current study hypothesized that evaluation of the SST and IST on US elastography could overcome the limitations of the previous studies.
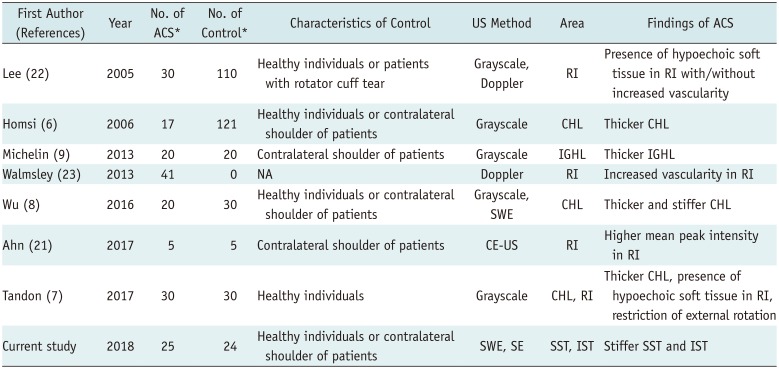
Table 4
Literature on US Findings of ACS
| First Author (References) | Year | No. of ACS* | No. of Control* | Characteristics of Control | US Method | Area | Findings of ACS |
|---|---|---|---|---|---|---|---|
| Lee (22) | 2005 | 30 | 110 | Healthy individuals or patients with rotator cuff tear | Grayscale, Doppler | RI | Presence of hypoechoic soft tissue in RI with/without increased vascularity |
| Homsi (6) | 2006 | 17 | 121 | Healthy individuals or contralateral shoulder of patients | Grayscale | CHL | Thicker CHL |
| Michelin (9) | 2013 | 20 | 20 | Contralateral shoulder of patients | Grayscale | IGHL | Thicker IGHL |
| Walmsley (23) | 2013 | 41 | 0 | NA | Doppler | RI | Increased vascularity in RI |
| Wu (8) | 2016 | 20 | 30 | Healthy individuals or contralateral shoulder of patients | Grayscale, SWE | CHL | Thicker and stiffer CHL |
| Ahn (21) | 2017 | 5 | 5 | Contralateral shoulder of patients | CE-US | RI | Higher mean peak intensity in RI |
| Tandon (7) | 2017 | 30 | 30 | Healthy individuals | Grayscale | CHL, RI | Thicker CHL, presence of hypoechoic soft tissue in RI, restriction of external rotation |
| Current study | 2018 | 25 | 24 | Healthy individuals or contralateral shoulder of patients | SWE, SE | SST, IST | Stiffer SST and IST |
![]()
In the current study, elasticities of the tendons in the symptomatic shoulder in participants with ACS showed significantly higher velocities and stiffness of the SST and IST compared with normal shoulders. Thus, the results of the current study were in agreement with the hypothesis and two potential etiological mechanisms have been proposed. The first is that synovial inflammation due to ACS results in a direct effect on the periarticular tendons, causing subsequent inflammation and fibrosis of the SST and IST. DePalma (13) histologically demonstrated the chronic inflammatory changes (marked edema, degeneration of the collagenous fibers, and pronounced round cell infiltration) of the SST in ACS. The second potential mechanism is that immobilization of the shoulder joint due to ACS indirectly affects the tendons (adaptation to tension of the muscle [supraspinatus and infraspinatus]-tendon unit). Biomechanically, joint immobilization causes reduction of glycoaminoglycans, hyaluronic acid, chondroitin 4 and 6, dermatan sulfate, and water content in the tendon (27). A study conducted on a rabbit model reported that tension in the muscle-tendon unit (muscle contraction) changes the properties of the tendon around an immobilized joint and leads to shortening in the resting state for adaptation, and is related to increased strain (28). Between these two hypotheses, the former mechanism was unlikely. In presence of intra-tendinous fibrosis, enhancement of the tendon should be visible; however, enhancement of the articular side of SST and IST was not observed in the previous articles related to contrast-enhanced MR findings in ACS (2930313233343536). Thus, the second hypotheses may provide more likely explanations for the development of stiffer SST and IST.
Softening of tendons occurs in most shoulder diseases, such as rotator cuff tendinopathy and tear, or shoulder impingement syndrome (33373839). In contrast, hardening of tendons is observed in ACS; thus, we speculated that stiffer SST and IST could be used as an indirect sign of ACS. US elastography studies may be required to prove the hypotheses in patients with immobilization.
The results of the current study may have important clinical implications because these quantitative or semi-quantitative elastography features, which can be used to characterize tissues, can be used to not only confirm the clinical diagnosis but also aid in active monitoring by allowing assessment of post-treatment changes during follow-up in ACS. Elastography parameters have been used to evaluate the treatment response in inflammatory myopathies (40). Additionally, the severity and interval change of the stiffness might help determine the treatment plan (conservative treatment vs. manipulation) in patients with ACS.
The relationship between age and elasticity of the tendon, which is a debatable topic, was also evaluated in the current study, and showed little correlation in participants aged more than 40 years. Baumer et al. (41) concluded that a positive correlation was observed between age and SST due to accumulation of advanced glycation end-product crosslinks. However, the linear regression model in this study was not fit, because r2 was low and showed weak correlation (range, 0.33–0.38). In contrast, Hsiao et al. (42) demonstrated that elasticity decreased in the aging patellar tendon in healthy individuals due to loss of organized collagen fibrils and tissue metaplasia. Meanwhile, two previous studies (4344) concluded that the correlation between age and SST and between age and the Achilles tendon were not significant. US elastography studies on multiple scanners and multiple tendons with histological correlation at all ages may be needed to determine the relationship between age and tendon elasticity.
The current study is associated with certain limitations. First, main limitation of our study was the lack of a reference standard diagnosis. We used clinical diagnostic criteria for diagnosis of ACS; diagnosis of ACS was not based on surgical findings; thus, the radiological-histological correlation was not evaluated. This was inevitable because of the disease characteristics and urgency (clinical diagnosis and initial conservative treatment) (5). Alternatively, MR arthrography is an optional method for confirmation of ACS. However, MR arthrography is invasive; therefore, is not recommended at our institution. Moreover, conservative treatment is recommended for ACS (the treatment plan is not changed despite confirmation of ACS on MR arthrography). Thus, we could not use MR arthrography to confirm ACS. Second, the participants in each group were not age- or sex-matched, which may be attributed to the strict inclusion criteria. The ACS group predominantly included women while the control group predominantly comprised men. However, age and sex were not significantly different between the ACS and control groups. Moreover, based on sex, the mean velocity, mean stiffness, and strain ratio of the SST and IST were not significantly different in all cohorts, (p = 0.18–0.68). Third, specific ROIs within the SST and IST near the greater tuberosity were measured, which may not represent all the relevant tendons. However, interquartile range of the mean velocity, mean stiffness, and strain ratios did not overlap between the ACS and control groups in the current study. This could signify that the difference in the characteristics of the tissue (fibrotic vs. normal) was clear, based on the location of the ROI (0.5–1 cm from the greater tuberosity). Fourth, the effects of the orientation of the probe and the depth of the ROI were not considered, which may affect the value of elasticity. Previous studies have reported higher shear wave velocities in tendons and muscles in sagittal orientation (longitudinal) (4546). Moreover, shear-wave velocities decreased with an increase in the scanning depth, although strain ratio was not influenced by the scanning depth (47). To address these limitations, scanning was performed consistently (longitudinal) and ROI not too deep (≤ 2 cm). Fifth, intra-observer agreement was not evaluated. Our research ethics board deemed it inappropriate to reassess the US at different examination dates due to lack of benefit to the patient. Good intra-observer agreement could be expected in the current study, as corroborated by previous studies on US elastography (848); however, this aspect should be addressed in a future validation study. Finally, only participants with presumed idiopathic ACS (mainly clinical stage 2 and 3) (49) were included, which may have limited the generalizability of the results. In addition, US elastography was performed in only neutral position. Further studies that consider patients at all clinical stages (stage 1–4) and secondary ACS with other positions (e.g., abduction-external rotation or Crass position) are necessary to provide further information.
In conclusion, SWE and SE indicated that the SST and IST were stiffer in patients with ACS than in normal shoulders regardless of aging. The routine evaluation of the elasticity of the SST and IST, emphasizing the quantitative evaluation, may be helpful in patients with shoulder pain to confirm the occurrence of ACS.
 XML Download