

 PDF
PDF ePub
ePub Citation
 Print
Print


INTRODUCTION
Venous thromboembolisms, including deep vein thrombosis (DVT) and pulmonary embolism, are becoming a major global burden, with an estimated 10 million cases annually (1). The number of venous thromboembolism cases has steadily increased in line with population aging, greater life expectancies, increased prevalences of comorbidities (e.g., obesity, heart failure, and cancer), and improved sensitivities of imaging tests (12). Approximately one-third of patients with symptomatic venous thromboembolism present with pulmonary embolism, whereas the other two-thirds present with DVT alone (3). Death occurs within 1 month of diagnosis in −6% of DVT cases and in 12% of the cases with pulmonary embolism (3).
Whole-leg or limited compression ultrasonography is the first imaging method used to detect DVT (4). Whole-leg compression ultrasonography requires skilled operators, who are usually available only during working hours, and is completed in 10–15 minutes. In contrast, limited compression ultrasonography requires less expertise and can be performed in 3–5 minutes in a routine setting; however, serial examinations are required in at least 70% of patients (5). Furthermore, the diagnosis of pelvic and inferior vena caval DVT by compression ultrasonography can be challenging (6).
Computed tomography (CT) venography largely overcomes the limitations of compression ultrasonography, but its use is associated with the risks posed by radiation exposure and iodine contrast. Reduced kilovoltage (kVp) and iterative reconstruction methods, such as adaptive statistical iterative reconstruction (ASIR) and model-based iterative reconstruction (MBIR), have been used in clinical practice to reduce radiation doses and increase iodine contrast (78910111213141516). MBIR is a comprehensive iterative reconstruction model featuring advanced system modeling and optics statistics, and several studies have shown that CT venography using MBIR at 80 kVp provides superior image quality at a lower radiation dose than CT venography using the filtered back projection (FBP) or ASIR (89). However, the reconstruction time of CT venography using MBIR (about 1 min/cm) is too long for daily practice (9).
The recently developed ASIR-V approach de-emphasizes system optics modeling and provides a reconstruction speed similar to FBP. Several studies have shown that ASIR-V provides better image quality at lower radiation doses than conventional iterative reconstruction for head, coronary, chest, and abdominal CT (1718192021). However, no study has compared CT venography using ASIR-V to that using conventional MBIR.
The purpose of our study was to compare CT venography using ASIR-V at 70 kVp and MBIR at 80 kVp with respect to objective and subjective image quality and radiation doses.
Go to : 
MATERIALS AND METHODS
This retrospective study was approved by our Institutional Review Board, which waived the requirement for informed consent.
Study Population
One hundred and sixty-two CT venography examinations of lower extremities were performed at our institution between May and December 2017. The study included adult patients who underwent CT venography using MBIR at 80 kVp or ASIR-V at 70 kVp. Patients who underwent CT venography using other scanners (n = 73) or were aged < 18 years (n = 1) were excluded. Eighty-eight patients that underwent CT venography using MBIR at 80 kVp (n = 43) or ASIR-V at 70 kVp (n = 45) were included in the study. In addition, patients with DVT of the inferior vena cava (IVC) (n = 1, examined using ASIR-V at 70 kVp), patients with DVT of both popliteal veins (n = 1, examined using ASIR-V at 70 kVp), and patients who underwent total knee replacement arthroplasty (n = 3, two patients examined using MBIR at 80 kVp and one patient examined with ASIR-V at 70 kVp) were also excluded. The remaining 83 patients composed the study cohort.
The final study cohort included 41 patients who underwent CT venography using MBIR at 80 kVp (Group A; 21 men and 20 women; mean age, 55.5 years) and 42 patients who underwent CT venography using ASIR-V at 70 kVp (Group B; 18 men and 24 women; mean age, 57.3 years). After the installation of a CT scanner equipped with ASIR-V in September 2017, we lowered the tube voltage from 80 to 70 kVp because lowering the tube voltage reduced the radiation dose and increased venous attenuation due to a greater photoelectric effect.
Information regarding age, sex, and body mass indices were obtained from medical records.
Image Acquisition and Reconstruction
Patients in Group A underwent imaging with a 64-detector CT unit (Discovery CT 750 HD; GE Healthcare, Waukesha, WI, USA), while those in Group B underwent imaging with a 256-detector CT unit (Revolution CT; GE Healthcare). CT parameters used for imaging in groups A and B are presented in Table 1. For contrast enhancement, we intravenously administered a nonionic iodinated contrast medium (ioversol [Optiray 320 mg/mL]; Mallinckrodt Pharmaceuticals, Dublin, Ireland; 2 mL/kg body weight) without dilution into the right cubital vein at 3 mL/s and followed this with an immediate 25-mL saline flush at the same injection rate. CT venography was performed from the level of the 12th thoracic vertebra to toes from 4 minutes after initiating contrast injection for all patients. One radiologist recorded the CT dose index (CTDI; mGy) and dose-length product (DLP; mGy × cm) in a picture archiving and communication system. Reconstruction times were recorded by a radiologic technician at each examination.
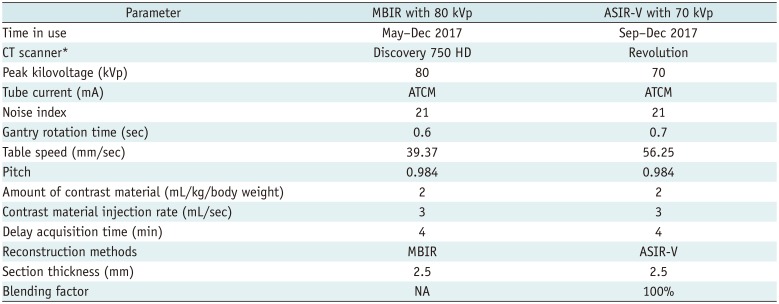
Table 1
CT Venography Protocols
![]()
Image Analysis
Two radiologists (with 8 and 20 years of experience in vascular imaging) independently reviewed the indirect CT venography findings in soft tissue windows (widow width, 400 Hounsfield unit [HU]; window level, 40 HU). Both were blinded to the CT modalities and protocols and were only made aware of the fact that the patients had undergone CT imaging for evaluation of DVT of the lower extremities.
CT scans were evaluated for objective (vascular enhancement, image noise, signal-to-noise ratio [SNR], contrast-to-noise ratio [CNR]) and subjective (quantum mottle, delineation of vein contour, and venous enhancement) image quality indicators at the IVC and femoral and popliteal veins. Objective and subjective evaluations in each patient were performed at least 2 weeks apart to reduce recall bias. Reports from the previous readout sessions were not consulted, reviewed, or altered at subsequent sessions.
For the objective analysis, the two readers independently positioned five circular regions of interest (ROIs) on the IVC at the level of the left renal vein, on the right femoral vein at the level of the femoral head, on the right popliteal vein at the level of the knee joint, on adductor muscle, and on subcutaneous fat. When a patient had DVT in a right-side vein, measurements were performed on the contralateral vein. ROI areas of veins included more than two-thirds of the vessel diameters, and ROI areas of adductor muscle and subcutaneous fat varied from 20 to 30 mm2. Vascular enhancement and image noise were defined as mean attenuation value (HU) and as standard deviation (SD) within the ROI of a vein, respectively. SNRs and CNRs of each vein were calculated using the following formulas: SNR = vein HU / SD of subcutaneous fat and CNR = (vein HU - adductor muscle HU) / SD of subcutaneous fat, respectively (913).
For subjective analysis, quantum mottle, delineation of vein contours, and venous enhancement were assessed using a 4-grade system as follows: quantum mottle (grade 1, diffuse inhomogeneous; grade 2, moderate mottle; grade 3, mild mottle; grade 4, diffuse homogeneous without mottle), delineation of vein contour (grade 1, < 50%; grade 2, 50% to < 75%; grade 3, 75–99%; and grade 4, 100%), and venous enhancement (grade 1, less than adjacent muscular enhancement; grade 2, similar to adjacent muscular enhancement; grade 3, greater muscular enhancement but less than adjacent arterial enhancement; grade 4, similar to the adjacent arterial enhancement) (1222). Overall image quality was defined as the sum of the grades of quantum mottle, delineation of vein contour, and venous enhancement at each anatomic structure (total score, 36).
Statistical Analysis
Clinical information (age, sex, and body mass index), radiation dose (CTDI, DLP), reconstruction time, and objective (vascular enhancement, image noise, SNR, CNR) and subjective (quantum mottle, delineation of vein contour, venous enhancement, overall image quality) image quality indicators as assessed by readers 1 and 2 were tested for normality using the Shapiro-Wilk test (p values of < 0.05 were taken to indicate a non-normal distribution). For normally distributed data, the significances of intergroup differences were determined using the two-tailed Student's t test whereas for non-normally distributed data, the Mann-Whitney test was used. Inter-reader reliabilities were assessed using the intraclass correlation coefficient (ICC) for clinical information, radiation dose, reconstruction time, and objective analysis and the kappa statistic with the linear weighted method for the subjective analysis. Degrees of agreement based on ICCs and kappa values were interpreted using the following criteria: 0–0.20, poor; 0.21–0.40, fair; 0.41–0.60, moderate; 0.61–0.80, good; and 0.81–1.00, excellent (23). The analysis was performed using SPSS Ver. 19.0 (IBM Corp., Armonk, NY, USA), and statistical significance was accepted for p values < 0.05.
Go to :
RESULTS
Clinical information (age, sex, body mass index) and radiation dose (CTDI, DLP) were not significantly different in the two groups (p ≥ 0.108). However, mean reconstruction time was significantly shorter in Group B (ASIR-V at 70 kVp) than in Group A (1 min 43 s vs. 131 min 1 s; p < 0.001) (Table 2).
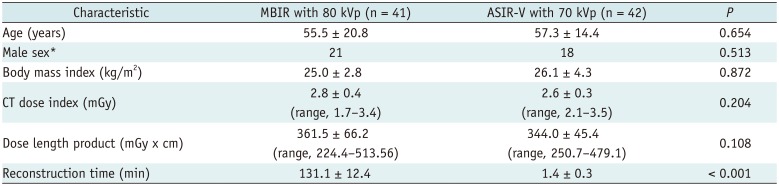
Table 2
Patient Characteristics, Radiation Doses, and Reconstruction Times
![]()
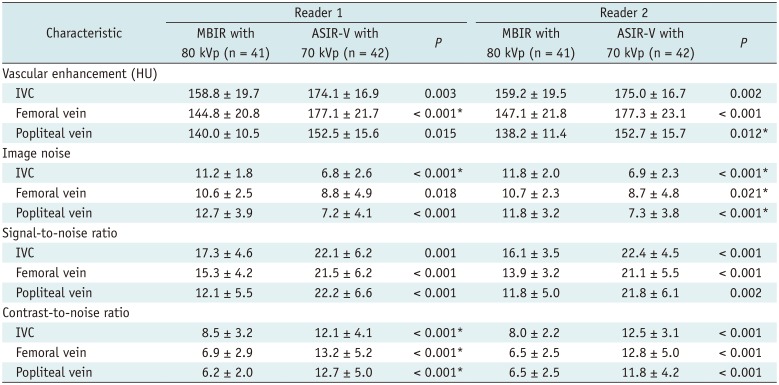
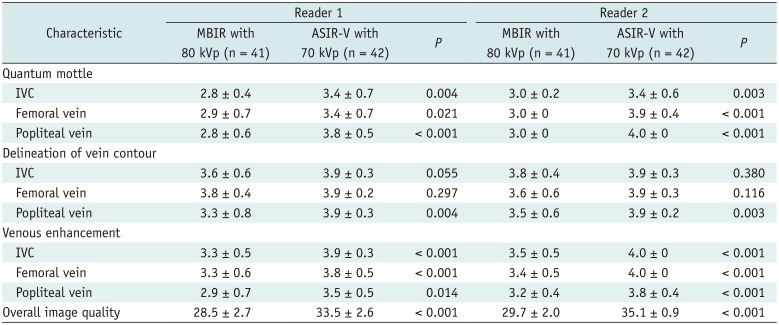
Vascular enhancement, SNR, and CNR were significantly greater in Group B (p ≤ 0.015), and image noise was significantly lower in Group B for both readers (p ≤ 0.021) (Table 3). All subjective image quality indicators, except for delineation of vein contour at the IVC and femoral vein, were significantly greater in Group B for both readers (p ≤ 0.021) (Table 4, Fig. 1).
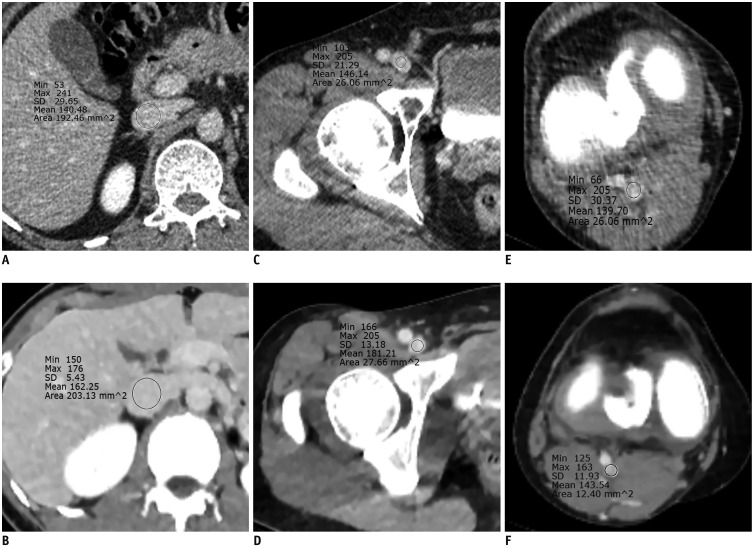 | Fig. 1Computed tomography images obtained using MBIR at 80 kVp (A, C, and E) or ASIR-V at 70 kVp (B, D, and F).Regions of interest were positioned within inferior vena cava (A, B) at level of left renal vein, within right femoral vein (C, D) at level of femoral head, and within right popliteal vein (E, F) at level of knee joint. Mean vascular enhancement (Hounsfield units) and subjective venous enhancement of three veins were greater with ASIR-V at 70 kVp (A, C, and E) than with MBIR at 80 kVp (B, D, and F). Quantum mottles of three veins were lower with ASIR-V at 70 kVp (grade 1, A; grade 2, C; and grade 2, E) than with MBIR at 80 kVp (grade 3, B; grade 4, D; and grade 3, F). ASIR = adaptive statistical iterative reconstruction, MBIR = model-based iterative reconstruction, SD = standard deviation
|
Table 3
Objective Image Quality Indicators
![]()
Table 4
Subjective Image Quality Indicators
![]()
Inter-reader reliabilities for vascular enhancement of the IVC and femoral and popliteal veins were excellent (ICC = 0.976, 0.977, and 0.920, respectively, in Group A; 0.992, 0.961, and 0.985, respectively, in Group B); those for image noise of the IVC, femoral vein, and popliteal vein were fair to excellent (ICC = 0.684, 0.715, and 0.768, respectively, in Group A; 0.847, 0.952, and 0.615. respectively, in Group B); those for SNR of the IVC, femoral vein, and popliteal vein were good to excellent (ICC = 0.731, 0.878, and 0.754, respectively, in Group A; 0.791, 0.827, and 0.895, respectively, in Group B); those for the CNR of the IVC, femoral vein, and popliteal vein were excellent (ICC = 0.836, 0.878, and 0.851 in Group A; 0.812, 0.883, and 0.902 in Group B); and those for overall subjective image quality were fair (weighted kappa = 0.581 in Group A and 0.521 in Group B).
Go to :
DISCUSSION
This study is the first on the application of ASIR-V to CT venography of the lower extremities. The objective and subjective image quality indicators of CT venography performed using ASIR-V at 70 kVp were better than those obtained using MBIR at 80 kVp. Furthermore, the mean reconstruction time for CT using ASIR-V at 70 kVp (1 min 43 s) was significantly shorter than that for MBIR at 80 kVp (131 min 1 s).
Iterative reconstruction algorithms can reconstruct higher-quality images with less noise and fewer artifacts even when the original data are obtained at low signal strengths. Iterative reconstruction algorithms have been continually improved to address their shortcomings, and at present, first-generation iterative reconstruction algorithms such as ASIR, which is based on system noise and object modeling, are widely used in clinical practice. ASIR takes full account of the statistical noise in data by performing iterative calculations on raw data to reduce image noise rapidly without adversely affecting image spatial resolution in comparison with FBP (242526). However, ASIR causes image degradation due to the presence of artificial textures and reduces spatial resolution when a higher percentage of blending is used (27). On the other hand, MBIR is a second-generation iterative reconstruction algorithm that performs comprehensive iterative reconstruction, which includes noise, object, physics, and optics modeling that can reduce image noise and radiation dose more effectively than ASIR and simultaneously improve image spatial resolution (28293031). However, due to the longer processing times (about 1 min per 1 cm), MBIR is difficult to apply in emergency cases and has yet to be used routinely in clinical practice.
ASIR-V is a newly developed reconstruction algorithm that focuses primarily on the modeling of noise, object, and physics rather than on the optics. In the present study, objective and subjective image quality indicators were found to be better for ASIR-V at 70 kVp than for MBIR at 80 kVp despite the tube voltage reduction and the use of reconstruction without the optics modeling. We attribute this to the retention of the data modeling acquisition system (photon noise and electronic noise) and the noise characteristics of reconstructed images obtained by the advanced system noise modeling in ASIR-V. In theory, the ASIR-V algorithm reduces image noise more effectively, shows better density resolution, and more effectively suppresses image artifacts than conventional iterative reconstruction, thereby providing images that better depict anatomical details, are more valuable diagnostically, and have greater clinical value. Furthermore, in the present study, the image processing time of ASIR-V (1 min 43 s) was much lower than that of MBIR (131 min 1 s). Unlike MBIR, which incorporates four modeling procedures, ASIR-V discards the optics modeling, which is the most time-consuming and computationally demanding part of the reconstruction process, making ASIR-V a real-time reconstruction algorithm (21).
Currently, many radiologists and manufacturers offer reconstructive technologies based on combinations of FBP and ASIR-V. As the percentage contribution of ASIR-V increases, image noise decreases and SNR and CNR increase, although quality problems such as artificial textures or blotchy appearance can occur (1718192032). We set the blending factor to 100% because we considered it more important to reduce image noise and improve spatial resolution than to improve artificial texture for vascular imaging. Furthermore, at high percentages of blending factors, the ASIR-V algorithm produces better textures than does the ASIR algorithm (2032). Benz et al. (33) reported that ASIR-V provided better quality images of coronary arteries at 100% than at 0–80%. Pontone et al. (17) reported that although objective image quality indicators, such as SNR, CNR, and image noise, of coronary arteries were better at higher ASIR-V percentages, 60% ASIR-V produced significantly higher subjective analysis scores for image quality. In our experience, when evaluating the surrounding structures in the vessels, it might be better to lower the ASIR-V percentage slightly. However, 100% ASIR-V may be better when focusing on intravascular imaging such as evaluation of DVT. Further studies are needed to determine the effect of the blending factor percentage on subjective image quality.
We compared iterative reconstructions using different tube voltages since the lowest applicable tube voltage was 80 kVp for MBIR and 70 kVp for ASIR-V. Lowering tube voltage increases vascular enhancement in the absorption spectrum of iodine, which exhibits markedly higher attenuations at lower X-ray energies approaching the K-edge of iodine at 33.2 keV (1034353637). Mean photon energies of X-ray beams have been reported to be 61.5 keV at 140 kVp, 56.8 keV at 120 kVp, 51.6 keV at 100 kVp, and 43.7 keV at 80 kVp (35). Accordingly, lowering tube voltages increases the photoelectric effect and increases the mean attenuation value of iodine (37), and thus, the use of 70 kVp rather than 80 kVp for CT venography shifts the X-ray beam mean energy closer to the K-edge of iodine and improves vascular enhancement.
Our study has the following limitations. First, it was a retrospective study of a relatively small number of patients. In the present study, the radiation dose of ASIR-V at 70 kVp was lower than that of MBIR at 80 kVp, but it was not significantly different in the two groups. If the study contained a large number of patients, there could have been a significant difference; the slight difference we noted may be significant because CT venography of the lower extremity required a long scan length and DVT has a high retest rate due to a strong recurrence tendency (38). Second, we did not evaluate the diagnostic accuracy for the presence of DVT, since this was beyond the scope of our study; rather, we focused on CT image quality.
In conclusion, CT venography using ASIR-V at 70 kVp was better than that with MBIR at 80 kVp in terms of image quality and reconstruction time at similar radiation doses.
Go to :
 XML Download