

 PDF
PDF ePub
ePub Citation
 Print
Print


INTRODUCTION
Diffusion-weighted imaging (DWI) is one of the most widely used sequences in daily radiological practice and image-based research. Its various clinical applications include predicting infarct cores in ischemic strokes (123), grading and differentiating abscesses and malignant brain tumors (4), and evaluating treatment responses in oncology (567). Apparent diffusion coefficient (ADC) is a quantitative metric derived from DWI, which provides numerical information on microscopic environments, such as cytotoxic edema (8), tumor cellularity (9), and white matter (WM) integrity (10). Because different tissues respond differently to the strengths and directions of diffusion gradients, DWI and ADC together play important roles in diagnosing diseases affecting various tissue types and having varying pathological processes.
Single-shot echo-planar imaging (ss-EPI) has been the most widely used DWI sequence in clinical practice (11). However, the advent of read-out-segmented echo-planar imaging (rs-EPI), which splits κ-space acquisitions into segments by using multiple shots, has reduced geometric distortion by a factor proportional to the segment width and T2*-induced blurring by accelerating κ-space traversals along the phase-encoding direction (12). Moreover, possible motion artifacts that might occur between each segment-induced phase error could be corrected by using navigator echoes (12). This method also promises improved diagnostic performances in numerous diseases, such as malignant hepatic tumors (13), sinonasal lesions (14), breast cancer (15), and prostate cancer (16). Although rs-EPI requires a longer acquisition time, its superior overall image quality and diagnostic performance support its use over ss-EPI (13141516171819).
Nevertheless, the conventional ss-EPI sequence cannot be ignored because of its short scan time, especially in patients with acute stroke. The benefits of each sequence should thus be scrutinized and applied appropriately, depending on the targeted diseases. Although several studies have emphasized the superior performance of rs-EPI over ss-EPI, most of them focused on a single disease and performed qualitative evaluations. Therefore, the purpose of our study was to quantitatively evaluate ADCs of the whole brain by using ss-EPI and rs-EPI and to determine the correlation and agreement between them in healthy controls.
MATERIALS AND METHODS
Subjects
The Institutional Review Board approved this retrospective study and waived the need for written informed consent. Between September 2012 and October 2013, 30 consecutive healthy adults with no medical history of neurological diseases (mean age = 64.4 ± 14.2 years; 15 men and 15 women) were included after reviewing their magnetic resonance (MR) images on the picture archiving and communication system at our institution. One radiologist with 10 years of experience in neuroradiology reviewed all the images and electronic medical records of the included subjects. Among the subjects, the indications for brain MR imaging were dizziness (n = 15), headache (n = 10), and wanted (n = 5).
Image Acquisition
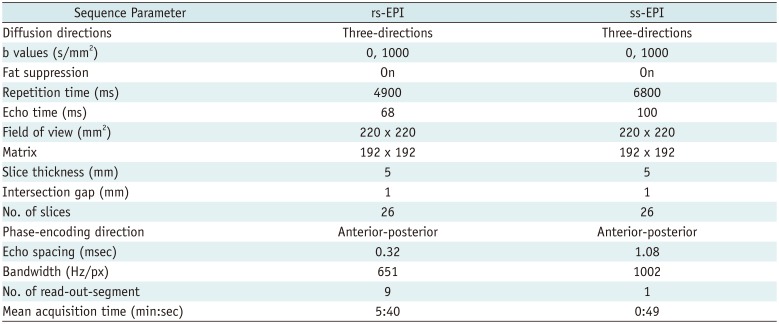
MR images were acquired using a 3T MR scanner equipped with a 12-channel head coil (MAGNETOM Verio, Siemens Healthineers, Erlangen, Germany). Both ss-EPI and rs-EPI sequences were performed to acquire normal and high-resolution axial diffusion-weighted images with gradient strength (b) values of 0 and 1000 s/mm2, respectively. The acquisition parameters for both sequences were as follows: ss-EPI DWI sequence—repetition time (TR)/echo time (TE) = 6800/100 ms, slice thickness = 5 mm, slices = 26, bandwidth = 1002 Hz/px, matrix = 192 × 192, field of view (FOV) = 220 × 220 mm2, b = 0 and 1000 s/mm2, diffusion directions = 3, read-out-segment = 1, and mean acquisition time = 0.82 min; rs-EPI DWI sequence—TR/TE = 4900/68 ms, slice thickness = 5 mm, slices = 26, bandwidth = 651 Hz/px, matrix = 192 × 192, FOV = 220 × 220 mm, b = 0 and 1000 s/mm2, diffusion directions = 3, read-out-segment = 9, and mean acquisition time = 5.67 min (Table 1). Finally, axial T2-weighted (T2W) images were acquired for image registration and segmentation with the following parameters: TR = 4900 ms, TE = 68 ms, FOV = 192 × 192 mm2, and slice thickness = 5 mm.
Image Processing and ADC Map Segmentation
All image processing and automatic segmentation were performed using Statistical Parametric Mapping, version 8 (SPM8; Wellcome Department of Imaging Neuroscience, University College London, London, UK). The T2W images were co-registered to the rs-EPI at b-0 s/mm2 to be used as a reference. The rs-EPI at b-1000 s/mm2 and ss-EPI at b-0 and b-1000 s/mm2 were additionally co-registered to the reference image. The co-registered T2W images were then segmented into the gray matter (GM), WM, and cerebrospinal fluid (CSF) to generate masking templates, such that each voxel of the segmented GM, WM, and CSF represented the proportion of the three segments. By using the masking templates, ADC maps from the rs-EPI and ss-EPI at b-0 and b-1000 s/mm2 were segmented into the GM, WM, and CSF, and into the combination of the GM and WM to represent the whole brain tissues.
Statistical Analysis
Student's t test was used to compare ADCs between ss-EPI and rs-EPI within the same subjects. Pearson's correlation coefficients were calculated to determine the correlation between ADCs of ss-EPI and rs-EPI. Agreement of ADCs was assessed using Bland-Altman plots. All statistical analyses were performed using MATLAB (MathWorks, Natick, MA, USA) and R version 3.2.2 (R Foundation, Vienna, Austria). The threshold for statistical significance was set at p < 0.05.
RESULTS
Image Processing and ADC Mapping by Using ss-EPI and rs-EPI at b-0 and b-1000 s/mm2
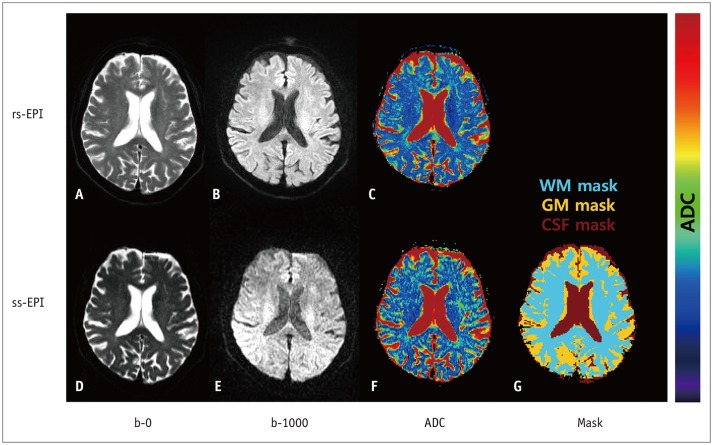
The overall image quality of the acquired images was visually acceptable. The representative slices of rs-EPI and ss-EPI at b-0 and b-1000 s/mm2, corresponding ADC maps, and masks of brain regions acquired using the two different sequences are shown in Figure 1. The color-coded ADC map of rs-EPI showed less noise than did that of ss-EPI at b-1000 s/mm2, containing relatively homogeneous cross-sectional ADC values (blue) (Fig. 1).
Comparison of ADCs between ss-EPI and rs-EPI according to Brain Segments
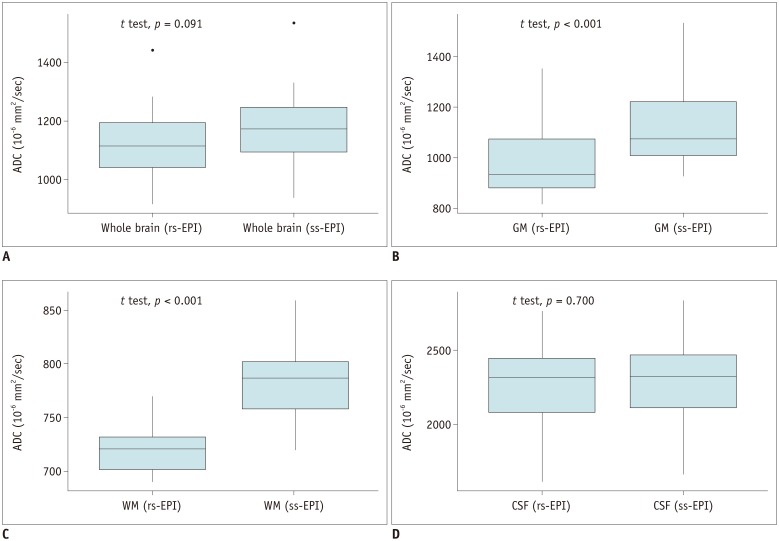
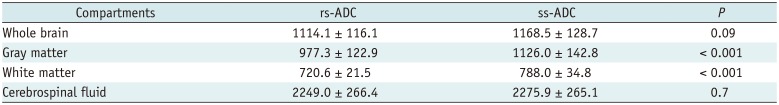
Significant differences were found between the two ADCs in the GM (p < 0.001) and WM (p < 0.001), while no significant differences were found in the whole brain (p = 0.091) and CSF (p = 0.700) (Table 2, Fig. 2). Furthermore, the difference between the two ADCs was greatest in the WM and smallest in the CSF (Fig. 2).
Pearson's Correlation and Bland-Altman Plots for Agreement Assessment between ss-EPI and rs-EPI
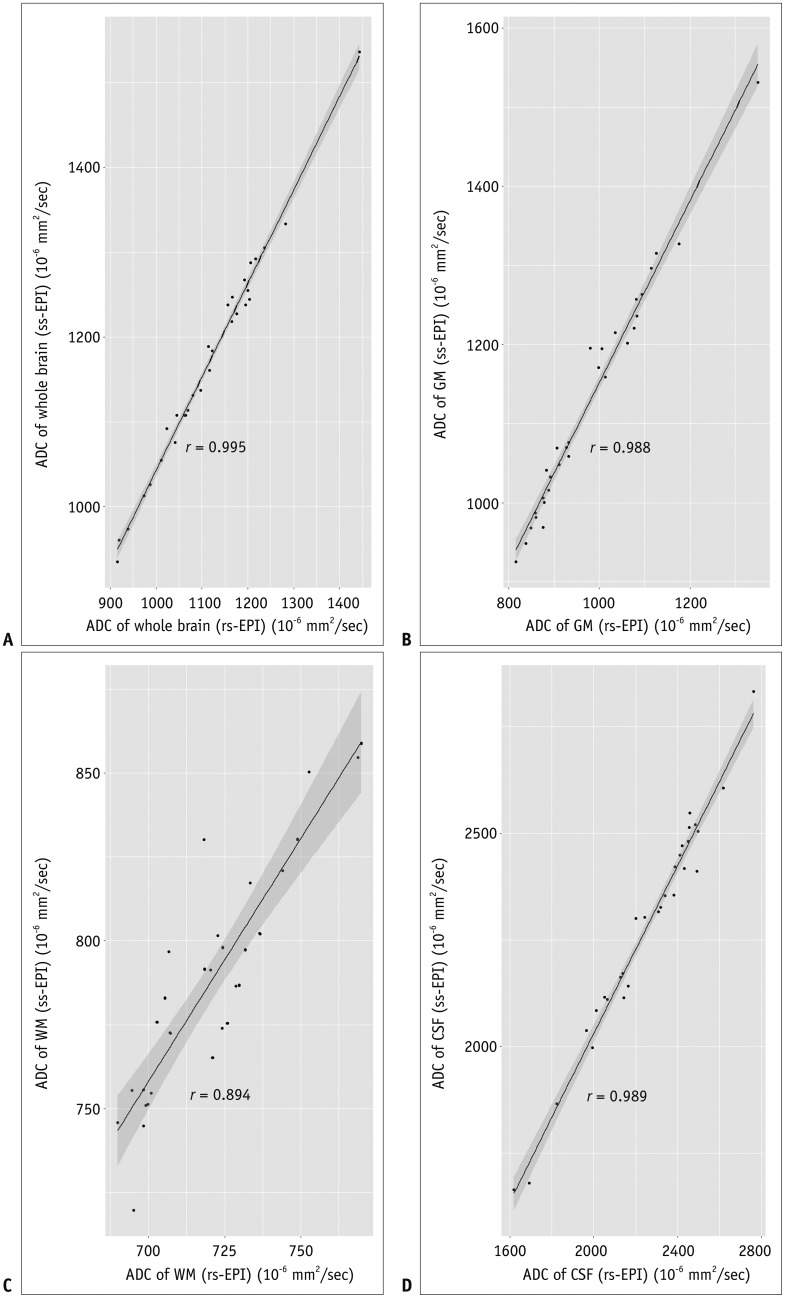
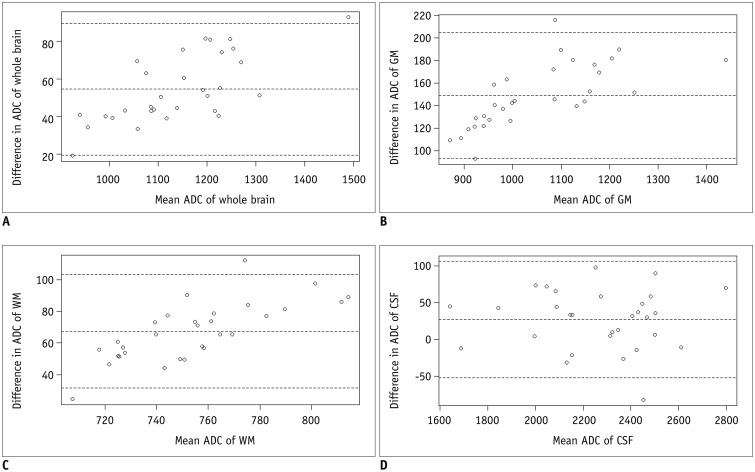
The correlation coefficients of ADCs of rs-EPI and ss-EPI were all over 0.988 for the whole brain, GM, and CSF. The least correlation coefficient was seen in the WM (r = 0.894) (Fig. 3). Pearson's correlation equations for each brain segment were y = 1.1x - 59.4 (GM), y = 1.45x - 255 (WM), and y = 0.98x - 63.5 (CSF), where x and y indicated ADCs of rs-EPI and ss-EPI, respectively. The slope and intercept of the WM showed the largest variation apart from direct proportion. The mean difference and limits of agreement between the two ADCs were 54.5 (19.4, 89.6) for the whole brain, 26.9 (−52.0, 105.9) for the CSF, 67.4 (31.5, 103.3) for the WM, and 148.7 (92.9, 204.5) for the GM (10−6 mm2/s), respectively (Fig. 4).
DISCUSSION
The advantages of rs-EPI are its improved spatial resolution and reduced susceptibility to artifacts, which compensate for the extended scan time. In this study, we quantitatively compared ADCs of rs-EPI and ss-EPI in the whole brain, GM, WM, and CSF of healthy controls to identify correlations and agreement between both sequences.
Overall, ADC values of ss-EPI were greater than those of rs-EPI throughout the brain segments, with significant differences in the GM (p < 0.001) and WM (p < 0.001). Despite the differences, the two ADCs showed strong linear correlations in the whole brain, GM, and CSF (r > 0.988), but relatively lower correlation in the WM (r = 0.894). Interestingly, ADCs of WM and GM showed variations—upward trends—between the two sequences on Bland-Altman plots. This finding may suggest that water diffusivity in the WM and GM was more influenced by the acquisition methods than was the diffusivity in the CSF, which essentially behaves like free water. One possible explanation is that water diffusion in biological tissues is non-Gaussian and distributes along the fine structures and geometric organization of neural tissues (20). More specifically, because the axon fibers in the brain parenchyma serve as barriers to translational motion (21), diffusion of water in neuronal tissues could be hindered by diffusion gradients, leading to a diffusion variation depending on the acquisition technique.
The microscopic heterogeneity of WM structures could also contribute to the largest ADC variations between the two sequences. The WM is composed of axon bundles surrounded by complex extra-axonal components, such as astrocytes, glia, and randomly orientated extracellular matrix molecules (22). This complexity adds difficulty in characterizing the diffusion properties of the WM.
The acquisition of high b-value DWI also revealed that the simple mono-exponential behavior of the diffusion signal is no longer applicable in the WM (23). Instead, the diffusivity in the WM should be divided into a “fast” component, which arises from the hindered diffusion of the extra-axonal space, and a “slow” component, which is associated with restricted diffusion of the intra-axonal space (24). This multi-compartmental characteristic of the brain WM could also increase the sensitivity of water diffusivity to variable acquisition methods, thus producing a large variation between the WM ADC values from the two acquisition modes.
Acknowledging the differences in ADCs between ss-EPI and rs-EPI can also be important in clinical practice. In a study by Purushotham et al. (1), delineation of the ischemic core on an ADC map was identified automatically with a threshold of ≤ 620 x 10−6 mm2/s, which yielded reasonable sensitivity and specificity. In this regard, overestimation or underestimation of infarct core lesions in patients with stroke because of the difference in ADC thresholds is possible; such inaccurate estimation may potentially affect therapeutic decisions. In oncologic treatment response evaluation, an increase in ADC is considered to reflect a good response (5). Although the results of our study did not show a wide range of ADC values since only healthy controls were included, the Bland-Altman plots of the GM and WM ADCs illustrated noticeable (more than 10%) intra-individual differences. For instance, 10% intra-individual differences of ADCs could hinder reliable estimation of infarct core sizes and evaluation of oncologic treatment responses. Hence, differences in ADCs between two different acquisition methods could pose difficulty in defining the absolute thresholds of ADCs in various diseases wherein the application of ADCs is most useful.
There are several limitations to this study. In addition to the inherent selection bias associated with a retrospective study design, only the quantitative relationship between the two ADCs from healthy subjects was evaluated. All images were acquired two dimensionally, and the generation of masks and segmentation of brain tissues could be imperfect. In addition, the examined images had a slice thickness of 5 mm, which could have lowered the segmentation qualities owing to partial volume artifacts. However, we assumed those limitations would have equal effects on ADCs of both ss-EPI and rs-EPI sequences. Furthermore, the difference in TR and TE between the two acquisition modes could bias the results. Finally, only healthy subjects were included in this study. Further studies enrolling patients with various diseases are strongly warranted to confirm the results of our study in pathologic conditions.
In conclusion, while ADCs of rs-EPI and ss-EPI showed high correlation and agreement in the whole brain and CSF, ADCs of the WM and GM showed significant differences and large variability, reflecting brain parenchymal inhomogeneity due to different regional microenvironments. ADCs of different acquisition methods need to be interpreted carefully, especially in intra-individual comparisons. Future studies should aim to elucidate such differences.
 XML Download