Abstract
Objective
To determine the feasibility of microvascular flow imaging (MVFI) in comparison with color/power Doppler imaging (CDI/PDI) for detection of intratumoral vascularity in suspected post-transarterial chemoembolization (TACE) residual or recurrent hepatocellular carcinomas (HCCs) by using contrast-enhanced ultrasonography (CEUS) or hepatic angiography (HA) findings as the reference standard.
Materials and Methods
One hundred HCCs (mean size, 2.2 cm) in 100 patients treated with TACE were included in this prospective study. CDI, PDI, and MVFI were performed in tandem for evaluating intratumoral vascularity of the lesions by using an RS85 ultrasound scanner (Samsung Medison Co., Ltd.). Intratumoral vascularity in each technique was assessed by two radiologists in consensus by using a 5-point scale. Then, one of the two radiologists and another radiologist performed additional image review in the reverse order (MVFI-PDI-CDI) for evaluation of intra- and interobserver agreements. Results were then compared with those of either HA or CEUS as the reference. The McNemar test, logistic regression analysis, and intraclass correlation coefficient (ICC) were used.
Results
CEUS or HA revealed intratumoral vascularity in 87% (87/100) of the tumors. Sensitivity (79.3%, 69/87) and accuracy (80.0%, 80/100) of MVFI were significantly higher than those of CDI (sensitivity, 27.6% [24/87]; accuracy, 37.0% [37/100]) or PDI (sensitivity, 36.8% [32/87]; accuracy, 44.0% [44/100]) (all p < 0.05). CDI, PDI, and MVFI presented excellent intraobserver (ICCs > 0.9) and good interobserver agreements (ICCs > 0.6).
Ultrasonography (US) has been utilized as the first-line imaging modality for surveillance of hepatocellular carcinoma (HCC) in patients with liver cirrhosis as well as for follow-up of liver lesions (12). However, characterization of focal liver lesions or detection of residual viable tumors after locoregional treatments on B-mode US often remains difficult (3456). In this regard, Doppler techniques such as color Doppler imaging (CDI) and power Doppler imaging (PDI), which can detect relatively fast intratumoral blood flows, have been used to differentiate hypervascular tumors in the liver (78) or to evaluate the post-treatment response of HCCs in a noninvasive manner (9). Unfortunately, however, CDI and PDI have been shown to be limited in detecting slow flows or the flow in small vessels as they adopt a wall filter to minimize clutter artifacts, leading to elimination of information regarding low Doppler frequency shifts (101112). Indeed, this limitation has been a major obstacle for the wider application of Doppler examinations in assessing hepatic tumor hemodynamics. Several studies have demonstrated the diagnostic value of contrast-enhanced ultrasonography (CEUS) in revealing the vascularity of residual tumors after transarterial chemoembolization (TACE) (13141516). However, CEUS requires intravenous cannulation, as well as additional nurses or ultrasound technicians and the additional expense for contrast agents. Therefore, there is an unmet clinical need to depict slow-flow vascular signals from small vessels in focal hepatic malignancies by using a noninvasive Doppler technique.
In order to improve the depiction of slow blood flow using the Doppler technique, several novel modified power Doppler-based techniques that operate at very low velocity scales using advanced clutter suppression have been developed, including superb microvascular imaging (SMI, Canon Medical Systems, Otawara, Japan), microflow imaging (MFI, Philips Healthcare, Best, The Netherlands), and microvascular flow imaging (MVFI) (MV-Flow™, Samsung Medison Co., Ltd., Seoul, Korea). These techniques can separate slow or small-vessel flow signals from clutter artifacts that arise from voluntary and involuntary motion by using a vendor-specific adaptive filter and can display flow information at a high spatial resolution and frame rate (17). Until now, several studies have demonstrated the diagnostic value of the SMI technique in characterizing focal lesions in the thyroid and breast by revealing low-velocity flow in small vessels within the tumor (181920). However, only a limited number of studies have explored these techniques to reveal tumor vessels in the liver, and these studies had limitations such as small patient numbers or the lack of data comparing the diagnostic performance with that of CDI or PDI (2122). Since residual HCCs after locoregional treatments would increase intratumoral vascularity, we hypothesized that MVFI could sensitively depict intratumoral vascularity in residual or recurrent HCCs after TACE. Therefore, the purpose of our study was to determine the feasibility of MVFI in comparison with CDI and PDI for the detection of intratumoral vascularity in suspected post-TACE residual or recurrent HCCs by using CEUS or hepatic angiography (HA) findings as the reference standard.
This prospective study was approved by the Institutional Review Board of our hospital, and all patients provided written informed consent for participation in this study. Financial support and the investigational US platform for this study were provided by Samsung Medison Co., Ltd. However, the authors maintained full control of the data at all times and the information submitted for publication, which remained unbiased by industry.
From January 2018 to May 2018, patients with suspicious post-TACE residual or recurrent HCCs on follow-up CT or MRI were prospectively screened for enrollment in this study. Inclusion criteria were as follows: 1) suspected residual or recurrent tumors in adult patients on follow-up CT/MRI after TACE according to the Liver Imaging Reporting And Data System (LI-RADS) v2017 treatment response algorithm (23); 2) diagnostic image quality on dynamic CT/MRI performed within 3 months of study enrollment; 3) absence of severe cardiovascular dysfunction; and 4) visible tumor(s) on either B-mode US or real-time multimodality-US fusion. Eight patients were excluded from the screening due to the following reasons: invisible lesions on B-mode US even after real-time imaging fusion with CT or MRI (n = 2), suboptimal image quality on CT/MRI (n = 2), impairment of the cardiopulmonary system (n = 1), and refusal to enroll in the study (n = 3) (Fig. 1). Finally, a total of 100 patients (77 men and 23 women; mean age, 64.9 years; age range, 36–73 years) with suspicious post-TACE residual or recurrent HCCs (locally recurred, n = 47; remotely recurred, n = 53) on follow-up CT/MRI were enrolled in this study.
All patients underwent subsequent CEUS (n = 68) or HA (n = 32) as the reference assessment for hypervascularity. When CT or MRI showed multiple tumors, one representative tumor per patient was analyzed. The representative tumor was selected on the basis of the following criteria: 1) better visibility on B-mode US, 2) closer from skin (tumor depth), 3) manageable tumor size (range, 2–5 cm). Mean tumor size was 2.8 cm (range, 0.8–8.1 cm), and the mean size of the viable portion was 2.2 cm (range, 0.8–7.8 cm). The HCCs were located in the left lateral (n = 19), left medial (n = 11), right anterior (n = 37), and the right posterior (n = 33) sections.
All US examinations were performed by one of the two board-certified abdominal radiologists (with 25 and 8 years' experience in abdominal US examinations, respectively) on an RS85 ultrasound scanner (Samsung Medison Co., Ltd.) using a CA1-7A (Samsung Medison Co., Ltd.) convex probe. First, after localizing the target tumor, CDI and PDI were performed using an appropriate field of view (FOV) with optimal parameters for evaluation of the target tumor. Second, a MVFI was obtained using the same FOV with and without blending of background tissue signals. All images were obtained perpendicular to the skin surface, which allowed the best visualization of the target tumor. All settings including gain, wall filter, and scale were optimized in each tumor to obtain the best image possible. Detailed parameters of each US technique are noted in Table 1.
Intratumoral vascular flow was assessed on CDI, PDI, and MVFI on a 5-point scale as shown in Table 2. A flow score of 3 or higher was assumed to be positive for the detection of intratumoral flow. The intratumoral vascular flow was determined by the consensus reading of the two operators using stored videos and images.
In addition, to evaluate the possible factors affecting intratumoral flow detection, skin-to-tumor depth, liver surface-to-tumor depth, and presence of motion artifacts (binary scale) were analyzed. Motion artifact was defined as all the artifacts degrading image quality by motion, such as clutter and blurring (2425). When the motion artifacts were regular and synchronized with cardiac pulsation, they were regarded as pulsating artifacts.
For interobserver agreement, another board-certified abdominal radiologist (with 6 years of experience in abdominal US examinations) reviewed intratumoral vascular flow by using saved images and videos. In addition, intraobserver agreements were assessed in the reverse order (MVFI-PDI-CDI) to that of the prospective acquisition of the three examinations by the two radiologists respectively, with a 1-month interval between the assessments so as to minimize recall bias.
Digital subtraction HA was performed using a 5-Fr catheter (RH catheter, Cook, Bloomington, IN, USA) placed at the common hepatic artery via the right femoral artery in 32 patients. Cone-beam CT HA was also performed in all of these 32 patients to identify hypervascular tumors and their feeding arteries (26) by using a uniplanar cone-beam CT scanner (Syngo DynaCT; Siemens Healthineers, Forchheim, Germany). Among these, 28 lesions (28/32, 87.5%) presented hypervascularity on digital subtraction or cone-beam CT HA.
CEUS was performed by using a contrast-specific US technique of the RS85 platform (Samsung Medison Co., Ltd.) and a CA1-7A convex probe under real-time multimodality-fusion guidance in 68 patients. The contrast media (SonoVue, Bracco, Milan, Italy) was prepared according to the manufacturer's recommendations. Next, 2.4 mL of the prepared contrast agent was injected manually followed by a saline flush of 10 mL via an antecubital venous line. Cine CEUS images of the target tumor were obtained for the first 60 seconds after contrast injection, followed by interval scans for 5 seconds at 30-second intervals over 5 minutes. Among the 68 lesions in 68 patients, 59 (86.8%) presented hypervascularity on the arterial phase (not rim enhancement on the arterial phase).
All values were expressed as mean ± standard deviation. Comparison of vascularity scores between US techniques was assessed using the paired t test. To compare the flow detection rate with respect to sensitivity, specificity, positive predictive values, negative predictive values, and accuracy between US techniques, the McNemar test was used. To assess the possible factors affecting intratumoral flow detection, skin-to-tumor depth, liver surface-to-tumor depth, tumor size, and patient age were analyzed using the independent t test. In addition, the presence of motion artifacts, recurrence patterns (local/remote), and sex were assessed using the chi-squared test. Parameters proven to be significant on univariate analysis with two-tailed p values of less than 0.10 were subsequently tested on multivariate analysis. For multivariate analysis, logistic regression was used to assess significant independent factors of intratumoral flow detection in each US technique. Intra- and interobserver agreements for the vascular flow score were assessed with intraclass correlation coefficients and those for diagnostic performance were assessed with κ-statistics. The strength of the agreement was evaluated as follows: 0.21–0.40, fair agreement; 0.41–0.60, moderate agreement; 0.61–0.80, good agreement; and 0.81–1.0, excellent agreement. All statistical analyses were performed using commercially available statistical software (MedCalc, ver. 16.4, MedCalc Software bvba, Mariakerke, Belgium; SPSS, ver. 23, IBM Corp., Armonk, NY, USA), and two-tailed p values less than 0.05 were considered to indicate a statistically significant difference.
The intratumoral flow score in MVFI was significantly higher than those in CDI and PDI (p < 0.001), while PDI presented a significantly higher score than did CDI (p = 0.002) (Fig. 2A). When reviewing the images and videos in reverse order, intratumoral flow score was still significantly higher in MVFI than in CDI and PDI (p < 0.001) (Fig. 2B). Representative examples are presented in Figure 3.
Thirteen (13%) tumors did not show hypervascularity on the reference images (HA, n = 4; CEUS, n = 9), and there were no significant differences between the reference images (p = 0.63). Sensitivity, specificity, positive predictive value, negative predictive value, and accuracy of each US technique are summarized in Table 3. MVFI showed 79.3% sensitivity and 80.0% accuracy for intratumoral flow detection, which was significantly higher than those of CDI and PDI (p < 0.001) (Fig. 4). Representative examples are presented in Figure 5. However, MVFI showed the lowest specificity (84.6%), even though there were no significant differences in specificity among the Doppler techniques (p > 0.05).
MVFI showed 79.7% sensitivity for intratumoral flow detection when using CEUS as the reference standard (n = 68), which was significantly higher than those of CDI (13.6%) and PDI (25.4%) (p < 0.001), without showing a reduction in specificity (all specificities = 100%). Likewise, MVFI showed 78.6% sensitivity when using HA as the reference standard (n = 32), while CDI and PDI showed 57.1% and 60.7% sensitivity (p < 0.001), respectively. In this comparison, MVFI showed lower specificity (50.0%) than did CDI (100%) or PDI (75.0%) without statistical significance (p = 0.15).
In the subgroup analysis by recurrence patterns, the sensitivities of MVFI were significantly higher than those of CDI and PDI. The specificity of MVFI was lower than that of CDI in both subgroups (p = 0.02 and 0.04, respectively) (Table 3).
Assessments of intratumoral vascularity with CDI, PDI, and MVFI showed good interobserver agreement. Moreover, CDI, PDI, and MVFI showed excellent intraobserver agreement for assessments of intratumoral vascularity (Table 4).
Univariate analysis of the possible factors affecting intratumoral flow detection using each US technique are summarized in Table 5. Note that the 78.6% (11/14) of the motion artifacts were pulsating artifacts. The frequency of pulsating artifacts increased as the distance to the diaphragm reduced (< 2 cm; p = 0.021). On multivariate analysis, the presence of motion artifacts (p = 0.015) and skin-to-tumor depth (p = 0.003) were the two significant factors affecting flow detection in MVFI (Table 6).
In our study, we demonstrated that MVFI was clinically feasible for detection of intratumoral blood flow in HCCs, and that it was significantly more sensitive than CDI or PDI in revealing intratumoral vascularity in recurrent or residual tumors in HCC patients treated with TACE. Specifically, the sensitivity and accuracy of flow detection for viable HCCs were 79.3% and 80.0% with MVFI in comparison to those with CDI (27.6% and 37.0%) and PDI (36.8% and 44.0%), with little loss in specificity. We can attribute this improvement in diagnostic performance to the selective signal detection of low-frequency shifts and the significantly superior vascularity visualization ability of MVFI in comparison with CDI or PDI. Indeed, the mean subjective vascularity score with MVFI was significantly higher than those with CDI or PDI. We believe that our study is noteworthy, because this is a unique study not only evaluating the feasibility of MV-Flow™, which is a newly developed MVFI technique using a vendor-specific advanced clutter filter, but also demonstrating the diagnostic performance of MVFI for assessing intratumoral vascularity after TACE.
Our study results were in good agreement with the results of a previous study using SMI for differentiating small HCCs from benign liver lesions by showing that more central and peripheral vessels were found around liver lesions on SMI than on CDI and PDI (21). Although CDI and PDI are widely used for vascular flow evaluation, they have several clear limitations, including aliasing effects and overwhelming of flow signals, which result in low sensitivity of flow in small or slow vessels (27). In contrast, MV-Flow™ or similar techniques maximize the sensitivity of flow detection by using selective suppression of flash artifact signals from the surrounding tissue, allowing the evaluation of small or slow-flow signals within the tumors (22). Moreover, in our study, the diagnostic performance of MVFI was superior to that of CDI and PDI in detecting vascular flow signals from the residual viable tumor.
We also found that although MVFI could detect the slow flow of small tumor vessels better than the other Doppler techniques, as its sensitivity for detection of viable HCCs was only 79.3%; thus, it may not replace CEUS completely. In addition, the depiction of tumor vascular signals on MVFI was shown to be related to the presence of motion artifacts and skin-to-tumor depth. Indeed, cardiac pulsation-related artifacts were a major limiting factor of MVFI, especially for tumors located in the hepatic dome portion or the upper portion of the left lobe. Therefore, further technical developments such as suppression of bulk tissue motion or artifact removal are warranted. As the depth of the tumor from the skin and cardiac pulsations are well-known disturbing factors in detecting flow signals in Doppler imaging (2728) and MVFI is a modified PDI technique, our study results were along expected lines. Since HCC usually arises in cirrhotic livers with higher ultrasound attenuation compared with normal liver parenchyma (29), it may be more difficult to detect intratumoral flow in tumors located in the deeper portions of the liver even with MVFI. Nevertheless, MVFI demonstrated 79.3% sensitivity and 80% accuracy in detecting the intratumoral flow of HCCs in our study.
In our study, the sensitivity of CDI and PDI were relatively higher in the HA group (57.1% and 60.7%, respectively) than in the CEUS group (13.6% and 25.4%, respectively). A reasonable explanation for this finding is that the tumors in the HA group (mean, 3.31 cm) were larger than those in the CEUS groups (mean, 1.66 cm) and prone to exhibit hypervascularity, since non-hypervascular tumors were pre-excluded during TACE feasibility screening.
CT and dynamic MRI are commonly used as the standard imaging techniques for evaluating the therapeutic response to TACE (23). However, beam-hardening artifacts from the dense iodized oil and arterial-portal shunts commonly seen in portions surrounding the treated nodule are a frequent cause of “pseudolesions” on CT, again limiting specificity (30). Although MRI is advantageous to assess questionable areas of enhancement on CT, perilesional enhancement on contrast-enhanced MRI, probably due to adjacent reactive granulation tissue or an arterioportal shunt, still makes it difficult to discriminate the viable tumor portion (31). Therefore, based on our study results, we cautiously suggest that MVFI may be utilized as an adjunctive diagnostic test for evaluation of treated lesions after TACE or locoregional treatments with equivocal findings on CT or MRI after locoregional treatment, especially when the tumors are located in an area of the liver with a good sonic window. In addition, the inherent sensitivity of MVFI to the vascular flow within the viable tumor after treatments is particularly advantageous in patients with chronic renal failure. Furthermore, its easy accessibility, non-invasiveness, and short acquisition time compared with CT or magnetic resonance could be other benefits.
There are several limitations in our study that should be acknowledged. First, as CDI, PDI, and MVFI examination were performed in a sequential manner in each patient, there could be a recall bias. Thus, to minimize recall bias, additional image reviews in the reverse order (MVFI-PDI-CDI) were performed retrospectively by two reviewers. Second, the reference standard was not consistent as either CEUS or HA was used in our study for tumor hypervascularity. Therefore, there must have been unavoidable bias. However, according to an additional subgroup analysis performed in the CEUS group and hepatic digital subtraction angiography group, no significant differences (p = 0.63) were shown in diagnostic performance. Third, CEUS or HA also had inherent limitations for presenting hypervascularity. For example, when the hypervascular tumor is supplied by extrahepatic flow, the tumor does not present hypervascularity on HA. In addition, CEUS is easily affected by tumor location such as a deep-seated lesion. However, TACE is generally performed instead of surgery in Barcelona Clinic Liver Cancer (BCLC) B stage patients. Thus, HA or CEUS would be the best alternatives for evaluating vascularity in recurrent or residual tumors after TACE. Fourth, we investigated only one microvascular imaging technique from a single vendor, which can be an obstacle to generalizing the feasibility of MVFI. However, as a relatively new technique, microvascular imaging techniques are not yet standardized between vendors. Comparisons of different microvascular imaging data from several vendors are warranted.
In conclusion, MVFI demonstrated significantly higher sensitivity and accuracy than did CDI and PDI for the detection of intratumoral vascularity in suspected post-TACE residual or recurrent HCCs. In addition, tumor depth from the skin and the presence of motion artifacts were significant factors of blood flow detection on MVFI.
References
1. Mittelstaedt CA. Ultrasound as a useful imaging modality for tumor detection and staging. Cancer Res. 1980; 40(8 Pt 2):3072–3078. PMID: 7397702.
2. Wernecke K, Vassallo P, Bick U, Diederich S, Peters PE. The distinction between benign and malignant liver tumors on sonography: value of a hypoechoic halo. AJR Am J Roentgenol. 1992; 159:1005–1009. PMID: 1329454.

3. Strobel D, Seitz K, Blank W, Schuler A, Dietrich C, von Herbay A, et al. Contrast-enhanced ultrasound for the characterization of focal liver lesions--diagnostic accuracy in clinical practice (DEGUM multicenter trial). Ultraschall Med. 2008; 29:499–505. PMID: 19241506.
4. D'Onofrio M, Crosara S, De Robertis R, Canestrini S, Mucelli RP. Contrast-enhanced ultrasound of focal liver lesions. AJR Am J Roentgenol. 2015; 205:W56–W66. PMID: 26102419.
5. Choi BI, Kim HC, Han JK, Park JH, Kim YI, Kim ST, et al. Therapeutic effect of transcatheter oily chemoembolization therapy for encapsulated nodular hepatocellular carcinoma: CT and pathologic findings. Radiology. 1992; 182:709–713. PMID: 1311116.

6. Cioni D, Lencioni R, Bartolozzi C. Therapeutic effect of transcatheter arterial chemoembolization on hepatocellular carcinoma: evaluation with contrast-enhanced harmonic power Doppler ultrasound. Eur Radiol. 2000; 10:1570–1575. PMID: 11044926.

7. Tanaka S, Kitamra T, Fujita M, Kasugai H, Inoue A, Ishiguro S. Small hepatocellular carcinoma: differentiation from adenomatous hyperplastic nodule with color Doppler flow imaging. Radiology. 1992; 182:161–165. PMID: 1309217.

8. Numata K, Tanaka K, Kiba T, Morimoto M, Arata S, Kondo M, et al. Use of hepatic tumor index on color Doppler sonography for differentiating large hepatic tumors. AJR Am J Roentgenol. 1997; 168:991–995. PMID: 9124156.

9. Tanaka K, Inoue S, Numata K, Takamura Y, Takebayashi S, Ohaki Y, et al. Color Doppler sonography of hepatocellular carcinoma before and after treatment by transcatheter arterial embolization. AJR Am J Roentgenol. 1992; 158:541–546. PMID: 1310826.

11. Yoo YM, Managuli R, Kim Y. Adaptive clutter filtering for ultrasound color flow imaging. Ultrasound Med Biol. 2003; 29:1311–1320. PMID: 14553809.

12. Yoo YM, Kim Y. New adaptive clutter rejection for ultrasound color Doppler imaging: in vivo study. Ultrasound Med Biol. 2010; 36:480–487. PMID: 20133045.

13. Moschouris H, Kalokairinou-Motogna M, Vrakas S, Papadatou A, Karagiannis E, Kiltenis M, et al. Imaging of intrahepatic progression of hepatocellular carcinoma post transarterial chemoembolization. A long-term, prospective evaluation of contrast-enhanced ultrasonography (CEUS). Med Ultrason. 2017; 19:134–142. PMID: 28440346.

14. Wobser H, Wiest R, Salzberger B, Wohlgemuth WA, Stroszczynski C, Jung EM. Evaluation of treatment response after chemoembolisation (TACE) in hepatocellular carcinoma using real time image fusion of contrast-enhanced ultrasound (CEUS) and computed tomography (CT)--preliminary results. Clin Hemorheol Microcirc. 2014; 57:191–201. PMID: 24577382.
15. Salvaggio G, Campisi A, Lo Greco V, Cannella I, Meloni MF, Caruso G. Evaluation of posttreatment response of hepatocellular carcinoma: comparison of ultrasonography with second-generation ultrasound contrast agent and multidetector CT. Abdom Imaging. 2010; 35:447–453. PMID: 19562414.

16. Kang HJ, Kim JH, Lee SM, Yang HK, Ahn SJ, Han JK. Additional value of contrast-enhanced ultrasonography for fusion-guided, percutaneous biopsies of focal liver lesions: prospective feasibility study. Abdom Radiol (NY). 2018; 43:3279–3287. PMID: 29671007.

17. Park AY, Seo BK. Up-to-date Doppler techniques for breast tumor vascularity: superb microvascular imaging and contrastenhanced ultrasound. Ultrasonography. 2018; 37:98–106. PMID: 29025210.

18. Ma Y, Li G, Li J, Ren WD. The diagnostic value of superb microvascular imaging (SMI) in detecting blood flow signals of breast lesions: a preliminary study comparing SMI to color Doppler flow imaging. Medicine (Baltimore). 2015; 94:e1502. PMID: 26356718.
19. Machado P, Segal S, Lyshchik A, Forsberg F. A novel microvascular flow technique: initial results in thyroids. Ultrasound Q. 2016; 32:67–74. PMID: 25900162.
20. Lee YS, Kim MJ, Han SW, Lee HS, Im YJ, Shin HJ, et al. Superb microvascular imaging for the detection of parenchymal perfusion in normal and undescended testes in young children. Eur J Radiol. 2016; 85:649–656. PMID: 26860680.

21. Dubinsky TJ, Revels J, Wang S, Toia G, Sonneborn R, Hippe DS, et al. Comparison of superb microvascular imaging with color flow and power Doppler imaging of small hepatocellular carcinomas. J Ultrasound Med. 2018; 37:2915–2924. PMID: 29683199.

22. He MN, Lv K, Jiang YX, Jiang TA. Application of superb microvascular imaging in focal liver lesions. World J Gastroenterol. 2017; 23:7765–7775. PMID: 29209117.

23. Elsayes KM, Hooker JC, Agrons MM, Kielar AZ, Tang A, Fowler KJ, et al. 2017 version of LI-RADS for CT and MR imaging: an update. Radiographics. 2017; 37:1994–2017. PMID: 29131761.

24. Kremkau FW, Taylor KJ. Artifacts in ultrasound imaging. J Ultrasound Med. 1986; 5:227–237. PMID: 3514956.

25. Lin DC, Nazarian LN, O'Kane PL, McShane JM, Parker L, Merritt CR. Advantages of real-time spatial compound sonography of the musculoskeletal system versus conventional sonography. AJR Am J Roentgenol. 2002; 179:1629–1631. PMID: 12438067.
26. Kang HJ, Kim YI, Kim HC, Jae HJ, Hur S, Chung JW. Does establishing a safety margin reduce local recurrence in subsegmental transarterial chemoembolization for small nodular hepatocellular carcinomas? Korean J Radiol. 2015; 16:1068–1078. PMID: 26357501.

27. Rubin JM, Bude RO, Carson PL, Bree RL, Adler RS. Power Doppler US: a potentially useful alternative to mean frequency-based color Doppler US. Radiology. 1994; 190:853–856. PMID: 8115639.

28. Kubota K, Hisa N, Fujiwara Y, Fukumoto M, Yoshida D, Yoshida S. Evaluation of the intratumoral vasculature of hepatocellular carcinoma by power Doppler sonography: advantages and disadvantages versus conventional color Doppler sonography. Abdom Imaging. 2000; 25:172–178. PMID: 10675460.

29. Oosterveld BJ, Thijssen JM, Hartman PC, Romijn RL, Rosenbusch GJ. Ultrasound attenuation and texture analysis of diffuse liver disease: methods and preliminary results. Phys Med Biol. 1991; 36:1039–1064. PMID: 1924541.

30. Minami Y, Kudo M. Imaging modalities for assessment of treatment response to nonsurgical hepatocellular carcinoma therapy: contrast-enhanced US, CT, and MRI. Liver Cancer. 2015; 4:106–114. PMID: 26697413.

31. Kim KW, Lee JM, Choi BI. Assessment of the treatment response of HCC. Abdom Imaging. 2011; 36:300–314. PMID: 21279353.

Fig. 1
Flow diagram of patient population.
CDI = color Doppler imaging, CEUS = contrast-enhanced ultrasonography, HCC = hepatocellular carcinoma, LI-RADS = Liver Imaging Reporting And Data System, MVFI = microvascular flow imaging, PDI = power Doppler imaging, TACE = transarterial chemoembolization, US = ultrasonography
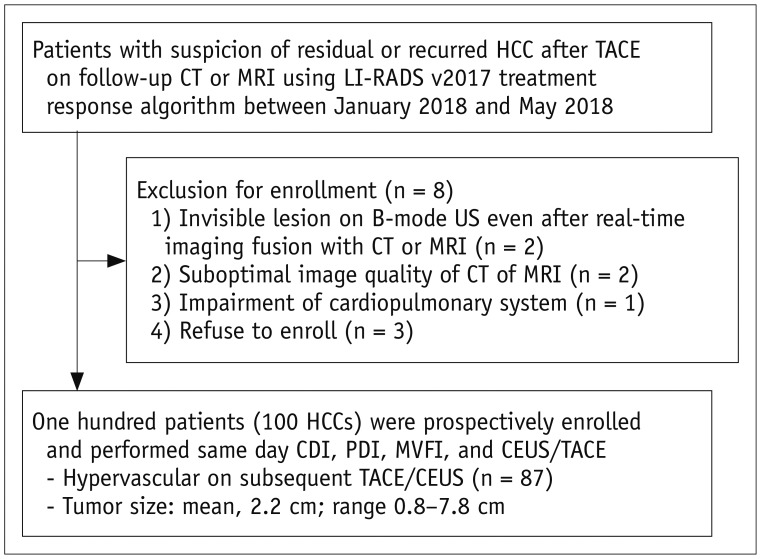
Fig. 2
Graphs showing subjective vascularity scores for intratumoral flow detection on CDI, PDI, and MVFI.
A. Intratumoral flow score in MVFI (3.59 ± 1.51) was shown to be significantly higher than that in CDI (1.76 ± 1.20, p < 0.001) and PDI (1.95 ± 1.26, p < 0.001). B. When reviewing images and videos in reverse order, intratumoral flow score was still significantly high in MVFI (3.05 ± 1.55) than in CDI (1.75 ± 1.20, p < 0.001) and PDI (2.07 ± 1.31, p < 0.001). *p < 0.05, **p < 0.001.
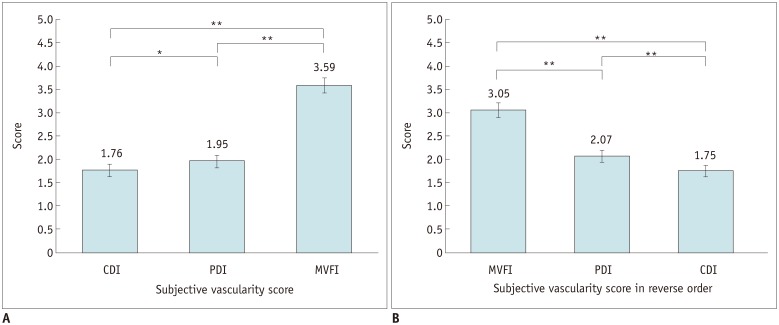
Fig. 3
73-year-old woman with 1.5-cm intrahepatic remote recurrent tumor in segment 6 who had previously been treated with TACE for HCC in another segment (not shown).
On CDI (A) and PDI (B), intratumoral flow was detected and was graded as score of 4. On MVFI (C, D), multiple intratumoral vessels were visualized and were graded as 5.
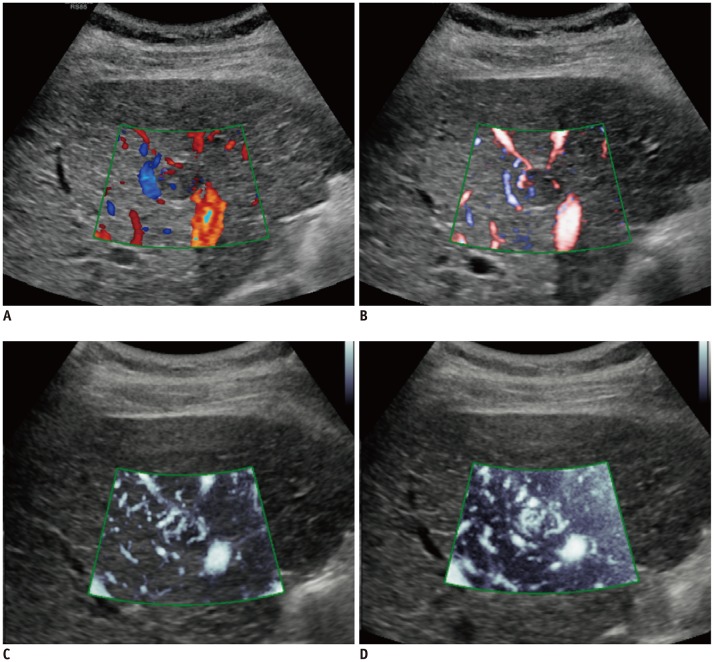
Fig. 4
Graphs showing sensitivity of intratumoral flow detection on CDI, PDI, and MVFI.
A. MVFI showed 79.3% sensitivity for intratumoral flow detection, which was significantly higher than that of CDI (27.6%, p < 0.001) or PDI (36.8%, p < 0.001). B. Likewise, when reviewing images and videos in reverse order, sensitivity of MVFI was 69.0%, which was significantly higher than that of CDI (30.0%, p < 0.001) or PDI (42.5%, p < 0.001). **p < 0.001.
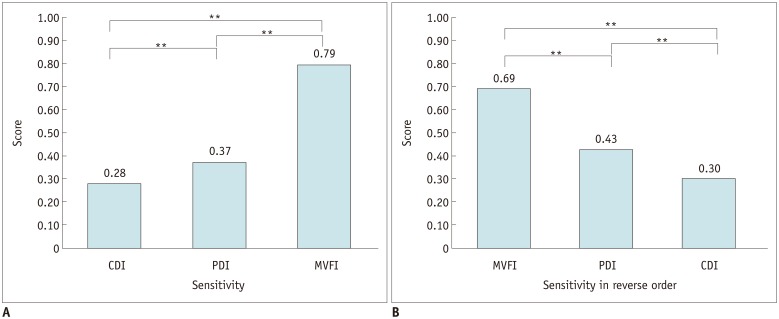
Fig. 5
72-year-old man with suspicious residual HCC in medial aspect of lipiodolized nodule.
On lipiodol CT (non-contrast CT after TACE) (A), defect in medial aspect of lipiodolized nodule (arrow) (A) was shown and that area presented arterial phase hyperenhancement on follow-up liver MRI (arrow) (B), suggestive of residual HCC after TACE. On CEUS (C), there was enhancing area in arterial phase (arrow); however, no intratumoral flow was detected on CDI (D) and PDI (E). On MVFI (F), multiple intratumoral vessels (arrows) were noted and were graded as 5.
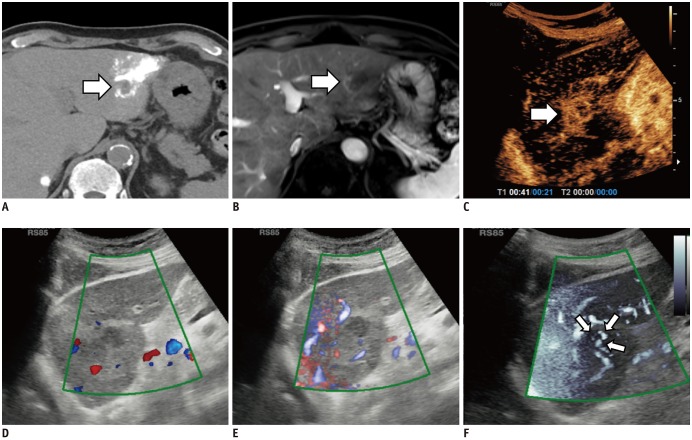
Table 1
Imaging Parameters of Each Doppler Technique and CEUS

| Technique | MI | Gain (%) | Sensitivity | Doppler Scale (kHz) |
|---|---|---|---|---|
| CDI | 1.3 | 50–70 | 8–12 | 0.8–2.3 |
| PDI | 1.3 | 50–70 | 8–12 | 0.8–2.3 |
| MVFI | 1.2 | 30–70 | 26–32 | 0.15 |
| CEUS | 0.08 | 50–70 | N/A | N/A |
Table 2
Scoring System for Intratumoral Vascularity Assessment
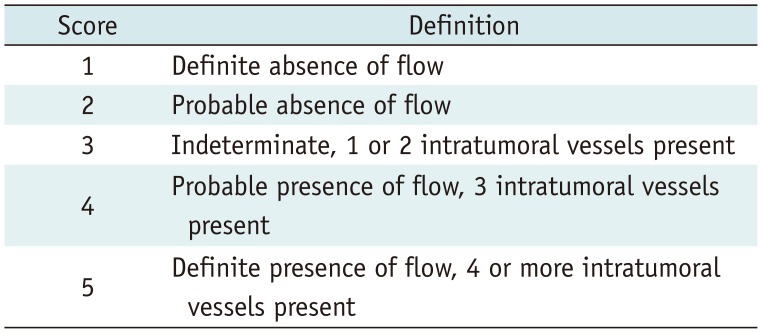
Table 3
Sensitivity, Specificity, PPV, NPV, and Accuracy of Each Doppler Technique in Depiction of Intratumoral Vascularity of Treated Tumors

Table 4
Intra- and Interobserver Agreements for Intratumoral Vascularity Score

Table 5
Univariate Analysis of Factors Affecting Intratumoral Flow Detection on CDI, PDI, and MVFI (n = 87)
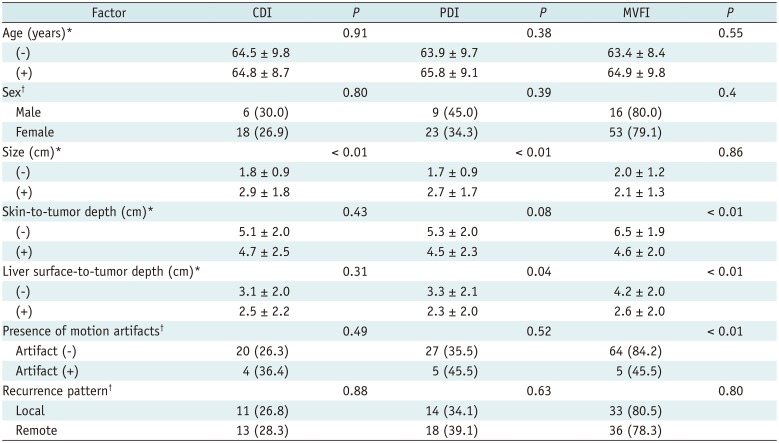
Table 6
Multivariate Analysis of Factors Affecting Intratumoral Flow Detection on CDI, PDI, and MVFI (n = 87)


 PDF
PDF ePub
ePub Citation
 Print
Print


 XML Download