

 PDF
PDF ePub
ePub Citation
 Print
Print


INTRODUCTION
Kidney transplantation is considered the best treatment option available for patients with end-stage renal disease. However, rejection and fibrosis are leading causes of allograft failure. Interstitial fibrosis and tubular atrophy (IFTA), previously known as chronic allograft nephropathy (CAN), is currently diagnosed by pathologic changes involving all parts of the renal parenchyma. It is critical to distinguish IFTA from acute rejection for optimal clinical decision-making following kidney transplantation [1].
Needle biopsy as an invasive procedure has become safer, and biopsy interpretation more standardized [2]; however, it is still associated with risk of postbiopsy bleeding which can lead to graft loss, and sampling errors, and interobserver variability in interpretation remains problematic [3]. Moreover, interchangeable histology classifications are becoming more difficult because of continuous revisions of the histological diagnostic criteria every 2 years [4]. Noninvasive biomarkers are necessary to monitor allograft status and to predict long-term outcomes. Several candidates have been suggested as useful biomarkers for acute rejection or fibrosis of kidney allografts [56].
Transglutaminase type 2 (TG2) is an extracellular matrix (ECM) crosslinking enzyme known to have a pivotal role in kidney fibrosis. The interaction of TG2 with heparin sulfate proteoglycan (HSPG) syndecan-4 (SDC4) regulates cell surface trafficking and localization [7]. Accumulation in the ECM is the histological hallmark of IFTA and is responsible for progressive tubulointerstitial fibrosis [8]. Here, we aim to investigate urinary TG2 as a noninvasive biomarker for prediction of fibrosis in kidney allografts following deceased donor kidney transplantation (DDKT).
METHODS
Subjects
From January 2015 to July 2016, patients aged 18 to 80 years old who received DDKT at our center were included in this study. Patients who needed multiorgan transplantation were excluded from this study. Patients requiring regular antiplatelet or anticoagulant treatments were also excluded. We prospectively collected urine specimens from 20 DDKT recipients at 1-day, 7-day, 1-month, 3-month, and 6-month posttransplant intervals. In addition, kidney allograft tissue specimens at 0-day and 6-month posttransplant were sampled to analyze the correlation of urinary TG2 and kidney allograft fibrosis. Of the 20 patients who were enrolled before transplantation, 18 recipients were included in the final analysis because urine samples of 2 patients were not available posttransplant. This study received approval from the Institutional Review Board (IRB) of Asan Medical Center (approval number: 2014-1214) and all patients provided written informed consent.
Endpoints
The objective of this study was to analyze the correlation between urinary TG2 and the progression of allograft fibrosis between 0-day and 6-month protocol biopsies. The severity of allograft fibrosis was estimated by summing Banff ct, ci, and cv scores [4] of each biopsy specimen. Participants were categorized into 2 groups based on the progression of allograft fibrosis. Recipients were categorized as the IFTA group if the sum of ct, ci, and cv scores on 8-month protocol biopsy increased by one or more compared with the sum of the scores on the 0-day biopsy.
Urine collection and tissue preparation
Samples were collected under human subject research protocols approved by the IRB of Asan Medical Center. A urine sample was collected on posttransplant day 1, 7 days, 1 month, 3 months, and 6 months. About 35- to 50-mL urine sample was collected from each patient. For each urine specimen, 0.5 mL of a protease inhibitor mixture (5 mM 4-(2-aminoethyl) benzensulfonyl fluoride hydrolchloride, 0.2 mM leupeptin-hemisulfate, and 333 mM sodium azide) was added. To remove urinary sediments including whole cells, large membrane particles, and other debris, urine specimens were centrifuged at 4,000 rpm for 15 minutes at 4℃. An aliquot of supernatant was stored at −80℃ until use.
Allograft protocol biopsies were obtained at implantation and by ultrasound-guided percutaneous puncture 6 months after transplantation. Histological diagnosis was performed based on tissue studies using light microscopy. All biopsy specimens were graded according to the Banff 2013 classification [4] by 2 renal pathologists.
Urine protein profiling for urinary markers
TG2 (Mybiosource, San Diego, CA, USA), SDC4 (R&D System, Minneapolis, MN, USA), and α-1 microglobulin (A1M) (Abcam, Cambridge, UK) levels were measured by an enzyme-linked immunosorbent assay (ELISA) kit according to the manufacturer's protocol. Briefly, 100 µL of 60-fold diluted urine sample and standards were added to the bottom of a micro-ELISA plate well before incubation for 90 minutes at 37℃. A biotinylated detection antibody was then added to each well and incubated for 1 hour at 37℃. The plate was washed 3 times with wash buffer. Horseradish peroxidase-conjugated working solution was then added to each well and was incubated for 30 minutes at 37℃. Absorbance of each well was detected on a microplate reader (Sunrise, Tecan, Switzerland) set to 450 nm. To detect A1M, 50 µL of 20,000-fold diluted urine sample and standards were added to the well and were incubated for 120 minutes at room temperature. To detect SDC4, 100 µL of nondiluted urine sample were added to the well and were incubated for 120 minutes at room temperature. Thereafter, procedures similar to TG2 ELISA indicated above were performed according to each kit's protocol.
The level of IL-6 was measured with a cytometric bead array (CBA) method using the CBA flexset kit (BD Life Sciences, San Jose, CA, USA), according to the manufacturer's protocol. Briefly, 50 µL of mixed capture beads were added to the same volume of urine or standards and incubated for 1 hour at room temperature in the dark with shaking to allow the cytokine to bind to the capture beads. PE detection reagent was then added to each tube and incubated for 2 hours at room temperature in the dark with shaking. We performed additional steps to enhance the signal, increasing enhancing reagent treatment by 1 hour. The fluorescence-labeled cytokine-specific beads were analyzed by flow cytometry and assessed using FLAP array software (BD Life Sciences).
Immunofluorescence and confocal microscopy
Kidney allograft biopsy tissue samples were cryosectioned, and immunolabeled following collection procedures. Samples were placed into cryomolds with optimal cutting temperature medium and frozen over liquid nitrogen. Thin sections (4- to 6-µm thickness) obtained via cryosectioning were labeled with antibodies against TG2, SDC4, HSPG (Abcam) and the nucleus was labeled with 4′,6-diamidino-2-phenylindole (DAPI; Sigma-Aldrich, St. Louis, MO, USA). Sections were incubated with primary antibodies for 16 hours at 4℃, and washed twice in phosphate buffered saline containing 0.5% bovine serum albumin. Next, fluorescence conjugated secondary antibodies (goat anti-rat or anti-rabbit IgG antibodies conjugated with AlexaFluor488 or AlexzFluor555, Life Technology, Carlsbad, CA, USA) were applied for staining and sections were incubated with DAPI for 5 minutes. Confocal imaging was performed using a laser scanning confocal microscope equipped with a hybrid detector (LSM710, Carl Zeiss. Germany).
Individual fluorophores were imaged sequentially with the excitation wavelength switching at the end of each frame. Images were analyzed using custom software written in ZEN (Zen 2 blue edition, Carl Zeiss Microscopy GmbH, Jena, Germany). Data are expressed as mean fluorescence intensities (MFI). Geometric properties for colocalization position and area were calculated as identified. For each TG2 and SDC4 cluster, a list of HSPG and nucleus clusters were compiled, which included directly overlapping clusters.
Statistical analysis
Differences among values were analyzed using the chi-square test, Fisher exact test, Mann-Whitney, t-tests or paired t-tests, as applicable.
All statistical analyses were performed using IBM SPSS Statistics ver. 20.0 (IBM Co., Armonk, NY, USA) and R ver. 3.1.2 (R Foundation for Statistical Computing, Vienna, Austria). A P-value of <0.05 was considered to be statistically significant.
RESULTS
Recipient and donor characteristics and transplantation
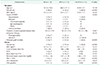
We prospectively collected urine samples and kidney biopsy specimens from 20 recipients that underwent DDKT at our center between January 2015 and July 2016. Two patients whose urine samples were not available were excluded; thus, 18 recipients were included in this study. Based on the progression of allograft fibrosis, participants were divided into 2 groups: the IFTA and no IFTA groups. Baseline characteristics of participants are shown in Table 1. Among the 18 patients, only 1 required retransplantation. Three patients received rabbit antithymocyte globulin (Thymoglobulin, Genzyme, Cambridge, MA, USA), whereas the others received anti-IL-2 receptor antibody (Basiliximab) as an induction regimen. All patients received triple therapy as maintenance immunosuppression at the time of discharge; a combination of a calcineurin inhibitors, a mycophenolic acid derivative, and steroids. The target trough level for tacrolimus was 5–8 ng/mL during the early postoperative period. One patient in no IFTA group with underlying diabetes was administered cyclosporin with the target trough level 100–150 µg/L during the early postoperative period. Three recipients experienced delayed graft function after DDKT and there was no significant difference between the 2 groups. Three donors were defined expanded criteria donors according to the criteria proposed by the United Network for Organ Sharing. There was no significant difference in baseline characteristics between the 2 groups.
Protocol biopsies of IFTA and no IFTA groups
All patients had protocol biopsy at the time of transplantation (zero day) and at 6-month posttransplantation (Table 2). All patients had normal range serum creatinine and no recipient required for-cause biopsy until protocol biopsy was taken 6-month posttransplant. There was no significant difference in serum creatinine (1.17 ± 0.18 in IFTA vs. 0.98 ± 0.23 in No IFTA, P = 0.173) and estimated glomerular filtration rate value (72.0 ± 9.1 in IFTA vs. 77.2 ± 19.5 in no IFTA, P = 1.0) using chronic kidney disease (CKD) epidemiology collaboration 2009 equation [9] at 6-month posttransplant between the 2 groups.
Comparison of urinary biomarkers in IFTA and no IFTA group
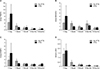
We compared the levels of urinary biomarkers between IFTA and no IFTA groups (Fig. 1). The level of urinary TG2 in the IFTA group was significantly increased compared with the no IFTA group at the 3- and 6-month posttransplant follow-up periods (Fig. 1A). There were no significant differences in the levels of urinary SDC4, A1M, and IL-6 between the 2 groups (Fig. 1B–D).
Comparison of immunofluorescence staining of protocol biopsy specimens between the IFTA and no IFTA groups
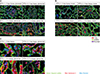
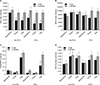
We performed double immunofluorescence staining in representative allograft biopsy specimens in the IFTA and no IFTA groups (Fig. 2). We also measured the intensity of TG2 and SDC4 in each individual specimen (Fig. 3). TG2 intensity was significantly upregulated at the 6-month posttransplantation biopsy compared to that of the 0-day posttransplantation. This was prominent especially in tubular structures. The TG2 MFI difference was more remarkable (P = 0.006) in the IFTA group with a total intensity measuring 5,173 ± 784 MFI at the 6-month biopsy compared to 2,035 ± 514 MFI at the 0-day (5,223 ± 602 vs. 2,929 ± 584 in 6 months no IFTA group biopsies, P = 0.01) (Fig. 3A).
While there was no change in SDC4 intensity between 0-day and 6-month biopsy samples in the no IFTA group, SDC4 was upregulated at 6 months compared to day 0 posttransplantation in the IFTA group and was prominent in tubular structures (10,175 ± 1,461 vs. 6,366 ± 711, respectively, P = 0.05) (Fig. 3B).
Colocalization of TG2 and HSPG was observed on confocal microscopy. No remarkable increase in colocalization of TG2 and HSPG was detected in the no IFTA group. TG2 and HSPG colocalization became prominent at the 6-month biopsy compared to the 0-day biopsy in the IFTA group allograft specimens (0.51 ± 0.07 vs. 0.23 ± 0.08 MFI, respectively, P = 0.009) and this tendency was observed both in the glomerulus and the tubular structures (Fig. 3C). Although colocalization of SDC4 and the nucleus was also observed in biopsy specimens, confocal microscopy intensity showed no significant difference between the 6-month and 0-day biopsies for all structures in both groups (Figs. 2C and 3D).
DISCUSSION
Currently, there is a growing body of literature demonstrating that kidney tubule health can be measured noninvasively to provide insight into kidney graft function and disease progression beyond that provided by glomerular status [10]. Clinical chemistry and biochemistry diagnostics in transplantation relies on a limited set of biomarkers and a single molecular marker will likely never be identified that captures the function of a transplant organ in all its complexity [5].
As for urinary protein biomarkers, several studies have demonstrated promising candidates for injury and fibrosis of kidney allograft and association with CKD progression. In a prior FAVORIT trial analysis, neutrophil gelatinase-associated lipocalin, kidney injury molecule 1, IL-18, and liver-type fatty acid binding protein have been proposed as urinary biomarkers of kidney tubule injury or fibrosis [11] and these biomarkers have been proposed to measure kidney fibrosis status in DDKT [12]. Previous studies with biomarkers such as A1M, monocyte chemoattractant protein-1 (MCP-1), and type III N-terminal amino peptide in kidney transplant recipients have found that higher urinary concentration of each biomarker has been associated with greater tubulointerstitial fibrosis on kidney biopsy [1314]. In other studies, metalloproteinases (MMPs) which are physiologic regulators of renal ECM degradation have been investigated, and changes in MMPs expression or activities such as MMP2, MMP9, MMP7 have been suggested as potential candidates for the detection of renal allograft injury and correlation with IFTA [15]. Urinary chemokines CXC chemokine ligand 9 and 10 have also been tested in urinary messenger RNA, microRNA and protein levels as noninvasive biomarkers of kidney allograft function [1516].
TG2 is a member of the transglutaminase enzyme family, involved in a plethora of biological functions such as angiogenesis [17], apoptosis, cell differentiation [18], and wound healing [19]. The role of TG2 has been shown to be crucial to both the ECM expansion [2021] and transforming growth factor beta (TGF-β)1 activation [2223] that underlies fibrotic remodeling. In fibrotic diseases such as renal, liver and pulmonary fibrosis, increased TG2 externalization and expression results in abundant crosslink formation, contributing to ECM accumulation [2122]. Our previous report revealed that TG2 has a potential effect in the stabilization of the ECM by interaction with fibronectin and TGF-β in human abdominal aortic aneurysm [24]. HSPG SDC4 is an important binding partner for extracellular TG2. Interaction of TG2 with the HSPG SDC4 regulates cell surface trafficking, localization, and activity of TG2 [25]. The high affinity interaction of extracellular TG2 with SDC4 is thought to maintain the activation of protein kinase Ca, and is important for controlling integrin levels and clustering throughout the cell surface [2526]. Scarpellini et al. [7] demonstrated that SDC4 is required for cell surface targeting of TG2 and the development of kidney fibrosis in CKD and progressive fibrosis is associated with increase in extracellular TG2 and TG activity in the tubulointerstitium. They also showed in a CKD mouse model that extracellular TG2 colocalized with SDC4 in the tubular interstitium and basement membrane, where TG2 also colocalized with heparan sulfate chains. Richardson et al. [27] analyzed HSPG localization in corneal fibroblasts and revealed that the nuclear localization of HSPG core proteins was greater in fibronectin cells and proposed that fibronectin-mediated nuclear localization of HSPG might play an important role in inducing biological responses and regulating nuclear function. We have previously reported composition of urinary TG2, SDC4, IP-10, and MCP-1 as potent biomarkers to distinguish IFTA from tubulointerstitial inflammation in kidney transplant recipients [28]. To our knowledge, this is the first study to verify the value of urinary TG2 as a biomarker for allograft fibrosis and IFTA in deceased donor kidney transplant patients.
In this study, we analyzed potential urinary biomarkers of 18 DDKT recipients and revealed that the urinary levels of TG2 tended to be higher and that of SDC4 tended to be lower when IFTA was aggravated at the 6-month allograft biopsy. Urine molecule concentration depends on several biological variables such as fluid intake, body composition, in addition to hepatic and renal functions [29]. Since urinary creatinine concentration serves as an indicator of urine dilution, we measured the level of urine creatinine and mathematically adjusted for creatinine normalization of TG2 and SDC4 by dividing each concentration by the urine creatinine level. Higher levels of TG2 in the IFTA group were more remarkable after 1-month posttransplant when TG2 was normalized by creatinine. It is known that TG2 is upregulated by lysed red blood cells [30]. During the first-month posttransplant period hematuria is common. It may interfere with urinary TG2 levels, and urinary TG2 may not accurately reflect potential fibrosis of the kidney allograft. SDC4 after creatinine normalization did not show a significant difference between IFTA and no IFTA groups at 1-month posttransplant. Notably, A1M, which has been identified as a potent urinary biomarker of kidney graft fibrosis and injury in other studies [1314], was not associated with tubulointerstitial fibrosis in our study.
We observed TG2 and SDC4 intensity upregulation on protocol biopsy 6-month posttransplant in the IFTA group. Both TG2 and SDC4 upregulation was remarkable especially in tubular structures. Colocalization of TG2 and HSPG was significant at the 6-month biopsy in the IFTA group. Localization of SDC4 within the nucleus was observed in a representative 6-month biopsy of the IFTA group, although confocal microscopy did not demonstrate a significant increase in MFI. Our results are consistent with previous in vitro and animal studies. We hypothesized that in patients with ongoing progression of tubulointerstitial fibrosis of the graft kidney during early posttransplantation period, TG2 expression would be upregulated and the extracellular TG2 level increases, hence, resulting in high levels of urinary TG2. Interaction between TG2 and SDC4 during development of allograft fibrosis leads to nuclear localization of HSPG and SDC4, where the role of HSPG in regulating nuclear function remains unclear. It is possible that the nuclear localization of SDC4 results in decreased extracellular SDC4 levels which are detected as reduced urinary SDC4 levels.
There are several limitations to this study. This is an observational study at a single institution evaluating a relatively small number of patients. Furthermore, a common challenge of protein analysis of spot urine samples collected involves differences in the abundance of each protein or metabolite in biological fluids and the concentration of biological fluids is affected by various factors and by the physiological status of the patients [29]. There are several cases with missing data of urinary biomarker levels which may have possibly influenced the small cohort sample present in our study. Repeated measurements in a larger patient population with a longer posttransplantation follow-up period may further support and strengthen our observations. However, we demonstrate for the first time in the DDKT population that kidney allograft fibrosis is associated with increased levels of urinary TG2 and, hence, we propose TG2 as a potential candidate as a promising urinary biomarker. Further studies are necessary to obtain causation confirmation and subsequent studies for multiple validation steps of performance evaluation and impact determination are required to appropriately develop TG2 as an efficient novel biomarker.
We suggest urinary TG2 as a potential biomarker to determine kidney graft fibrosis during the early postoperative period in DDKT recipients. Future studies to verify and confirm this relationship are necessary. Collecting urine for clinical measurements is less invasive than performing kidney biopsies and may facilitate repeating measurements in patients to determine risk and responses to treatment. Measurements of urinary TG2 may provide an opportunity to monitor kidney transplantation recipients serially and noninvasively and to identify those at higher risk of graft fibrosis, in whom closer surveillance and prevention treatments may be warranted.
 XML Download