

 PDF
PDF Citation
 Print
Print


INTRODUCTION
Over the past two decades, hospitalists have emerged as medical specialists, worldwide; and are rapidly expanding and creating a new area of “hospital medicine.”123 Through numerous studies, the benefits of hospitalists have been proven not only in patients in general medicine,45 but also in pediatrics,6 acute stroke,7 and surgical patients.8 The potential advantages of the hospitalist system include greater expertise in inpatient care and better availability of physicians during hospitalizations.9
In the United States, hospitalists have increased spontaneously in response to the need for medical efficiency and safety of inpatients, particularly for the elderly multi-morbid patients who have increased.10 Currently, more than 50,000 physicians (5% of all doctors) work as hospitalists.1 In Korea, the need for inpatient care has led to the increased number of hospitalists due to the lack of medical personnel in tertiary hospitals.11 Therefore, the hospitalist system, introduced institutionally in 2016, is supported by national reimbursement financial sources. Thus far, the training hospitals have recruited about 100 hospitalists nationwide. However, stability, identity, and rewards for hospitalists are not well-established. Hence, there are not enough hospitalists to spread to a lot of hospitals.1213
The acute medical care unit was first introduced in Korea. It involves the provision of short-term care to patients who present at the emergency departments (ED).14 The integrated medical model is a recently emerging model, which involves the collaboration of different subspecialists or hospitalists in order to provide quality care to patients in an independent department.13 A similar model with an integrated medical model has been used in foreign countries.15
Despite the high expectations of improvement in patients' outcomes, the effect of the hospitalist system remains unproven. Our institute has operated a hospitalist-centered system involving internal and surgical hospitalists, critical care team, and rapid response team since March 2017. This study therefore aimed to compare the outcome (including length of hospital stay [LOS], in-hospital mortality [IHM], and readmission rate) in patients with pneumonia or urinary tract infection (UTI) in the general wards admitted via the ED between hospitalists and non-hospitalists.
METHODS
Setting of the hospitalist system
The Department of Hospital Medicine at our institute consists of the internal medicine team (one gastroenterologist and one general internist), surgical team (three general surgeons and one obstetrician), and critical care team (one pulmonologist, one cardiologist, and one emergency medicine doctor). Two attending physicians from the internal medicine team independently cared for and discharged patients without serving as specialists. One of them had been serving as a physician for 17 years and had worked at a private local clinic and in a general hospital. The other doctor underwent 2-year fellowship training and 3 years of military service after obtaining the physician certificate. Both of them were the first to start as hospitalists. Most of the patients cared for by the hospitalists were admitted via the ED. Some patients were referred from the intensive care unit (ICU), while the others were from the outpatient clinics. Patients who were initially admitted in the ED were allocated mainly to the hospitalists, and those who had been followed up by subspecialists were allocated to the non-hospitalists. Hospitalist care was performed during the daytime 6 days a week. Patients assigned to hospitalists were admitted through the ward where the hospitalists worked. However, this ward was shared with other medical patients cared for by non-hospitalists. Non-hospitalists inpatient care was done by subspecialists and residents. Pneumonia or UTI were mainly cared for in the pulmonology, infectious disease, nephrology, or urology units. However, the other divisions of internal medicine, neurology, rehabilitation medicine, or surgical department have also had to treat the disease. The median career period of non-hospitalists was 19 years (interquartile range [IQR] 7–24 years), since their specialty certification.
Patients
In total, 1,501 patients with pneumonia or UTI were admitted from March 2017 to July 2018 in our institute. We excluded 486 patients admitted from outpatient clinics. Moreover, 300 patients were excluded as they were admitted directly in the ICU from ED. Of the remaining patients, six who remained undischarged until the study cut-off date were also excluded. Finally, 709 patients admitted in the general ward during the study period were enrolled and dichotomized into two groups: 169 cared for by hospitalists and 540 cared for by non-hospitalists (Fig. 1). The hospitalists group (HG) was defined as inpatients that were under the care of attending physicians from the internal medicine team, while the non-hospitalists group (NHG) was defined as inpatients cared for by attending physicians from other medical departments.
Calculation of comorbidity and disease severity
Comorbidity and disease severity were considered because these can affect LOS, IHM, and readmission rate.16171819 Chronic comorbid conditions were identified through chart review and were then reported using the Charlson comorbidity index (CCI).202122 The CCI score was then classified into three previously defined grades: 0–2 points (low), 3–4 points (moderate), and ≥ 5 points (high).23 Disease severity was measured by Mortality in Emergency Department Sepsis (MEDS) score, which is a superior predictive model used in validating a number of severe illnesses.242526 The MEDS score was calculated as follows: terminal illness with possible death within 1 month (6 points), hypoxia or tachypnea (3 points), septic shock (3 points), platelet count < 150,000 cells/mm3 (3 points), band neutrophils > 5% of leukocyte (3 points), age > 65 years (3 points), lower respiratory tract infection (2 points), nursing home resident (2 points), and altered mental status (2 points). In the current study, the variable “terminal illness” was defined as metastatic cancer or disease conditions with at least 50% chance of mortality within 30 days of admission, including cases with “do not resuscitate” orders or those with orders for withdrawal of life-sustaining treatments.2526 “Septic shock” was defined as persisting hypotension requiring vasopressors to maintain a mean arterial pressure of 65 mmHg or higher or having lactate levels of > 4 mmol/L.2627 “Nursing home resident” were regarded as patients who were referred from long-term care hospitals. CURB-65 score, also used to consider the severity of pneumonia, was divided into 3 groups as follows: 0–1 points (low), 2 points (intermediate), and ≥ 3 points (high).28
The LOS was defined as the duration of a single episode of hospitalization and was calculated by subtracting the day of admission from the day of discharge.14 IHM was defined as the ratio of inpatient deaths to the total number of inpatients.29 Readmissions were identified as unscheduled admission via ED due to any cause within 14 or 30 days after discharge.
Statistical analysis
Baseline characteristics of the HG and NHG groups were described. Continuous variables were summarized as medians and IQR or means and standard deviations, and analyzed using Mann-Whitney U test. For categorical variables, frequencies and percentages were determined, and differences in distribution were estimated using Pearson's χ2 test. We performed subgroup analyses according to disease category, comorbidity (based on CCI), and severity (based on MEDS score). When the response variable was treated as a binary variable, logistic regression was used to predict whether the LOS exceeded nine days. Multiple linear regression was also used to determine whether CCI, MEDS score, gender, and hospitalist care were associated with LOS. The distribution of LOS was positively skewed, and the logarithm function was used to transform the variables into linear data.30 P values < 0.05 were considered significant. We used the Bonferroni adjustment for multiple comparisons in the subgroup analyses. All statistical analyses were performed using SPSS 19.0 software (SPSS, Chicago, IL, USA).
RESULTS
Baseline characteristics
Table 1 presents the baseline characteristics of the HG and NHG groups. The percentage of women in the HG group was significantly higher than that in the NHG group (63.9% vs. 48.1%, respectively; P < 0.001). Compared to the HG group, the NHG group had higher proportion of patients with pneumonia (58.6% vs. 71.7%, respectively; P = 0.001). Among patients with comorbidities, those in the NHG group had higher proportions of patients with diabetes, chronic kidney disease, and chronic obstructive pulmonary disease than those in the HG group (P = 0.030, 0.030, and 0.010, respectively). However, there was no significant difference in CCI, which was used to summarize the comorbidities, between the two groups (P = 0.650). Disease severity in both groups was compared according to the MEDS score and its components. Compared to the HG group, the NHG group had higher proportions of patients with tachypnea or hypoxemia (26.6% vs. 38.9%, respectively; P = 0.004). Based on the MEDS score, the proportions of patients with very low, low, or very severe MEDS score were higher in the HG group, while the proportions of moderately severe or severe MEDS score were higher in the NHG group. Compared with those in the NHG group, patients in the HG group had shorter LOS (2 days) in the hospital (median [IQR], 8 [5–12] vs. 10 [7–15] days, respectively; P < 0.001). The HG group showed lower IHM than the NHG group, but the difference was not significant (2.4% vs. 4.8%, respectively; P = 0.170).
Table 1
Baseline characteristics of patients cared for by hospitalists group and non-hospitalists group
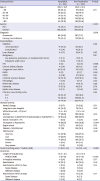
Data are presented as mean ± standard deviation or number (%).
HIV = human immunodeficiency virus, PAOD = peripheral arterial occlusive disease, COPD = chronic obstructive pulmonary disease, MEDS = Mortality in Emergency Department Sepsis score, IQR = interquartile range.
aMEDS score: very low (0–4), low (5–7), moderate (8–12), severe (13–15), and very severe (> 15); bNurses' working years in the wards where hospitalists worked were compared with that the wards where non-hospitalists worked, including respiratory ward, emergency ward, and infectious disease ward.
![]()
Patients cared for by the non-hospitalists were mainly admitted in the respiratory ward (32.4%), emergency ward (15.0%), and infectious disease ward (11.5%). Nurses' working years was not significantly different between HG and NHG groups (median [IQR], 1.5 [0.8-4.5] vs. 1.5 [0.6-4.4], respectively; P = 0.620).
Subgroup analysis according to diseases (pneumonia or UTI), comorbidity, and disease severity
Of the 169 patients cared for by hospitalists, 70 (41.4%) were diagnosed with UTI, and 99 (58.7%) were admitted due to pneumonia (Table 2). A subgroup analysis stratified by disease (pneumonia or UTI), LOS, IHM, comorbidity (based on CCI), and disease severity (based on MEDS score) were compared between the NHG and HG groups. In the pneumonia group, HG showed shorter median LOS than the NHG group (difference of 2 days between groups). However, the 14-day readmission rate for the HG group was 4.0%, and was significantly higher than that in the NHG group (0.5%, P = 0.020). Other variables did not show any significant difference.
Table 2
Subgroup analysis according to diseases (pneumonia or UTI) between hospitalist group and non-hospitalist group
Data are presented as mean ± standard deviation or number (%).
UTI = urinary tract infection, HG = hospitalist group, NHG = non-hospitalist group, LOS = length of hospital stay, IQR = interquartile range, IHM = in-hospital mortality, CURB-65 = a system using Confusion, Urea, Respiratory rate, Blood pressure plus age ≥ 65 years for community-acquired pneumonia management, MEDS = Mortality in Emergency Department Sepsis score.
aP value using Bonferroni adjustment for subgroup analysis; bMEDS score: very low (0–4), low (5–7), moderate (8–12), severe (13–15), and very severe (> 15).
![]()
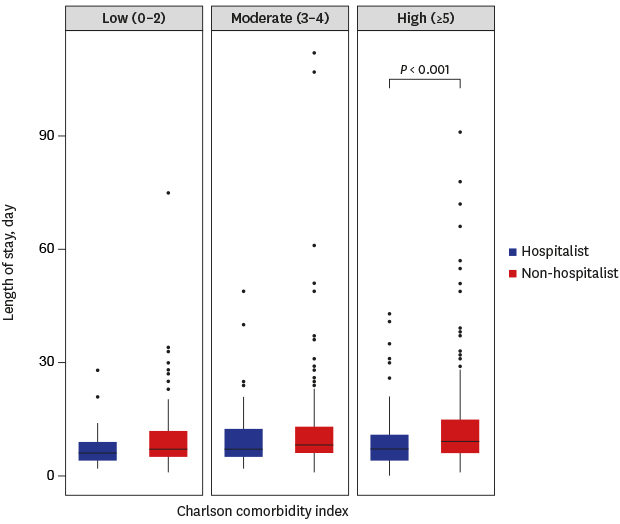
Subgroup analysis stratified by CCI and MEDS score was performed to determine the difference between the two groups (Tables 3 and 4). In all CCI groups, the HG LOS was shorter than that for the NHG group. In the high CCI group with ≥ 5 points, HG LOS was significantly shorter than that of NHG group (median [IQR], 8 [5–12] vs. 10 [7–16] day; P < 0.001). IHMs of all CCI groups were not significantly different between the two groups. Patients in the HG group with moderate CCI (3–4) had higher readmission rates than those in the NHG group (14 and 30 days; P = 0.020 and P = 0.006, respectively).
Table 3
Subgroup analysis according to comorbidity between hospitalist group and non-hospitalist group

Data are presented as mean ± standard deviation or number (%).
CCI = Charlson comorbidity index, HG = hospitalist group, NHG = non-hospitalist group, LOS = length of hospital stay, IQR = interquartile range, IHM = in-hospital mortality.
aP value using Bonferroni adjustment for subgroup analysis.
![]()
Table 4
Subgroup analysis according to diseases severity between hospitalist group and non-hospitalist group

Data are presented as mean ± standard deviation or number (%).
MEDS = Mortality in Emergency Department Sepsis score, HG = hospitalist group, NHG = non-hospitalist group, LOS = length of hospital stay, IQR = interquartile range, IHM = in-hospital mortality.
![]()
As the MEDS score increased, the LOS in both groups increased (Table 4), although not statistically significant. All HG subgroups had lower LOS except the severe MEDS score group. The 14-day readmission rate for the HG group with moderate MEDS score was significantly higher than that for the NHG group (7.3% vs. 0.5%; P = 0.004).
Multiple regression analysis of factors associated with LOS
We determined the risk factors associated with LOS longer than 9 days using logistic regression analysis (data not shown). In univariable analysis, age over 65 years, men, cerebrovascular disease, dementia, altered mental status, lower respiratory tract infection, referred from long-term care hospital, tachypnea or hypoxemia, septic shock, band neutrophils over 5% of leukocyte, and hospitalist care were significantly associated with LOS (P < 0.001, P = 0.003, P = 0.008, P = 0.03, P < 0.001, P = 0.001, P < 0.001, P = 0.03, P = 0.004, P = 0.014, and P < 0.001, respectively). However, multiple logistic regression analysis revealed significant factors, including age over 65 years (odd ratio [OR], 1.68; 95% confidence interval [CI], 1.16–2.39; P = 0.005), lower respiratory tract infection (OR, 1.48; 95% CI, 1.01–2.16; P = 0.046), long-term care hospital (OR, 2.32; 95% CI, 1.43–3.74; P = 0.001), and hospitalist care (OR, 0.59; 95% CI, 0.40–0.87; P = 0.008).
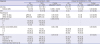
Multiple linear regression was conducted to evaluate the association between CCI, MEDS score, gender, and hospitalist care and LOS (Table 5). CCI and MEDS score were positively associated with LOS (P = 0.008 and P = 0.041, respectively), while hospitalist care was negatively associated with LOS (P = 0.003). Hospitalist care was found to be associated with a 16.2% decrease in LOS. Considering these factors, it can be described using the following model:
LOS = exp(2.021 + 0.039 × CCI + 0.017 × MEDS − 0.177 × hospitalist) = 7.7 × (1.04)CCI × (1.017)MEDS × (0.838)hospitalist
Table 5
Multiple linear regression analysis of factors associated with the length of hospital stay (log-transformed)

| Variables | Coefficients | Standard error | P value |
|---|---|---|---|
| CCI | 0.039 | 0.015 | 0.008 |
| MEDS | 0.017 | 0.008 | 0.041 |
| Gender (Men = 1, women = 0) | 0.060 | 0.052 | 0.245 |
| Hospitalist (Yes = 1, no = 0) | −0.177 | 0.060 | 0.003 |
CCI = Charlson comorbidity index, MEDS = Mortality in Emergency Department Sepsis score, IHM = in-hospital mortality.
Adjusted multiple R2 = 5.2%.
![]()
DISCUSSION
This is the first study to report the outcomes of a Korean independent hospitalist model responsible for the care of patients from admission to discharge. This study showed shorter LOS with hospitalist care than for the non-hospitalist care, and that the care of patients by hospitalists was associated with reduced overall LOS. The same trend was observed in the subgroup and multiple regression analyses. In particular, patients in the HG group with comorbidity had shorter LOS with CCI of ≥ 5. HG group LOS was shown to be shorter than the national average LOS in patients with pneumonia or UTI with complications or comorbidities, (pneumonia, 8.27–17.27 days; UTI, 8.83–16.67 days), based on the health insurance review and assessment (HIRA) service data in 2017 and 2018.31 However, the readmission rates of patients in the HG group with moderate CCI and MEDS score were significantly increased. Despite the small sample size and lack of significant difference, the overall IHM in the HG group remained low compared to that of the NHG group, and the same trend was reported after the subgroup analysis.
Previous studies investigating the impact of hospitalists reported a reduction in LOS with hospitalist care.571432333435 Similarly, hospitalist care had the strongest association with LOS in patients with pneumonia, UTI, or sepsis.34 The reductions in LOS associated with hospitalist care was more prominent in older patients and those who developed complications.93234 The implementation of hospitalist-operated system, like that utilized in our institute, was effective in patients visiting the ED.141536 Unlike with pneumonia, no statistical difference in LOS was found with UTI between HG and NHG in the current study. This finding suggests that the HG group with UTI had higher proportions of patients referred from long-term care and that these patients could have had antibiotic-resistant strains that should have been treated with intravenous antibiotics for a prolonged period. In addition, the effect of individual diseases on LOS seems to be minimal as shown in the multiple logistic regression. This is because change in MEDS score and CCI was associated with LOS in multiple linear regression, ultimately it was thought that the patients' overall condition influenced the LOS.
Patients cared for by hospitalists could have had a shorter LOS due to several reasons. Because the hospitalists are better trained medical personnel than residents, it is possible that they are able to address the disease management from various perspectives and may be more likely to solve the patients problems.37 Hospitalists also manage patients with similar diseases repeatedly; thus, they are more efficient due to their length of experience. Disease-specific physicians and hospitalists who are more experienced are effective in improving patient outcomes.438 To solve various patients’ problems, from time to time, hospitalists communicated with the members of our department or with specialists. In our hospitalist system, emergency medical issues are monitored by the rapid response team, this is immediately addressed by our critical care team if the patient require intensive care treatment.
Although results were conflicting, higher readmission rates associated with hospitalist care were reported in previous studies.739 One possible explanation for the higher readmission rates reported here could be the disruption in the inpatient to outpatient continuity of care.71240414243 In the current study, 3 of 4 patients who were re-admitted to the hospital within 14 days did not visit the outpatient clinic after discharge. In one of the patients that were readmitted within 30 days, the changes applied during the hospital stay were not properly communicated to the outpatient clinic specialist. The other reason was the post-discharge management of multi-comorbid and elderly patients; in the analysis of patients who were readmitted within 30 days, 7 (77.8%) were patients with pneumonia, while 2 (22.2%) had UTI. Most patients that were readmitted with pneumonia were of old age and had neurological problems such as dementia, Parkinson’s disease, or sequelae of cerebrovascular disease. Four of the patients were re-admitted with repeated aspiration.44 To prevent this problem, short-term outpatient follow-up and careful management of discharged patients are needed.45 Hospitalists should communicate adequately with specialists about referred patients and educate the patients regarding the importance of follow-up care.4243 Hospitalists who provide post-discharge care may help patients in preventing re-hospitalization.464748
Recently, the allocation of hospitalists to acute medical units in Korean tertiary hospitals resulted in a reduction in the LOS and ED waiting time.14 This study did not include other quality indicators, such as the morbidity, mortality, and readmission rate due to the short-term transit care. In our study, IHM, readmission rate, and LOS were obtained, and subgroup analysis using CCI and MEDS score was performed to determine the confounding factors that may affect LOS. We also analyzed the causes of readmissions. However, our study had some limitations. It was a retrospective study, used a relatively small sample size, and had a short-term study period. Secondly, patients who had been previously diagnosed with disease were included in the NHG group; therefore, a selection bias might have occurred during the assignment of patients in the ED, which may have affected the LOS. For adjustment of this bias, stratification analysis was performed in consideration of comorbidity and disease severity, and no statistical differences in leukocyte counts and previous long-term care hospitalization were found between HG and NHG groups. Thirdly, other quality indicators, such as discharge destination, and patient or staff satisfaction, were not evaluated in the present study. Finally, only two hospitalists worked during the day in our institute. Hence, further study is needed to evaluate the results of several hospitalists working full-time including those working for 24 hours a day, 7 days a week.
In conclusion, hospitalist care included in the integrated medical model can help reduce the LOS, especially in patients with multiple comorbidities. The interventions should be developed to prevent the readmission of patients having moderate comorbidity or severe disease. Further studies on various hospitalist-operated models and patients hospitalized with other diseases are warranted to evaluate the impact of hospitalist care in Korea.
 XML Download