

 PDF
PDF Citation
 Print
Print


INTRODUCTION
Raised blood pressure (BP) is the leading global risk factor for many non-communicable diseases.1 In international surveys, the estimated disease burden and deaths associated with high BP increased substantially between 1990 and 2015.2 Recent longitudinal studies have tracked BP and found a correlation between BP in infancy to that in adolescence and adulthood.345 Chen and Wang's6 recent systematic review and meta-regression analysis showed that all of the least squares means of tracking correlation coefficients, at several intervals were positively correlated with systolic blood pressure (SBP) and diastolic blood pressure (DBP). This suggests that a high BP in childhood can lead to hypertension in adulthood. Therefore, it is very important to maintain an adequate BP in early life.
The prevalence of pediatric hypertension is increasing.78 Hypertension in children under 10 years of age is mostly secondary hypertension9 and is the major cause of renal dysfunction, accounting for more than 90% of cases.10 One of the causes of renal dysfunction in early childhood is intrauterine growth restriction (IUGR) during nephrogenesis in the prenatal period, leading to a reduced number of nephrons; this could influence the risk of hypertension in later life.11 Brenner proposed the “nephron number hypothesis”, in which nephrogenesis is altered by prenatal manifestations that lead to a congenital nephron deficit, and where the remaining glomeruli are hypertrophied and subject to hyperfiltration to maintain renal function, resulting in glomerular injury and an elevated BP.1213
A recent meta-analysis reported that low birth weight (LBW) is associated with a higher risk of kidney disease in middle-aged adults and the elderly.14 However, few studies have examined the effects of prenatal growth status on renal function in childhood. Therefore, we hypothesized that the effects of prenatal growth status on renal function are related to high BP in childhood.
METHODS
Study subjects
This study was conducted as part of the ongoing Ewha Birth and Growth Cohort study, a prospective cohort based on a single hospital established in 2001–2006.151617 In this study, we included subjects who underwent regular check-up survey from April to July 2014. A total of 313 children participated in the check-ups in 2014. Ultimately, 304 children aged 7–12 years were included in the analysis, after excluding nine children who met the exclusion criteria (number of subjects: no blood collected, 5 children; no BP data, 1 child; no anthropometric data, 1 child; missing birth data, 2 children).
Those who participated in the check-ups underwent anthropometric measurements, completed questionnaires, and provided blood and urine samples. All anthropometric and BP measurements were obtained by trained researchers when the subjects visited the hospital. After an 8-hour overnight fast, blood samples (3 mL ethylenediaminetetraacetic acid–blood and 5 mL serum) were obtained from the subjects by venipuncture.
Birth outcome data collection
We obtained the subjects birth data, including sex, gestational age, and birth weights at delivery, from medical records. Gestational age was estimated based on a maternal report of her last menstrual period and on ultrasound measurements made by obstetricians. Preterm birth was defined as birth earlier than the 37th gestational week. The gestation weeks were subdivided into groups (very preterm, less than 32 weeks; moderate to late preterm, 32 to 37 weeks; normal delivery, more than 37 weeks). LBW was defined as a birth weight less than 2,500 g. We further classified birth weight into three groups (very low birth weight [VLBW], less than 1,500g; LBW, 1,500 to 2,499 g; normal birth weight [NBW], more than 2,500 g). Small for gestational age (SGA) is defined as weight less than the 10th percentile at a given fetal gestational age.
Anthropometric and BP measurements
Heights and weights without shoes and with light clothing were measured to the nearest 0.1 cm using a stadiometer and to the nearest 0.1 kg using a calibrated weighing scale, respectively (DS-102; Dong Sahn Jenix, Seoul, Korea). Body mass index (BMI; kg/m2) was calculated as weight divided by height squared.
After the subjects had been seated comfortably for 5 minutes, BP was measured twice using an automatic BP monitor (Dinamap ProCare 200; GE Healthcare, Milwaukee, WI, USA) with a cuff size appropriate for the circumference of the upper left arm. The average of two measurements was used for the statistical analysis.
Assessment of renal functions
Serum uric acid concentrations were measured using an enzymatic colorimetric test. Cystatin C and blood urea nitrogen (BUN) levels were analyzed with a turbidimetric immunoassay and kinetic test using the urease and glutamate dehydrogenase methods, respectively. Creatinine was measured using a kinetic colorimetric assay based on Jaffé's method. The serum uric acid, BUN, and creatinine concentrations were determined with a COBAS 8000 C702 (Roche, Mannheim, Germany) and the cystatin C levels were measured using a Hitachi Auto-analyzer 7600 (Hitachi, Fukuoka, Japan). The estimated glomerular filtration rate (eGFR) was calculated using Schwartz's equation, which is derived from body length (L, in cm), serum creatinine (SCr; in mg/dL), and the constant K (where K = 0.55). All analyses used serum samples and were performed in the Clinical Biochemistry Department of the Seegene Medical Foundation, Seoul, Korea. Urine dipstick tests were performed to assess proteinuria and hematuria.
Statistical analysis
The data were analyzed using SAS software (ver. 9.4; SAS Institutes, Cary, NC, USA). A descriptive analysis was used to summarize the general characteristics of the participants. Student's t-tests were used to compare the characteristics of the subjects. We calculated the partial correlation coefficient between renal function indicators in children, while adjusting for covariates. We performed χ2 analysis to compare the prenatal birth outcomes and childhood hypertension status.
To assess the effect of prenatal growth status on serum renal function indicators, we used a general linear model after adjusting for sex, age, current BMI, and monthly income. We also analyzed the effects of serum renal function indicators on SBP and DBP. The results are expressed as the adjusted means and 95% confidence intervals (CIs).
Ethics statement
Written informed consent for participation in the study was obtained from all parents or guardians and participating children when the subjects visited the hospital for check-up survey. The study protocol was approved by the Institutional Review Board on Human Subjects at Ewha Womans University Hospital (approval No. EUMC 2018–02-019). All processes were performed in accordance with relevant guidelines and regulations.
RESULTS
Table 1 shows the characteristics of the subjects according to sex. The proportions of males and females were similar, with 150 males (49.3%) and 154 females (50.7%). The mean age of the subjects was 9.4 ± 1.6 years. The mean BMI was 17.9 ± 3.2 kg/m2 for males and 17.5 ± 2.8 kg/m2 for females. Examining the clinical renal variables, the eGFR, serum BUN, and creatinine levels differed significantly by sex. The eGFR was significantly higher in females than in males, while the serum BUN and creatinine concentrations were significantly higher in males. Of the 304 subjects, four were weakly positive for protein in the urine, while only one subject was weakly positive in the urine glucose and blood tests; most children had normal results. The mean SBP and DBP were 108.3 ± 12.2 and 67.2 ± 8.9 mmHg, respectively. While SBP tended to be higher in males, DBP was similar between the sexes. The mean gestational age of the subjects was 38.6 ± 2.1 weeks and the mean birth weight was 3,101 ± 603 g.
Table 1
Characteristics of the study participants
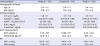
Values are the means ± standard deviation or median (interquartile range).
BMI = body mass index, eGFR = estimated glomerular filtration rate, BUN = blood urea nitrogen, BP = blood pressure, SBP = systolic blood pressure, DBP = diastolic blood pressure.
aSchwartz's eGFR = height (cm)/serum creatinine × K (K = 0.55); bP < 0.05.
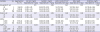
Table 2 shows the correlations among the serum renal function indicators. The serum uric acid level was not significantly correlated with other indicators in the partial correlation analysis. However, an increased serum cystatin C was significantly positively correlated with BUN and creatinine levels after adjusting for sex, age, and current BMI, whereas eGFR had negative correlations with serum cystatin C (partial r = −0.671; P < 0.001). There was a significant positive correlation (partial r = 0.309; P < 0.001) between the serum BUN and creatinine levels.
Table 2
Correlations between serum markers of renal function (n = 304)

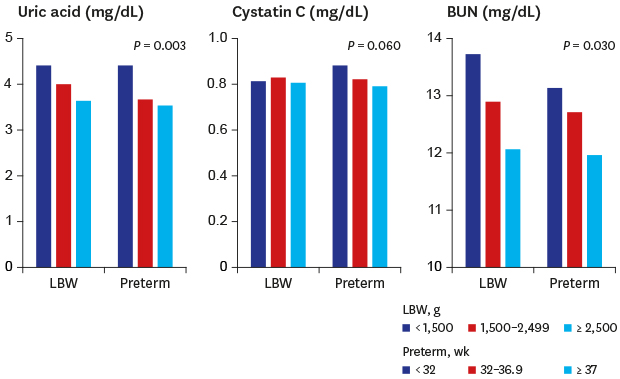
Table 3 lists the effects of prenatal growth on the serum markers of renal function in children. The serum uric acid level was significantly higher in LBW children (< 2,500 g) compared with their non- LBW counterparts (≥ 2,500 g). Interestingly, when the LBW was subdivided into three groups (Table 3), the group with the lowest birth weight (VLBW) had significantly higher uric acid levels after adjusting for sex, age, current BMI, and monthly income. This trend was also found in the prematurity analyses, but the result was not significant (P for trend = 0.11) due to the limited number of subjects. The difference in the uric acid level between the two extremes in the very preterm group (< 32 vs. ≥ 37 weeks) was 0.8 mg/dL. The mean serum BUN was significantly higher in the LBW children compared with those with NBW (13.0 mg/dL [95% CI, 12.2–13.7] vs. 12.1 mg/dL [95% CI, 11.7–12.4]). In the trend analysis, decreased birth weight was significantly associated with an increased serum BUN level in childhood. A similar trend was observed in the analysis of the association between BUN and prematurity (P = 0.09). The serum cystatin C levels were higher in children who were preterm than in those who were not; this difference was borderline significant. In the analysis comparing the cystatin C concentration among the three subgroups according to the order of gestational age, the cystatin C level increased as the gestation age decreased (P for trend = 0.06). BP was classified as normal or hypertension according to sex, age, and height percentile based on the Korea Centers for Disease Control and Prevention Guidelines.18 Hypertension was identified in 115 children (37.8%), who had a BP above the 95th percentile for their sex, age, and height. There was no significant difference between LBW or preterm birth and childhood hypertension status. We have not found a significant relationship between hypertension status and serum markers of renal indicators (data not shown).
Table 3
The effects of prenatal growth on serum markers of renal function in children
Adjusted for sex, age, current body mass index, and monthly income.
eGFR = estimated glomerular filtration rate, BUN = blood urea nitrogen, CI = confidence interval, LBW = low birth weight, VLBW = very low birth weight.
aSystolic blood pressure and/or diastolic blood pressure ≥ 95th percentile for sex, age, and the height percentile; bP for trend.
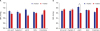
Fig. 1 shows the relationships between the serum renal indicators and mean SBP and DBP. The subjects were subdivided into those above and below the median serum renal indicator levels in childhood. In the adjusted model, the group with an eGFR level lower than the median value had a significantly higher DBP in childhood. The mean difference in DBP between the two groups was highest in the eGFR analysis when compared with the other serum renal indicators. The absolute mean DBP was also highest in the group with a low eGFR among the 10 plots. SBP showed a similar trend. There was no statistical significance for any other indicator, although children with SCr levels higher than the median tended to have a higher SBP and DBP than those in the group with lower creatinine levels with borderline significance in DBP.
Fig. 1
The relations between the serum markers of renal function and BP in children. (A) Adjusted mean SBP of children by serum renal function levels. (B) Adjusted mean DBP of children by serum renal function levels. Adjusted for sex, age, current body mass index, and monthly income.
BP = blood pressure, SBP = systolic blood pressure, DBP = diastolic blood pressure, eGFR = estimated glomerular filtration rate, BUN = blood urea nitrogen.
aP = 0.03.
DISCUSSION
This study investigated the effects of prenatal growth status on the serum levels of renal function indicators related to high BP in early life. We found that LBW was significantly associated with increased serum uric acid and BUN levels in childhood. The serum uric acid and BUN levels were highest in the VLBW group (< 1,500 g). The serum cystatin C levels were highest in the children born at less than 32 weeks' gestation (P for trend = 0.06). In the analysis of the effects of renal function on BP, subjects with a low eGFR had a significantly higher DBP when split by the group median.
The prenatal period is the initial growth environment in an individual's life and this critical period has a great impact on future life. There is a convincing association between fetal and childhood development and an increased risk of adult disease.1920 One of the mechanisms of adulthood hypertension, embryonic kidney dysfunction due to reduced nephron number (programmed in the intrauterine period), might contribute to the development of hypertension.2122
In general, LBW and prematurity are used as clinically robust surrogates for low nephron numbers.1123 In humans, the “nephron endowment” is determined at around 36 weeks of gestation, and no new nephrons are formed thereafter.2425 Hughson et al.26 investigated the relationship between the total number of glomeruli and birth weight in kidneys obtained at autopsy from 56 adults. They observed a direct linear relationship between nephron number and birth weight (r = 0.423; P = 0.001). A cohort study reported a strong correlation between glomerular number (direct) and size (inverse) with LBW.27 Prematurity was also shown to be a risk factor for reduced nephron numbers. In a study of extremely preterm infants, nephron number correlated with gestational age (r = 0.87; P < 0.001).28 These findings provide evidence that LBW and prematurity can affect human kidney development and the subsequent health of adults. Therefore, we considered LBW and preterm birth to be surrogates of congenital renal insufficiency and found associations with several commonly used markers of renal function in childhood. We further assessed the association between SGA and renal function in all children, including those born with normal gestational age.
Uric acid plays a key causal role in the pathogenesis of hypertension in relation to birth weight.2930 Children with a low number of nephrons may develop hyperuricemia in childhood on exposure to certain genetic or environmental factors.29 Persistently high uric acids can contribute to subsequent BP elevation by stimulating the renin–angiotensin system and inhibiting the release of endothelial nitric oxide.29 Recent epidemiological studies have reported increased uric acid levels in children born with IUGR and subsequent high BP.3132 In this study, we found that the serum uric acid levels increased significantly with decreased birth weight. We also noted a similar trend with preterm birth, suggesting that children with lower birth weight or gestational age are vulnerable to childhood renal dysfunction, even within LBW or preterm birth groups.
Recent studies indicate that the cystatin C concentration is the best indicator of early renal insufficiency in children because of its high sensitivity. In a cross-sectional survey of 116 subjects aged 6–7 years in Poland, the serum cystatin C level was significantly lower in extremely low birth weight (ELBW) children compared with a control group.33 Several cohort studies assessing cystatin C levels in LBW children reported negative associations,3334 while studies of preterm children are rare. In this study, we found that the mean serum cystatin C was marginally significantly higher in preterm children than in the full-term group. There was also a trend toward an increase in cystatin C levels as gestational age decreased, although this was not significant (possibly due to the small sample size). This suggests that children born very preterm have the highest concentrations of cystatin C, which is an index of the glomerular filtration rate (GFR) in later childhood, so vulnerable groups require appropriate monitoring.
The BUN concentration reflects the amount of urea in the blood, is an indicator of the GFR. We found that the serum BUN was significantly higher in LBW versus non-LBW children (13.0 vs. 12.1 mg/dL). In the analysis of the association with preterm birth, the BUN difference was borderline significant in the same direction. Although the biological mechanism underlying the effects of intrauterine growth retardation on subsequent BUN elevation remains unclear, several studies have reported associations between preterm or LBW children and BUN concentration in later life.3536 A recent cross-sectional study revealed significantly higher BUN levels in ELBW children at the age of 11 years compared with term controls (4.49 vs. 4.15 mmol/L).35 In a cohort study of 92 preterm children, Roggero et al.36 reported that gestational age showed a significant negative correlation with the BUN concentration. These results are consistent with our observations and further studies are needed to explain the effects of fetal growth restriction on later BUN levels.
We found that the eGFR level was not significantly associated with LBW or preterm birth. However, an analysis of the relationship between the eGFR level and BP in childhood showed that children with an eGFR lower than the median value had a significantly higher DBP than those in the group with a higher eGFR. In a study of 483 nondiabetic adults with stage 3 chronic kidney disease (CKD), Bloomfield et al.37 found a significant association between BP and a declining eGFR. In a prospective cross-sectional study of 62 children with stable type 1 diabetes mellitus, Rohani et al.38 reported that the eGFR was lower in children in hypertension and prehypertension groups compared with a normal group (88.7 vs. 92.6 vs. 97.7 mL/min/1.73 m2, respectively; P = 0.006). Until now, however, most research has examined CKD or diabetic patients, and few studies have examined children. In this study, we observed a significant association between a reduced eGFR and an increased BP (adjusted for gestational age or birth weight) in the general pediatric population (data not shown). This suggests that it is very important to adequately manage the various risk factors that may affect the eGFR levels of children and adolescents as well as the risk of renal dysfunction due to intrauterine growth retardation.
As the study subjects were too young to observe elevated BP, we found no evidence of significant associations between the levels of renal function markers and high BP according to developmental programmed renal insufficiency during childhood. However, the increased serum renal indicator in children due to IUGR could be a risk factor for high BP in later life. Therefore, our study should be considered meaningful because we found significant associations between LBW and prematurity, which are clinically robust surrogates for low nephron numbers and renal function markers in childhood. We thus identified a high-risk group that is potentially vulnerable and needs to be managed more carefully to ensure their future health.
In our previous study, we reported the serum uric acid levels fluctuate with time, thereby affecting subsequent BP15; this suggests that exposure levels can change over time. Because disease development is ultimately triggered by environmental factors, appropriate environmental interventions may have a positive influence on the complex mechanisms underlying disease development in high-risk groups, along with public health approaches that reduce LBW and premature birth. An experimental study conducted in 2007–2008 reported that prenatally induced nephron deficits can be restored by optimizing postnatal nutrition, preventing the development of subsequent hypertension.3940 Therefore, adequate nutrition in the first year after birth of premature infants born before nephron endowment will be very important for preventing subsequent hypertension. Furthermore, an eGFR within the low-normal range was significantly associated with an elevated DBP, suggesting that appropriate interventions are needed for a variety of exposure factors that cause renal dysfunction in childhood (when it is still possible to correct health risks). This study had some limitations. The relatively small sample might limit the statistical power. The subjects were also all born in a single university hospital, where there are many LBW and preterm births. The BP of the study subjects was slightly higher when compared with the same age group in the 2014 Korea National Health and Nutrition Examination Survey for children. Further studies should validate our findings in larger populations. This study also had several strengths. First, we studied the effects of prenatal growth restriction on serum renal functions markers related to BP in the general pediatric population. Furthermore, our prospective cohort design could help to explain the causal relationship between the effects of prenatal growth retardation and renal function in childhood. Our data are also available for use by future follow-up studies to identify any causal relationships that may exist.
We found evidence of an association between prenatal growth status and renal function markers in childhood and exposure factors that may affect the renal dysfunction related to high BP in early life. Therefore, to prevent adult elevated BP, we need to identify potential high-risk groups as early in life as possible and apply appropriate monitoring and multipronged intervention strategies.
 XML Download