

 PDF
PDF ePub
ePub Citation
 Print
Print


INTRODUCTION
The proportion of the elderly among patients with intraoral soft and hard tissue diseases has increased rapidly as aging or super-aging populations have increased in recent years [1]. Various risk factors contribute to tooth loss caused by declining oral health. Despite improvements in dental care and strategies to maintain teeth, tooth loss remains a significant public health concern. Among the primary causes of tooth loss in Korea, periodontal disease and dental caries, which were ranked as the third (approximately 7.9 million people) and seventh (approximately 5.37 million people) most common causes in 2010, have increased by 1.9-fold and 1.1-fold to rank second (approximately 15 million people) and sixth (6 million people) in 2017, respectively.
As well as the occurrence of chronic non-communicable diseases (NCDs, including cardiovascular disease, hypertension, diabetes mellitus [DM], cancer, osteoporosis, erectile dysfunction, and dementia), the occurrence of tooth loss has also been steadily increasing [23]. Teeth are an important anatomical structure and tooth loss negatively affects mastication and nutrient intake, pronunciation, smile, appearance, and quality of life [4]. In addition, tooth loss may be a modifiable risk indicator or factor for NCDs; furthermore, NCDs may also affect tooth loss, resulting in a mutual causal and bidirectional relationship between these factors [5].
Due to the continuous and gradual expansion in the target population and the applicable range of dental health insurance coverage (DHIC) in Korea, public awareness and interest in oral health have been enhanced and the physical and economic accessibility of dental clinics has improved. Preventive periodontal scaling (once-yearly plaque and calculus removal) for adults 20 years and older was included in DHIC starting in July 2013 and was subsequently expanded to include adults 19 years and older in 2017. Sealant resin (sealants for preventing dental caries and light-curing composite resin restoration in permanent teeth) treatment for children and prosthodontic treatments (including partial and full dentures as well as dental implants) for the elderly (individuals aged 65 years or older) are also included in DHIC.
Ninety-seven percent of Koreans are obligatorily enrolled in the national health insurance system, and all medical and dental expense claims are supervised by the National Health Insurance Service (NHIS) and the Health Insurance Review and Assessment Service (HIRA). The NHIS and HIRA provide researchers with large public health databases for research on disease prevention, diagnosis, treatment, rehabilitation, and mortality [6]. The cohort database, which is easier to access for research purposes, was released in 2013, and large-scale epidemiological studies have been actively conducted in various medical and dental fields [78]. Similarly, studies have also investigated the associations between general and oral health status and tooth loss, but few of them have reflected the recent DHIC modifications [910]. Therefore, the present study evaluated the associations between health status and tooth loss based on data from the NHIS-Health Examinee Cohort (NHIS-HEC) in 2002–2015, which was updated and newly released in 2018.
MATERIALS AND METHODS
Study design and sample
This study used information from the NHIS-HEC database provided by the National Health Insurance Sharing Service (https://nhiss.nhis.or.kr). The Institutional Review Board of Daejeon Dental Hospital, Wonkwang University approved this study (approval no. W1710/002–001). This study conformed to the Strengthening the Reporting of Observational Studies in Epidemiology guidelines (www.strobe-statement.org). Because of the retrospective nature of the study and because the data were obtained from the NHIS (NHIS-2019-2-013), the need for written and informed consent was waived.
The NHIS-HEC targeted individuals who received a general health examination (40–79 years of age between 2002 and 2003). A total of 514,866 participants (10% of 51.5 million examinees) were extracted based on random stratified sampling. This database includes sociodemographic and economic information, information on medical and dental health care claims, general and dental health examinations (primary and secondary), general and dental health examinations of the life-span transition period (primary and secondary, for people aged 40 years and 66 years), cancer examinations, and infant/child health examinations, as well as elderly care facility information and other variables related to disabilities and mortality.
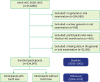
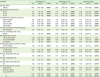
Among the 514,866 participants included in the NHIS-HEC, those with no general or oral examination records (n=254,088), with unclear general or oral examination records (n=186), who were Medical Aid beneficiaries (n=420), and with missing data in the general or oral examination records (n=25,925) were excluded. As a result, 234,247 participants were selected for the current study and the period between 2002 and 2005 was set as the baseline (Figure 1).
Independent and confounding variables
In the present study, the following variables reflecting sociodemographic and economic factors, general and oral health status, and comorbid diseases in the NHIS-HEC data were included in the models: sex, age (40–79 years of age, in 10-year groups), household income (quintiles 1–5, grouped by the insurance fee imposed on each household), insurance status, presence of disability (as classified by the Handicapped Welfare Law), body mass index (BMI, classified as follows: <18.5 kg/m2 as underweight, 18.5–23 kg/m2 as normal, 23–25 kg/m2 as overweight, and >25 kg/m2 as obese), smoking (classified as non-smokers/former smokers and current smokers) and drinking (classified as non-drinkers, drinkers who drink <3 times a week, and drinkers who drink ≥3 times a week) status, periodic dental visits and periodontal scaling at least once a year, tooth brushing before sleep, hypertension (International Classification of Diseases, tenth revision [ICD-10] codes: I10 and I15), DM (ICD-10 codes: E10–E15), and Charlson Comorbidity Index (CCI).
Comorbid disease was diagnosed by medical doctors and the diagnostic and prescription codes were obtained for each participant. The CCI is an index used to assess disease severity by assigning weights according to the type of comorbidity for a total of 17 diseases as follows: 1 point for acute myocardial infarction (ICD-10 codes I21, I22, and I252), congestive heart disease (ICD-10 code I50), peripheral vascular disease (ICD-10 codes I71, I739, I790, R02, Z958, and Z959), cerebral vascular accident (ICD-10 codes I60–I69, G450–G452, G454, G458, G459, and G46), dementia (ICD-10 codes F00–F02 and F051), pulmonary disease (ICD-10 codes J40–J47 and J61–J67), connective tissue disorders (ICD-10 codes M32–M35, M058–M060, M063, and M069), peptic ulcer (ICD-10 codes K25–K28), liver disease (ICD-10 codes K702, K703, K717, K73, K740, and K742–K746), and DM without end-organ damage (ICD-10 codes E101, E105, E109, E111, E115, E119, E131, E135, E139, E141, E145, and E149); 2 points for DM complications (ICD-10 codes E102–104, E112–114, E132–134, and E142–144), paraplegia (ICD-10 codes G041 and G81–G822), renal disease (ICD-10 codes N01, N03, N052–N056, N072, N18, N19, and N25), and cancer (ICD-10 codes C0–C96); 3 points for metastatic tumor (ICD-10 code C77–C80) and serious liver disease (ICD-10 codes: K721, K729, K766, and K767); and 6 points for human immunodeficiency virus (ICD-10 codes: B20–B24). The CCI is classified as mild for scores of 0, moderate for scores of 1–2, and severe for scores ≥3 [11]. The present study classification used scores of 0, 1, and ≥2, for mild, moderate, and severe, respectively.
Statistical analysis
We performed χ2, univariate, and multivariate Cox proportional hazards regression analyses to evaluate the effects of health status and tooth loss. Hazard ratios (HRs) with 95% confidence intervals (CIs) were calculated while adjusting for possible confounding factors including sociodemographic and economic factors, general and oral health status, and comorbid disease. The cumulative incidence of participants experiencing the loss of at least 1 tooth was estimated using the adjusted Kaplan-Meier method. P values <0.05 were considered to indicate statistical significance and all data used in this study were analyzed using SAS version 9.4 (SAS Institute, Cary, NC, USA) from the Department of Health Insurance Research, Ilsan Hospital, NHIS.
RESULTS
Baseline characteristics
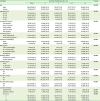
Of the 234,247 total participants, 136,658 (58.3%) were male and 97,589 (41.7%) were female. Among them, 119,538 (51.0%) had experienced the loss of at least 1 tooth. The highest prevalence of tooth loss occurred in the 60–69-years age group (n=26,096, 63.7%) and those belonging to the third income quintile (n=18,289, 53.7%). The probability of experiencing the loss of least 1 tooth was high among self-employed participants in the NHIS (n=38,136, 52.7%), those with a disability (n=692, 55.4%), those with a BMI ≥25 kg/m2 (n=44,295, 54.9%), current smokers (n=47,154, 57.9%), drinkers who drank ≥3 times a week (n=14,828, 57.7%), those with periodic dental visits (n=56,112, 56.5%), those who received periodic scaling (n=26,037, 53.2%), those who did not brush their teeth before sleep (n=85,416, 51.9%), those with hypertension (n=21,196, 56.4%), those with DM (n=8,832, 62.2%), and those with a CCI ≥ 2 (n=13,304, 52.6%) (Table 1).
Table 1
Baseline characteristics of the population included in the National Health Insurance Service–Health Examinee Cohort according to their experience of tooth loss
Tooth loss
The univariate analysis (Table 2) showed that all included variables were significantly associated with the loss of at least 1 tooth. In particular, participants with DM had a 1.80-fold (95% CI, 1.74–1.86; P<0.001) increased risk of experiencing the loss of ≥4 teeth, while smoking and drinking ≥3 times a week was associated with 1.67-fold (95% CI, 1.64–1.70; P<0.001) and 1.43-fold (95% CI, 1.39–1.47; P<0.001) increased risks of experiencing a loss of ≥4 teeth, respectively.
Table 2
Associations of tooth loss with general and oral health status (univariate analysis)
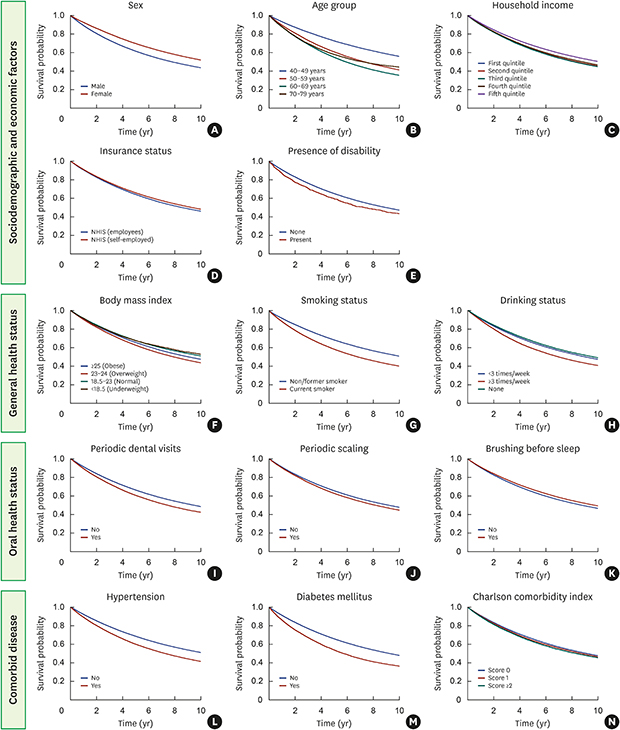
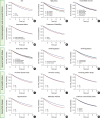
The adjusted multivariate analysis (Table 3) revealed that sex, age, household income, the presence of a disability, BMI, smoking and drinking status, periodic scaling, tooth brushing before sleep, DM, and the CCI were significantly associated with the loss of at least 1 tooth. Women had a 0.77-fold (95% CI, 0.75–0.80; P<0.001) lower risk of experiencing the loss of ≥4 teeth than men and the risk of tooth loss in the fifth (highest) quintile of household income was 0.80-fold (95% CI, 0.78–0.83; P<0.001) lower than that in the first quintile. Unlike the findings of the univariate analysis, participants with a disability showed a lower risk of tooth loss than their counterparts in the multivariate analysis; however, the difference was not statistically significant. The probability of experiencing tooth loss increased with age; in particular, participants aged 60–69 years (95% CI, 2.85–3.02; P<0.001) and 70–79 years (95% CI, 2.81–3.05; P<0.001) showed a 2.93-fold increased risk of experiencing a loss of ≥4 teeth than participants aged 40–49 years group. Current smokers had a 1.69-fold (95% CI, 1.65–1.73; P<0.001) increased risk of experiencing a loss of ≥4 teeth, while those with DM showed a 1.43-fold (95% CI, 1.38–1.48; P<0.001) increased risk. Adjusted Kaplan-Meier curves also showed that sociodemographic and economic factors, general and oral health status, and comorbid disease were statistically significantly associated with the loss of at least 1 tooth (Figure 2).
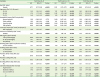
Table 3
Association of tooth loss with general and oral health status (multivariate analysis)
Boldface denotes statistical significance (P<0.05). The multivariate Cox regression analysis was adjusted for sociodemographic and economic factors (sex, age, household income, insurance status, presence of disability), general health status (BMI, smoking, and drinking status), oral health status (periodic dental visits and scaling, brushing before sleep), and comorbid disease (hypertension, diabetes mellitus, and CCI).
HR: hazard ratio, CI: confidence interval, NHIS: National Health Insurance Service, BMI: body mass index, CCI: Charlson comorbidity index.
DISCUSSION
Epidemiological studies have reported significant differences in the accessibility of dental care services depending on variables including sex, age, household income, education level, insurance status, physical or mental disability, dental compliance and health status, and comorbidities, which are closely related to tooth loss [1213]. In particular, chronic and severe periodontal disease and DM were found to be the primary causes of the loss of multiple teeth in elderly patients [1415]. The results of the present study confirmed these previous findings and suggestions.
Women had a significantly lower risk of losing ≥4 teeth than men. This may reflect both the protective effects of estrogens on the alveolar bone and differences in attitudes toward oral health care [1617]. The fifth (highest) quintile had a lower frequency of tooth loss than the first quintile, which is also in agreement with previous studies. This discrepancy can be explained by the tendency for economic and social stability to facilitate more attention and treatment opportunities for oral conditions [918].
In terms of oral health status, periodic dental visits, annual periodontal scaling, and tooth brushing before sleep showed statistically significant associations with tooth loss. Participants who did not receive periodic periodontal scaling and who did not regularly brush their teeth before sleep showed higher risks of tooth loss, whereas those who did not visit the dentist regularly had a lower risk of tooth loss, with an especially low risk of experiencing a loss of ≥4 teeth. Previous studies have reported that the act of visiting a dental clinic itself is closely associated with tooth loss. Furthermore, better access to dental care services both decreases tooth loss and improves oral hygiene [9].
Numerous studies have reported that high levels of alcohol intake increase the risk of periodontal disease [1920]. Excessive drinking suppresses various immune responses, thereby increasing the incidence of infectious diseases [21]. Moreover, alcohol can also interfere with protein metabolism and tissue healing, stimulate bone resorption, and exert toxic effects directly on the periodontal tissues [22]. However, controversy remains regarding the direct association between the amount and frequency of drinking and tooth loss. In the present study, an association between drinking frequency and tooth loss could not be confirmed [23].
The accumulation of glucose-mediated advanced glycation end products due to DM promotes the proliferation of periodontal pathogens, including Porphyromonas gingivalis, Treponema denticola, and Prevotella intermedia. Smoking also creates a favorable environment for the growth of periodontal pathogens by interfering with blood flow and lowering the oxygen density in the periodontal pocket [2425]. An increase in the number of obligate anaerobic bacteria triggers a hyper-inflammatory response and increased secretion of inflammatory-mediated cytokines with acute-phase proteins, including C-reactive protein, interleukin-6, and tumor necrosis factor alpha. These changes in periodontal tissue cause the destruction of tooth-supporting periodontal tissue and increase the probability of tooth loss [262728].
Many studies have reported uncontrolled DM, regardless of type and smoking status (including former smokers), to be a major risk factor responsible for at least a 2-fold increase in the risk of tooth loss [2930]. The findings of the present study also confirmed that DM and smoking were closely associated with tooth loss, with 1.43-fold (95% CI, 1.38–1.48; P<0.001) and 1.69-fold (95% CI, 1.65–1.73; P<0.001) increased risks of experiencing the loss of ≥4 teeth, respectively. Patel et al. [31] reported that patients with DM had a significantly higher number of missing teeth compared to healthy people and Taylor et al. [32] also reported more tooth loss in patients with DM.
Obesity is a chronic metabolic disorder in which various cytokines and hormones secreted from adipose tissues are involved in systemic inflammatory processes [33]. Previous studies using data from the National Health and Nutrition Examination Survey (NHANES) showed that a higher BMI was associated with a higher prevalence of periodontal disease [3435]. The combined effects of the 5 factors associated with metabolic syndrome—excess body fat around the waist, abnormal cholesterol or triglyceride levels, and high blood pressure and glucose levels—increased the risk of periodontal disease and tooth loss [3637].
The CCI considers 17 systemic diseases and assigns scores (1–6 points) according to the severity and mortality risk of those conditions, making it a useful tool to assess the overall severity of systemic diseases. In the present study, participants with higher CCI scores showed a lower risk of tooth extraction, which is inconsistent with previous studies reporting that people with more severe disabilities or systemic diseases have poorer oral care and hygiene [3839]. Selection bias may have resulted from limiting the participant population of the present study to those who received general and oral health screenings. This interpretation is supported by the consistent observation of low HRs for experiencing tooth loss among those with a low household income, physical and mental disability, and less access to medical and dental care services [11].
The multiple variables that have an impact on tooth loss represent a complex interaction between biological and social factors. Previous studies have shown that adequate oral health control reduces tooth loss compared to otherwise, but this study showed a different result. As dental implants have become widely accepted and more common in recent years, and have been included in DHIC, the number of cases involving tooth extraction and dental implant placement has increased significantly. Therefore, when interpreting tendencies of tooth loss, changes in dental healthcare policies must be carefully considered. However, there are no data about the number of implants installed during the time period analyzed in this study, for which reason we could not investigate implant placement in this study. Further study is needed.
Tooth loss can have impact on patients' quality of life, including factors such as chewing, appearance, and speaking. For instance, Joshipura et al. [40] proposed that tooth loss might cause changes in patients' diet, such as reduced fiber intake, which might increase the risk of cardiovascular disease. Our study provides evidence of associations between health status and tooth loss, even though the biological and/or pathological mechanisms underneath these associations remain unclear. This result underscores the principle that the role of teeth in health should not be overlooked.
Lastly, this study has several limitations. First, unlike the NHANES, there was no direct calibration training for the medical doctors and dentists performing general and oral examinations and questionnaire surveys. Accordingly, intra and inter-examiner reliability and repeatability were not assessed; therefore, the possibility of underestimation or overestimation should be considered in the interpretation of the clinical parameters. Second, because tooth loss was reviewed and selected based on prescription codes, we could not identify the specific causes of tooth loss (e.g., caries, trauma, orthodontic treatment, prosthodontic treatment, endodontic treatment, and periodontal disease). The factors affecting tooth loss may be diverse, ranging from genetic reasons to improper habits. It is difficult to elucidate the influence of a single factor in tooth loss, since tooth loss is caused by the complex interactions of multiple factors. Thus, this study alone has limitations in assessing the impact of health status on tooth loss. Moreover, another major limitation of the present study was the fact that the severity and type of comorbidities—especially the severity of DM and its associated complications—were not assessed because insufficient data were present in the medical records. Further interventional and observational studies should assess other diabetes-related measures related to oral health. Despite continuous population-level improvements in oral health and environmental conditions, more than 51% of participants had experienced the loss of 1 or more teeth. The findings of this study also confirmed that various health status variables, especially DM and smoking, were significantly associated with tooth loss.
 XML Download