

 PDF
PDF ePub
ePub Citation
 Print
Print


INTRODUCTION
A major goal of modern neuroscience is to detect the neural firing patterns linking circuit dynamics to behaviors. For many decades, genetically encoded fluorescent protein down-stream of IEG promoters (e.g., c-fos, Arc, Egr1, and Homer1a), usually through virus injecting methods, or immunochemistry detecting the same IEG proteins, were used to label neuronal cells that fired during a specific behavior [1234567]. However, these indirect approaches have a critical limitation—there cannot be accurate evidence of neuronal cell firing during a behavior because the role and precise mechanism of IEG expression is unknown and the induction protocol is imperfectly regulated, even though many researchers have used these methods for evidence of cell firing during specific behaviors [89101112]. Along with these reasons, to understand the operational principles of neural circuit dynamics, the order of connectivity should be considered. Neural circuits consist of series of connections—chains coupling presynaptic to postsynaptic neurons corresponding to firing order. Therefore, the order of firing pattern is essential, and the time point of firing for each cell should be considered to understand the operational fashion of neural circuits.
For these reasons, recent neuroscience research trends have utilized cell-type specific and low-level circuit studies [13141516171819] as well as tracking dynamics of functional ensembles at single cell resolution in real-time [2021]. Genetically encoded ion indicators developed for recording electrochemical events of the action potential can be applied to both research types. Many studies for specific cell-type or circuit already exist; however, to collect more convincing evidence of direct neural activities that represent the real world, a direct method to detect cells firing simultaneously with an animal behavior is rising and needed. During the last two decades, much effort has focused on capturing ‘real-time’ cell activities by recording electrochemical events, and several techniques have been developed based on the action potential principle. As a result, major ions Na+, K+, and Ca2+ of membrane potential have become powerful candidates for developing optical indicators—by expressing a fluorescent ion indicator under a specific promoter, the real-time single cell activities of targeted ensembles can be visualized.
In this review, we discuss the developmental history as well as the pros and cons of ion indicators, focusing on genetically encoded calcium indicators (GECIs). Along with GECI properties, we discuss the imaging methods and corresponding GECI signal analysis. This review aims to offer an overview of the biophysical properties and limitations of the different GECI variants and to provide perspective to GECI users for choosing the best-suited variants.
WHY GECI?
To detect neuronal activities, two targets are accessible: voltage and ions. One possible way is to identify the voltage dynamics when cells undergo a series of action potential phases—the depolarization, repolarization, hyperpolarization, and resting phases. For this purpose, genetically encoded voltage indicators (GEVIs) have been developed. GEVIs are fusions of a four-pass voltagesensing domain (VSD) and fluorescent proteins [22232425]. A conformational change of the VSD modulates the brightness of the fluorescent protein [26]. GEVIs can detect hyperpolarization and subthreshold depolarizations and have faster kinetics than GECIs [27]. Although there are several advantages of using GEVIs, localizing them to the plasma membrane has been difficult; poor GEVI targeting to the plasma membrane is the main reason for the lag behind GEVI development compared to that for GECIs [2829]. Despite these challenges, there are several GEVIs currently being used, such as ASAP2f and ArcLight [3031].
Alternatively, neuronal activities can be detected via ion dynamics. Ions associated with the electrochemical event of an action potential represent the precise dynamics of internal and external concentrations. Several ion probes have been developed—sodium binding fluorescent indicators (SBFIs), potassium binding fluorescent indicator (PBFIs), and calcium indicators that detect Na+, K+, and Ca2+ ions, respectively. PBFIs are not proper indicators for cell activity. Potassium ions are already abundant in intracellular spaces and are released after sodium influx, making researchers trace the slow signal dissolution. Indeed, for detecting the firing of neuronal cells, we should focus on the ions that induce membrane depolarization. For these reasons, potassium indicators are not suitable for representing neuronal activities. In the case of sodium indicators, most types are chemical SBFIs, such as CoroNa Green (or Red), Asante NaTRIUM Green2 (ANG-2), and Na+-binding benzofuran isophthalate (SBFI-AM) [32]. These chemical sodium indicators should be delivered to cells via a micropipette, which is the main limitation for in vivo experimental application. A few genetically encoded indicators have been developed that are based on sodium channel proteinbased activity reporting constructs (SPARCs) [2433]. Although SPARCs report the gating of the sodium channel with fast kinetics (2 ms), SPARCs cannot provide information about the sodium ion concentration per se because they are composed by inserting green fluorescent protein (GFP) sequence into the rat µI skeletal muscle sodium channel sequence, limiting their application [24]. Above all, sodium has a high basal intracellular concentration and a small activity-driven concentration gap between extra- and intra-cellular concentrations (Table 1) [3435], increasing the potential for noise. This demerit can be managed with data postprocessing; however, in the case of in vivo neuronal recording, in which many cells are piled up along z-stack, it becomes more difficult to overcome the small signal-to-noise gap.
Compared to sodium ions, calcium ions are more attractive targets. The low basal calcium concentration state enables minimizing nonspecific background signal, and the concentration gap between the basal and activated states is considerably more significant for calcium than sodium (Table 1). Additionally, calcium ion influx is the first step of neuronal activation, with fast action potential and decaying time dynamics. Most of all, as an optical indicator, calcium indicators can provide information on calcium dynamics that electrophysiological recording and functional magnetic resonance imaging cannot.
Exploiting these calcium ion properties, several kinds of calcium dyes have been developed; there are two main categories: (1) chemical calcium dyes and (2) GECIs. In the early days, chemical calcium dyes were first developed, such as fluo-4 or Oregon Green BAPTA (OGB)-1; however, these kinds of chemical dyes are delivered via cell permeabilization by a whole-cell patchclamp or with an acute bulk loading protocol under lipophilic conditions that can damage cells and constrain subsequent imaging conditions [3637]. In contrast, GECIs are noninvasive and are easily expressed through virus-delivery methods, such as adenoassociated virus or lentivirus, with the least damage. In addition, GECIs allow for selective yet unbiased labeling of neuronal cell types or populations, such as those comprising an engram [21]. This enables research on the firing pattern of each neuronal cell type as well as ensembles of neuronal events.
Despite many pros, GECIs also have limitations. Since most GECIs are based on the Ca2+-binding mechanism of calmodulin and calmodulin-binding proteins, the Ca2+ chelating phenomena can occur; Ca2+ chelating can provoke interference with intracellular signaling pathways or several calcium channels, though there are instances in which GECIs do not interrupt the function and development of voltage-gated Ca2+ channels (VGCCs) [38]. Hence, virus titer conditions are critical to proper GECI expression.
CALCIUM DYNAMICS
For proper analyzing and representing neuronal activities with GECI signals, understanding how calcium concentration changes in neurons is essential. Calcium ions are involved in multiple functions including muscle contraction, hormone secretion, and intracellular metabolism, which occur over a wide temporal range in the body—from microseconds to hours [39]. Among the properties of Ca2+ ions, time courses, amplitudes, and related sub-compartment activity are regarded as important biological factors. Furthermore, calcium ions perform unique roles in the nervous system including promoting neurotransmitter release by inducing synaptic vesicle exocytosis; accordingly, calcium ion concentration is important in determining synaptic plasticity at synaptic ends. Most neurons have calcium concentrations of 50 to 100 nM, which raises tens of times during an action potential [40].
There are some well-known calcium sources related to intracellular calcium dynamics (Fig. 1). Extracellular space is the primary source of calcium ions that interact with neurons via plasma membrane receptors and ion channels. There are three major groups of calcium channels in the plasma membrane: (1) VGCCs, (2) receptor-operated Ca2+ channels (ROCs), and storeoperated Ca2+ channels (SOCs). VGCCs mainly respond to electrical signals induced by calcium ion binding [41]; especially in neurons, the VGCC works as an impulse generator or propagator that consist of several subunits; α1, α2δ, β, and Y [42]. Unlike VGCCs, ROCs are activated by the binding of specific ligands including excitatory neurotransmitters, such as L-glutamate. Two types of receptors are classified as ROCs—metabotropic receptors (mGluRs) and ionotropic receptors (iGluRs) including alpha-amino-3-hydroxy-5-methyl-4-isoxazole propionic acid-sensitive receptors (AMPARs) and N-methyl-D-aspartate sensitive receptors (NMDARs) in neurons and glial cells [43]. The SOC is a recently found structure [44] and is activated by STIM proteins accumulated at endoplasmic reticulum (ER) and plasma membrane (PM) junctions through the depletion of Ca2+ from the ER. Calcium influx through SOCs increases local calcium concentration and initiates signaling pathways including gene transcription and secretion [44]. Regarding calcium channels, exchanger types also exist; both the plasma membrane Ca2+ ATPase (PMCA) and Na+/Ca2+ exchanger (NCX) play roles in cellular calcium export. PMCA has a high Ca2+ affinity but less capacity for transport, whereas NCX works in the opposite way [45].
Cell organelles are the second major source of calcium ions. The endoplasmic reticulum releases calcium ions through two types of ion channels/receptors: ryanodine receptors (RyRs) and inositol-1,4,5-trisphosphate receptors (IP3Rs). RyRs tend to be expressed in neuronal and muscular cells and are activated when intracellular calcium concentrations increase [46], while the IP3R pathway is mostly controlled by neurotransmitters [47]. Mitochondria play a significant role in the regulation of calcium signaling, accumulating calcium ions in the mitochondrial matrix through the buffering of calcium ions and connecting with adjacent ER channels. This calcium ion accumulation contributes to ATP production used for feedback regulation of the mitochondrial calcium channel [48].
In addition to direct calcium sources, calcium-binding proteins— calcium buffers and calcium sensors—also affect intracellular calcium concentration by regulating calcium ion availability [49]. Hence, the calcium ions themselves can play roles as essential factors regulating both the RyR and IP3R pathways, which comprise internal feedback loops that lead to dendritic calcium waves in neocortical and other neuronal types [50]. Furthermore, an action potential in neurons could induce calcium influx and, consequently, RyR-mediated processes in the ER [51].
GECI DEVELOPMENT
Developing calcium sensors is one of the main branches in the improvement of calcium imaging systems. The initial calcium indicators for observing calcium dynamics at the cellular level were aequorin [52] and arsenazo III [53]. When combined with calcium ions, these indicators emit light of a specific wavelength or change absorption spectrum. However, because of their lower sensitivity to calcium ions and a short range of detectable calcium concentration, chemical calcium indicators, such as fluo-4 [54], are beginning to be developed using calcium-selective chelators that generate more accurate calcium signals. Chemical calcium indicators have been used widely in the neuroscience field, because of their broader excitation spectra and higher calcium affinity. Additionally, accompanied by the popularization of viral delivery methods, GECIs, named cameleons [55], were introduced with calcium binding domains cloned from a living organism and could be used for cell type-specific studies. GECIs rapidly have overcome issues of previous indicators including slow responses and low signal-to-noise ratios. GECIs have become promising indicators because they can be genetically modified for studying living organisms in optimum biological conditions [56].
Generally, GECI design consists of three components: calmodulin (CaM), a CaM-binding domain (e.g., M13 and RS20), and a circularly permuted green fluorescent protein (cpGFP) or enhanced cpGFP (cpEGFP). Calmodulin has four calcium binding EF hands that can induce conformational changes of GECIs that makes a tight ring around the CaM-binding domain. Subsequently, this calmodulin-CaM-binding protein complex creates a new domain interface that combines with cpGFP or cpEGFP [57]. These moieties can be modified to improve the proper fluorescent signal, such as with CatchER [58].
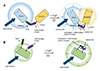
In principle, GECIs can be classified into two types: (1) fluorescence resonance energy transfer (FRET)-based and (2) single-fluorophore-based (Fig. 2). The FRET types are a combined form of two fluorescent proteins. When calcium ions are attached, the distance between the two proteins decreases (< 10 nm), inducing non-radioactively energy transfer between donor and acceptor fluorophores [59]; therefore, FRET changes both fluorophores' light emission properties, which depends on the ratio of donors to acceptors. Single-fluorophore GECIs show conformational changes mostly through CaM and cpGFP/cpEGFP. This induces chromophore deprotonation, like phenolate oxygen, that leads to an increase in fluorescent emission [5760]. The GCaMP family is a well-known single-fluorophore GECI.
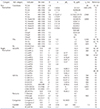
For deliberate indication of biological calcium activities, some essential GECI features should be considered including, but not limited to, dynamic range, signal-to-noise ratio, ion affinity, ion selectivity, and kinetic properties [61]. Table 2 presents the features of several GECIs [5556586162636465666768697071727374757677787980]. Dynamic range is one of the most important features, which is calculated as Imax/Imin where Imax is the maximum fluorescent intensity and Imin is the minimum fluorescent intensity; increasing the Imax/Imin value makes calcium signal detection easier. The signal-to-noise ratio is determined by comparing fluorescence signal with background fluorescence noise. Calcium affinity is also a notable feature since GECIs should catch up with calcium dynamics. Although conformational changes and various binding sites can affect calcium affinity [55], ionic strength, ionic composition, and pH are related to GECI calcium affinity for in vivo conditions [81]. Additionally, ion selectivity is crucial because Mg2+ is the most common divalent cation competing with Ca2+. To remove Mg2+ sensitivity from GECIs, researchers replaced the C-terminal EF-hand motif of troponin C [82] and made Mg2+-insensitive Ca2+ indicators [7882]. Many kinetic properties, such as the dissociation constant (Kd), are supposed to be considered especially when the accurate measurement of Ca2+ transients is required [61].
Considering these GECI properties, GECI development has been diversified because researchers differently prioritize each calcium indicator aspect, such as brightness, response time, and resistance to photobleaching. For instance, researchers can modify higher affinity or faster working GECIs by changing specific motifs or replacing them with suitable ones. The 3D structures of GECIs also allow for developing better GCaMP variant designs [66]. GCaMP3fast—one of the fastest GECIs—was designed by a single point mutation of the first Asp to Ala on each EF-hand Ca2+ binding loop to weaken the Ca2+-CaM-RS20 interaction [67]. GCaMP7, which has sufficient brightness to detect single action potentials [83], has slow kinetics but high Ca2+ affinity [68]. In general, a single action potential induced by calcium transient has a 50 to 60 ms half-decay time in non-buffered conditions [84]. GCaMP6f has a 71 ms half-decay time in vitro at 37℃ [68]. GCaMP3fast—a variant of GCaMP3—shows a 3 ms half-decay time in vitro [85]. In total, GECIs can be customized to assess calcium properties relating to neural activity.
To avoid spectral overlap with green in fluorescent images, blue and red GECI variants are appropriate options. RCaMP series is a well-known RFP-based GECI that is engineered from mRuby with the GCaMP3 scaffold [86]. jRGECO1a, which is engineered from RCaMP1h and R-GECO1, shows improved sensitivity for neural activity detection [70]. Beyond the red-shifted GECIs, there are some multicolor variants of indicators. For instance, Zhao et al. [65] developed genetically encoded calcium indicators for optical imaging (GECO) by scanning thousands of randomly generated GCaMP3 mutations. GECOs have a large range of variants, including G-GECO, R-GECO, and B-GECO, that represent green, red, and blue fluorescent indicators, respectively. Although these various colored GECOs are useful when researchers want to mark multiple targets or deeper region when using long wave-length of fluorescence, they have limitations including weak intensity and high background when using red fluorescence [87] or tissue photodamage when using blue fluorescent excitation [88].
IN VIVO GECI IMAGING METHODS
For stable GECI imaging, retaining strong photostability is of the highest importance. Current GECIs are adjusted to have proper performance in the physical range of calcium ions in an in vivo environment but have different photostabilities. Especially in long-term tracking of cell activities, the photobleaching problem intensifies such that the entire imaging time and the degree of light power should be considered when choosing the proper GECI derivative. GFP derivatives (e.g., GCaMPs) and red fluorescent protein (RFP) derivatives (e.g., RCaMPs) are often used for a clear distinction. However, GFP variants are more photostable than RFP ones, and the derivatives of other hues, such as yellow or orange, are more vulnerable [89]. Moreover, the time interval between imaging and fluorescent recovery after photobleaching should be considered. For multicolor imaging, the photostability of each fluorescent protein and the types of GECI are worth considering. Regarding GECI types, FRET-based GECIs are based on two emission channels, typically CFP and YFP; accordingly, single FP-based sensors are preferable when choosing GECIs for multi-color imaging. In addition, GECIs are usually expressed stronger in vivo with virus delivery methods compared to using transgenic mouse lines [84].
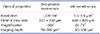
Generally, in vivo GECI expressing cells are imaged with several methods. Although fiber photometry can image the overall GECI fluorescent signal [90], two-photon microscopy and head-mounted microendoscopy can image single cell activation; a comparison of these two GECI imaging types is shown in Table 3 [91929394959697]. Imaging with two-photon microscopy generally requires fixing the head of an animal in place. Conventional two-photon imaging necessitates undergoing cranial window surgery, which limits the possible imaging region of the cortex [20]. However, there is a new imaging technic combining two-photon microscopy and gradient index (GRIN) lens that enabled two-photon microscopy to overcome the limitation of imaging depth [9899100].
Nevertheless, two-photon microscopy imaging has a commanding advantage that enables high resolution imaging even to the level of dendritic spines [20]. Since only a single focal plane is excited, the background signal is low, less signal overlapping occurs, and photobleaching problem is lessened, all contributing to a clearer and more stable image. With a virtual reality (VR) system, this imaging method can overcome the limitation of behaviors studied, and behavior protocols that involve the movement of animals, as with an animal walking on a ball, can be executed [101]. However, two-photon microscopy has limited imaging depth from a cranial window and requires a noteworthy effort by the animal to habituate head fixation. Overcoming limited penetration depth may become a significant issue for two-photon microscopy.
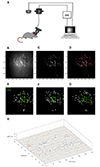
In contrast, microendoscopy is free from the animal fixation problem because the device is light (2 to 3 g) and portable enough to study animal behavior (Fig. 3) [102103]. Previous wired versions needed to be connected to a data acquisition device (DAQ hardware) through a commutator, but, recently, a wireless version with SD card and battery has been developed [101] that is expected to minimize the activity area restriction and the effect on animal task performance. Then again, the wide-field microendoscopy focuses on tracking activity from a neuronal population such that the magnification tends to be smaller for securing a broader view and increasing the number of detected cells; by the same token, as magnification gets smaller and focused on somal calcium imaging, detecting GECI signal at the synaptic level gets more difficult. Nevertheless, the two-photon version of the microendoscopy has recently been developed [92104105] and may be a better alternative tool for precise imaging during animal behavior. For vertically-layered areas, such as the neocortex, the image can be attained vertically with a microprism, which converts the vertical image horizontally and relays it to a signal detection device. Microprisms enable recording multi-layer cellular activities [106107108]. Furthermore, Inscopix Inc. developed a new microendoscopy that combines optogenetics tools and calcium imaging devices [109], enabling the simultaneous manipulation of neural circuits and the imaging of calcium signaling. This achievement may be a milestone for neural circuit research.
ANALYSIS OF GECI IMAGES
Using GECI has enabled researchers to make more sophisticated observations of neuronal activity at the single-cell level. This has led to a few demands for proper analysis tools by researchers to prove their hypotheses. However, GECI analysis at the single-cell level has difficulties because neuronal populations have dynamic properties [110]. Additionally, the huge size (i.e., gigabytes to terabytes) of the video files from GECI images can restrict the analysis that allows researchers to choose the proper options that depend on their research goal, such as time reduction, accuracy, and efficiency. Data processing algorithms and their programming languages also vary across laboratories. Hence, code compatibility is not guaranteed when using several open source codes all at once, potentially leading researchers to improperly choose proper analysis tools. In this section, we will deal with the general processes for analyzing GECI-based images, which can be extended to general fluorescent data analyses.
Regardless of the analytical demands, experimental conditions, and questions, there are three general steps to process GECI data: (1) pre-detection processing, (2) cell detection processing, and (3) post-detection processing. Before running cell detection algorithms, pre-detection processing is essential, which includes motion artifacts deletion, regions of interest (ROI) segmentation, and ROI dF/F0 calculations. In an experiment, the data cannot practically be obtained in a perfectly rigid condition since the camera/microscope and the target can move or vibrate. Thus, motion artifact deletion is done to align whole GECI images, generally by using a fast Fourier transform (FFT). Additionally, researchers can calculate the maximum cross-correlation between each frame on the field of view consisting of overlapped patches; cross-correlation results are used to calculate displacement vectors that can be used for aligning all imaged structures. ROI segmentation is a process that discriminates the area of interested elements from that of others. For instance, the signals from neurites can be regarded as noise for some researchers but may be valuable to others. Additionally, since GECIs are expressed in the cytosol and not in the nucleus, some cells can be detected in a ring form or a circular form [111]; this should be considered when the soma of neurons is the ROI. Thus, setting the proper threshold to separate ROIs from non-ROIs is essential. As a result, many analysis algorithms allow users to choose those options, such as dendrite on/off, ring/circle, and value of threshold. The dF/F0 calculation is also important because there are basal fluorescent signals from GECIs, and, when imaging GECI signals with general methods, such as microendoscopy or two-photon microscopy, signals from the interested elements can overlap with noise. F0 can be calculated using the average ROI from the user's field selection or with algorithms that estimate it from fluorescence baseline fluctuations.
There are various ways for cell detection processing, from classical principal component analysis and independent component analysis (PCA-ICA) [112] to neural network-based algorithms, such as constrained non-negative matrix factorization (CNMF) and CNMF for endoscopy data (CNMF_E) [113].
PCA-ICA, a well-known analysis method in dimension reduction, is a popular method of many fields. In analyzing GECI signals, PCA performs dimension reduction and noise removal; then, through ICA, researchers can get 2D plots of spatial/temporal skewness of pixels in the spatial filter. Signals can be separated through the skewness level because noise is generally symmetrical. By applying proper clustering techniques, such as k-means clustering, the calcium signal can be extracted [112]. Although the PCA-ICA algorithm is mathematically proved as an efficient classifier that shows prominent data characteristics, general calcium images contain unpredictable elements including dust, motion, and the fluorescent protein expression level. In other words, performing calcium imaging analysis using only PCA-ICA has potential limits [114], and, perhaps, proper machine-learning algorithms can solve these issues. There are some open-source calcium analysis codes written in various languages, such as MATLAB and Python.
CNMF, an unsupervised learning algorithm like PCA, has a primary pipeline based on three steps. First, input data is converted as a non-negative matrix using column rank normalization. Second, the sample is divided into consensus clusters. Third, each cluster is updated individually [113]. Efficient and accurate extraction of in vivo calcium signals from micro-endoscopic video data with CNMF_E [115] was developed based on the CNMF algorithm; however, CNMF_E was designed to overcome the poor performance originated from insufficiently designed background modeling of CNMF, and, thus, it became more suitable for neuronal cell detection acquired from various imaging methods in addition to two-photon imaging. Subsequently, other deep learning algorithms, such as MIN1PIPE, with Recurrent Neural Networks (RNN) and Long Short-Term Memory (LSTM) [114] are also widely being used for cell detection. MIN1PIPE is used for seed cleansing and detects larger cell numbers than CNMF_E. MIN1PIPE and CNMF_E—both based on well-constructed algorithms—are widely used in these days. CNMF_E can detect neurons with some true-negatives and false-positives, while MIN1PIPE catches all candidates so false-positive data can be generated. Both codes offer post-filter functions to remove incorrect signals. Additionally, there are some newer codes—as Mosaic (Inscopix), CaImAn [116], and CAVE [117]—that can be chosen or designed depending on the researchers' goals, such as minimizing false positives and maximizing automation, parameter accuracy and performance speed [118].
After cell detection and arrangement, the resulting data should undergo post-detection processing. The characteristics of neuronal calcium signals can be different for various reasons, such as the brain region studied and the fluorescent protein expression level; post-detection processing should be performed with consideration for these characteristics regarding temporal resolution and signal-to-noise ratio of calcium transient. To sort out some baseline noise and some overall sharp noises before making statistical indexes, dF/F0 [119], dynamic programming [120], temporal deconvolution [121], machine learning techniques [122] and overall or windowed high pass filter (HPF) or low pass filter (LPF) [123] could be applied. There are mainly two indexes: peak intensity and peak frequency of each cell. To find a valid peak from the signal, Kitamura et al. [11], used a spike threshold over three sigmas from each neuron's average amplitude. Cai et al. [124] used a dF/F0 threshold over 5% of the maximum intensity. Researchers can make a spike train from the selected peaks and analyze this processed data as a general spike train. CellReg [125] codes are used for tracking separate GECI video data acquired on multiple days by modeling the distribution of similarities between neighboring cells across daily video data. Fig. 3 shows an anterior cingulate cortex (ACC) brain region image using the UCLA miniscope on a mouse model processed by custom code based on MIN1PIPE [114] and CellReg [125] codes.
CONCLUSION
In this paper, we reviewed the overall properties of GECIs, from calcium ions/indicators to image analysis. GECIs enable researchers to observe cells with behavior in real time, providing many neural circuit research advantages. The development of GECIs has addressed many imaging aspects (e.g., fluorescent intensity, response time, and photobleaching) and enables the active detection of biological phenomena. As a result, GECIs are being used in various research fields including one- or two-photon imaging or portable imaging, such as microendoscopy. As the analysis methods and imaging techniques have been improved, the overall data quality has as well. Although GECIs have some limitations, GECI imaging is a promising technique for real-time cell activity research.

 XML Download