

 PDF
PDF ePub
ePub Citation
 Print
Print


INTRODUCTION
Predicting efficacious concentrations in vivo in humans using potency measured in vitro (i.e., potency parameters such as IC50, EC50, etc.) and unbound drug concentrations has been used widely at the early discovery or preclinical stages of drug development. The free drug hypothesis, which states that only unbound (free) drug molecules exert effects by binding to targets, has been dogma in pharmacology. If the free drug hypothesis is valid and potency measurements in vitro are well correlated with the in vivo effects in humans, the steady-state unbound average concentrations (Cu_ss.avg) achieved in humans by taking the approved dosage regimens should be higher than or at least comparable to the potency parameter values. For example, Smith et al. [1] reported that all of the ratios (Cu_ss.avg/in vitro potency) were > 0.5 (0.5–10) in the exemplified 16 drugs of 10 classes that they cited. In this review, these ratios were further surveyed for major therapeutic classes of drugs using published pharmacokinetic (PK) parameters, dose information in labels, and in vitro potency parameters. The ratios in 54 drug entities (13 classes) analyzed were highly variable (0.002–240) compared with the ratios reported by Smith et al.[1] (0.5–10). Although our exploration was not exhaustive, our results appear sufficient to suggest that the in vitro potency and protein binding characteristics of drugs may not always be useful to predict their efficacious dose in vivo in humans.
DATA ACQUISITION
Potency information
In vitro potency data were collected from original research articles by searching PubMed and Google Scholar for keywords related to major classes of therapeutic drugs. An example of a keyword combination used for searching is (diabetes or peroxisome proliferator-activated receptor-γ [PPAR-γ] as the therapeutic class) + (IC50, EC50, Kd, Ki, or Km for potency). Because our goal was to assess the overall trend, we did not use the exhaustive search methods required for a meta-analysis or systematic review. In the articles searched, only those that included analysis of at least two drugs in a class and published by a single laboratory were used, so that inter-laboratory or inter-method variation could be avoided. Therapeutic classes excluded from the outset were antibiotics (antibacterial and antifungal) and diuretics. This exclusion criterion was set because the therapeutic dosage regimens of most antibiotics are determined so that the parameters of exposure (area under the concentration–time curve [AUC] and maximum concentration [Cmax]) to the unbound drug are sufficiently higher than the minimal inhibitory concentration (MIC) or minimal bactericidal concentration (MBC), the parameters used to describe antibiotic potency; thus, addressing the in vitro–in vivo correlation in humans is not meaningful for antibiotics. Diuretics, whose effects are better correlated with drug concentrations in the tubular fluid rather than those in plasma were also excluded. Drugs with major active metabolites (parent drug acting as a prodrug only) or having multiple targets were also excluded because interpretation of the ratio is complicated. The potency information for traditional cytotoxic anticancer drugs was not included because published data are rare, and the dosage regimens tend to be closely related to the observed maximum tolerated doses rather than to quantitated efficacies.
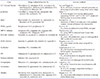
From the information obtained in these searches, the potency parameters for 54 drug entities in 13 therapeutic classes are summarized in Table 1, together with their sources and methods. The potency parameters analyzed included receptor binding (β1-blocker, PPAR-γ inhibitor, antiepileptics, etc.), enzyme activity (statins and DPP IV inhibitors), cell proliferation (BCR-ABL inhibitors), or contraction of isolated vascular strips (calcium-channel blockers [CCBs]).
Efficacious concentrations in humans
We calculated the PK exposures for the 54 drugs whose potency information was collected. The clearance (CL) was obtained from a previous report on i.v. PK parameters [2] and bioavailability (F) from a range of other sources (research articles, drug labels, or www.drugbank.ca). These parameters were used to calculate the unbound average steady-state concentration (Cu_ss.avg = fu·F·Dose/(CL·τ) = fu·AUCss/τ, Cu_ss.avg at the typical approved dosage regimens indicated on the labels, together with the unbound fraction [fu] and the dosing interval recommended on the label [τ]). Dosing information was obtained from current labels and the median or typically recommended doses were chosen. For a few drugs for which therapeutic dose AUCs had been reported in patients, we used the reported AUCs rather than the above equation to calculate the Cu_ss.avg. This information was available for erlotinib and lapatinib (epidermal growth factor receptor [EGFR] inhibitors, reported in research articles [34]), dasatinib, ponatinib, nilotinib and bosutinib (BCR-ABL inhibitors, reported in the investigators' brochure or on labels), phenytoin and carbamazepine (antiepileptics, known target concentrations available from therapeutic drug monitoring [5]).
RATIOS OF UNBOUND CONCENTRATION/POTENCY
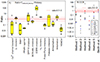
The Cu_ss.avg/potency ratios were extremely variable (about 100- to 100,000-fold differences even between drugs in the same class) despite there being trends by classes. In contrast to the general expectation (that ratios would be ≥ 1), the ratios were < 1 for 38 (69%) and < 0.1 for 22 (34%) of the 54 drugs (Fig. 1A). Even if we used the average total concentration (Ctot_ss.avg), the ratios of 17 drugs (26%) were < 1 (data not shown).
In the case of proton-pump inhibitors (PPIs), the low ratios may be explained by their irreversible binding to the proton pump, and the low ratios of statins by the fact that their target is intracellular within hepatocytes. The exposure of the hepatocytes to statins may be sufficiently high because the portal venous blood carries high concentrations of statins, which are higher than the peripheral venous concentrations, to the liver immediately after passing the intestine (first-pass effect). Thus, at the effect site (inside the hepatocyte), statin concentrations may be much higher than those in the peripheral venous blood, which in the present analysis were found to be much lower than the potency parameters. This explanation may also be applicable to other drugs that target intracellular receptors of hepatocytes.
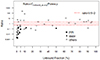
When the ratios were plotted against fu (Fig. 2), the “ratio < 1” phenomenon was distinct for drugs with high protein binding (27 of 30 [90%] drugs with fu 5% vs. 10 of 24 [42%] drugs with fu > 5%). The average ratios (unbound) of statins and CCBs were < 0.1. The finding that a ratio < 1 was most common for drugs with fu ≤ 5% (Fig. 2) implies that the accuracy of the protein-binding assay needs to be improved, especially at the upper extremes. Because 3 of the 5 statins and all of the 3 PPIs listed in this review had fu ≤ 5% (Table 1) [6789101112131415161718], their low ratios mentioned above may be also related to the low fu (Fig. 2).
IN VITRO POTENCY VARIES DEPENDING ON THE ASSAY METHOD
Because the potency measured in vitro varies according to assay methods and laboratories, the ratio for each drug reported herein may not be dependable. However, the trend observed across the 13 classes indicates that the traditional, free drug hypothesis-based approaches may be misleading when the data are obtained from in vitro studies alone without corroborating data from in vivo studies in animals or humans. An example of a study that took a similar approach to ours is the report of Smith et al. [1] concerning the effect of plasma protein binding on drug efficacy in vivo in humans [1]. In that study, unlike in ours, the ratios (Cu_ss.avg/potency) of all 16 drugs analyzed were > 0.5. Because the 16 drugs used in that study, with the exception of nifedipine and amlodipine, do not overlap with the drugs in our list, the two reports cannot be compared directly. However, one possible explanation of the differences is that the measured potency values tend to be highly variable because of the different methods used. For example, the ratios of nifedipine and amlodipine cited by Smith et al. [1] were 1.5 and 0.5, respectively. However, as indicated in Fig. 1B in our report, they were 0.44 (nifedipine) and 0.001 (amlodipine) when the IC50s for rat tail artery contraction were measured [6]. Indeed, in the same report, the ratios calculated using potency values obtained from other methods such as IC50 for rat papillary muscle contraction or Ki for rat heart muscle binding (radioligand) [6] were highly variable: 0.07–0.45 for nifedipine and 0.00005–0.05 for amlodipine. Of the several methods for measuring potency described in that article, the method of tail artery contraction (leftmost column in Fig. 1A) was chosen because it was considered to emulate most closely the situation in vivo in humans. Even when the same type of method (ligand binding assay) was used, the resulting potency values (Ki) varied by 100-fold depending on the concentrations of potassium used in their experiment (5.8 mM vs. 50 mM) as illustrated in Fig. 1B (method 4 and method 5).
WHAT CAUSES SUCH DISCREPANCIES BETWEEN IN VITRO POTENCY AND IN VIVO EFFICACIOUS CONCENTRATIONS IN HUMANS?
The causes of in vitro–in vivo discrepancies in humans can be discussed from a few viewpoints. There are many cascading steps between target occupation in vitro and measurable responses in vivo in humans. Thus, the signal initiated by the occupation of a target molecule may be amplified or reduced while passing through these cascade steps; e.g., if the signals are amplified, the effect in vivo in humans may be high despite low target occupancy (and thus low potency in vitro) unless the potency marker exists downstream of the cascade. When the target binding site is intracellular, the target occupancy will be more closely correlated with the intracellular unbound concentration. In theory, the unbound concentrations in intracellular space are influenced by the plasma unbound concentration, the proportion of the drug ionized (pKa), lipid solubility, and the presence and activity of membrane transporters. However, unless there is evidence for huge discrepancies between the intracellular and extracellular unbound drug concentrations, the existence of an intracellular target (e.g., for statins, EGFR inhibitors, and PPIs on our list) alone is not sufficient to justify the in vitro–in vivo discrepancies in humans reported here.
In vitro–in vivo discrepancies in humans may also arise from the inherent limitations of all in vitro biological studies. In vitro studies may provide clues about efficacy, but their implications should not be overemphasized. When a test is performed in vitro using a test molecule and another known competitor drug that acts on the same target, the results may give some indication as to the relative potency of the test molecule that can be used for decision-making. However, if the test molecule acts on a novel target for which no known drug exists, in vitro results alone for the test molecule should not be used when making critical decisions about prediction of efficacious concentrations in humans.
CONCLUSION
Because, as shown in Fig. 1, discrepancies between the potency in vitro and effects in vivo in humans are so widespread, caution is needed in the interpretation of data obtained in vitro; all the in vitro methods currently used for assaying potency should be regarded as ancillary screening tools that cannot be used to infer the in vivo effects in humans dependably. Predicting efficacious unbound concentrations in vivo in humans using potency data obtained in vitro is not a reasonable approach, particularly for molecules with high protein binding (fu < 5%). The fate of candidates should not be determined by the fu and potency data from in vitro studies alone, before comparing their effects in animal models in vivo. These observed discrepancies may not be new to experienced researchers working in the areas of drug discovery or early preclinical development. However, to our knowledge, the existence of in vitro–in vivo discrepancies in humans or their implications have never been properly addressed. Therefore, this review is the first to raise the issue of this discrepancy and its relationship to plasma protein binding and the caveats associated with it.
 XML Download