

 PDF
PDF ePub
ePub Citation
 Print
Print


INTRODUCTION
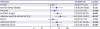 | Figure 1Predictors of adverse LV remodeling in the REMODELING trial.18)AUC = area under the curve; CI = confidence interval; CK = creatine kinase; hs-CRP = high sensitivity C-reactive protein; LV = left ventricular; LVEDVI = left ventricular end-diastolic volume index; LVESVI = left ventricular end-systolic volume index; OR = odds ratio; PRU = P2Y12 reaction units; REMODELING = role of platelet reactivity in left ventricular remodeling after ST-segment elevation myocardial infarction.
|
METHODS
Study hypotheses and objectives
Study design
Trial status
Study population and randomization
Table 1
Inclusion and exclusion criteria
![]()
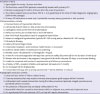
 | Figure 2Flow diagram of the HEALING-AMI trial.AF = atrial fibrillation; HEALING-AMI = high platelet inhibition with ticagrelor to improve left ventricular remodeling in patients with ST-segment elevation myocardial infarction; hs-CRP = high-sensitivity C-reactive protein; IRA = infarct related artery; LBBB = left bundle branch block; MI = myocardial infarction; NT-proBNP = N-terminal prohormone B-type natriuretic peptide; OAC = oral anticoagulant; PCI = percutaneous coronary intervention; STEMI = ST-segment elevation myocardial infarction; TIMI = thrombolysis in myocardial infarction; 3D = three-dimensional.
|
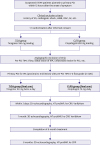
 | Figure 3Schedule of measurement.AE = adverse event; CK-MB = creatine kinase-MB; CRP = high-sensitivity C-reactive protein; ECG = electrocardiography; hs-CRP = high-sensitivity C-reactive protein; MACE = major adverse cardiovascular event; MRI = magnetic resonance imaging; NT-proBNP = N-terminal prohormone B-type natriuretic peptide; NYHA = New York Heart Association; SAE = serious adverse event; 3D = three-dimensional.
|
Adjunctive pharmacological therapy and PCI procedure
Study endpoints
1. Prevalence of pathologic LV remodeling (a relative >20% increase in end-diastolic volume seen at 6-month follow-up compared with the baseline during admission);
2. The changes of LV end-systolic/end-diastolic volume indices (mL/m2) and LV ejection fraction (%) between the baseline and 6-month follow-up.
Prespecified subgroup studies
Cardiac magnetic resonance imaging substudy
1. LV ejection fraction (%), LV end-diastolic and end-systolic volume (mL) at 6 months, comparing acute phase magnetic resonance imaging (MRI);
2. Infarct size (grams and percentage of total LV mass) at 6 months and acute phase MRI;
3. Area-at-risk (AAR, grams and percentage of total LV mass) at 6 months and acute phase MRI.
Substudy of platelet-immune interaction
1. The count of CD14++CD16+CCR2+ monocyte-platelet aggregates;
2. The count of CD14++CD16−CCR2+ monocyte-platelet aggregates;
3. The count of CD14++CD16+CCR2+ monocyte subset;
4. The count of CD14++CD16−CCR2+ monocyte subset;
5. The level of inflammatory biomarkers (nuclear factor κB, IL-1β, IL-6, IL-10, and monocyte chemoattractant protein-1).
Other prespecified studies
1. Inflammatory indicators: hs-CRP, neutrophil-lymphocyte ratio, platelet-lymphocyte ratio, and fibrinogen;
2. Angiographic perfusion indicators: TIMI flow grades, myocardial blush grades and corrected TIMI frame count;
3. ECG indicators; degree of ST-segment resolution (%), prevalence of complete ST-segment resolution (>70%) (%);
4. Platelet function test: VerifyNow P2Y12 assay (PRU, BASE);
5. Vascular function test: pulse wave velocity, EndoPAT, IIEF-5 questionnaire;
6. Safety endpoint: Platelet Inhibition and Patient Outcomes (PLATO) or Bleeding Academic Research Consortium (BARC) bleeding criteria.
Data collection and statistical considerations
Data collection and monitoring
Sample size calculations
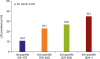 | Figure 4Incidence of adverse LV remodeling according to distribution of platelet reactivity (PRU measured by VerifyNow test).18)LV = left ventricular; LVR = left ventricular remodeling; PRU = P2Y12 reaction units.
|
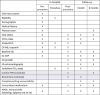
Table 2
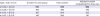
Quartiles for each group from the original data

| Group_1 | p_0 | p_5 | p_10 | p_15 | p_20 | p_80 | p_85 | p_90 | p_95 | p_100 |
|---|---|---|---|---|---|---|---|---|---|---|
| 1 | −109.9 | −50 | −37.7 | −30.5 | −22.9 | 12.1 | 14.3 | 21.55 | 28.9 | 59.4 |
| 2 | −109.9 | −52.1 | −40.8 | −36.7 | −26.9 | 10.8 | 12.4 | 20 | 29.9 | 33.6 |
![]()
Table 3
Sample sizes calculated for several scenarios using the truncated data
![]()
 XML Download