

 PDF
PDF ePub
ePub Citation
 Print
Print


INTRODUCTION
Geographical difference in health status is a public health concern, which has become an important ethical and policy issue.1 Regional differences in health in Korea have been examined between rural and urban areas23 or in areas with different levels of deprivation.45 Due to the concentration of economic, social, cultural, and healthcare resources in the capital city Seoul in Korea, differences between Seoul and other parts of Korea, in terms of wide range of indicators for well-being, have been suggested.678
Seoul and Busan are the two largest cities in Korea. Although Seoul is considered to be wealthier than Busan according to indicators such as the per capita gross regional domestic product, the two cities share similar total fertility rate, unemployment rate, and healthcare resources (Supplementary Table 1, only online).9 One important difference between the two cities is that life expectancy (LE) in Busan is shorter compared to Seoul. Prior investigations revealed worse indicators related to mortality levels in Busan compared to Seoul.510 As shown in Supplementary Table 2 (only online), more than 2-year shortfalls have been recorded in Busan compared to Seoul between 2005 and 2017.11 The pattern held true for men and women. LE in Busan has also been lower than among the total Korean population since 2005, with a nearly 1-year disadvantage compared to the total Korean population observed among men and women in Busan (Supplementary Table 2, only online). According to data from the Korea Statistical Information Service on provincial LEs, Busan, along with South Gyeongsang province and North Chungcheong province, recorded the lowest LE in 2017 among 17 provinces in Korea.11
Such low LE in Busan has regularly drawn media attention.121314151617 Since Statistics Korea has released LE information at the provincial level, the unexpectedly low LE in Busan has been highlighted in newspapers, especially in Busan.13141517 For example, in 2012, Busan-ilbo, a major newspaper in Busan, dealt with the health status of Busan and public health infrastructure in a series of 20 articles.17 In the media, several factors have been suggested as the causes of low LE and high mortality in Busan, including unhealthy lifestyles,12 low income and air pollution,15 high prevalence of chronic diseases,13 and poor regional public healthcare system.1617
One approach to deciphering the causes of lower LE in Busan is to decompose the age- and cause-specific contributions to the LE disadvantage in Busan. Such decomposition allows us to quantify the magnitude of the contributions made by each age group and cause of death leading to the LE difference between Seoul and Busan. Based on such quantifications, meaningful information on risk factors associated with age at death and causes of death might be obtained. Therefore, this study was conducted to decompose age- and cause-specific contributions to the LE difference between Seoul and Busan.
MATERIALS AND METHODS
Data
This study was approved by the Seoul National University Hospital Institutional Review Board (IRB No. E-1810-008-975). We only used publicly available secondary data without any personal identifiers. We obtained population and mortality data for Seoul and Busan between 2015 and 2017 from Statistics Korea. Population and mortality data included the numbers of mid-year population and deaths according to sex and age groups (0, 1–4, 5–9, 10–14, …, 80–84, ≥85). A total of 29442594 subjects and 129509 deaths were analyzed for Seoul, while 10392063 subjects and 63310 deaths were examined for Busan (Supplementary Table 3, only online). Considering the small numbers of deaths among the 1–4, 5–9, and 10–15 age groups, 3-year data were combined to examine LE and age-specific contributions to the LE gap between Seoul and Busan. Mortality data were also aggregated by causes of death, which were coded according to the International Classification of Diseases, 10th Revision (ICD-10).
Statistical analysis
We calculated LE at birth for men and women in Seoul and Busan, constructing life tables using 5-year probabilities of death (Table 1). We applied Arriaga's decomposition method to the life table data to estimate age- and cause-specific contributions to the LE difference between Seoul and Busan.1819 The results of LE decomposition according to different methods were found to be similar.20 Prior Korean studies used this method to examine age- and cause-specific contributions to LE differences by calendar year,21 sex,22 education,23 income,2425 and country.26 This decomposition method estimates the contribution of mortality differences in each age group and cause of death to the total difference in LE at birth. The sum of the cause-specific contributions to the difference in LE for a given age is equal to the total contribution for that age group, and the total differences in LE between Seoul and Busan were considered to be the sum of age- and cause-specific components. In this study, positive age-specific and cause-specific contributions referred to absolute-year contributions (e.g., 0.4 years) to the LE difference between Seoul and Busan (i.e. LE in Seoul minus LE in Busan) due to the higher mortality rates in Busan across age groups and causes of death compared to Seoul. Negative contributions referred to the reverse pattern. We presented the 5-year age group-specific contributions to the LE gap between Busan and Seoul in Fig. 1 and Supplementary Table 4 (only online). Regarding the cause-specific contributions, we first categorized causes of death into 15 broad groups (Fig. 2 and Supplementary Table 5, only online). Then, we also examined cause-specific contributions to the LE gap according to 60 detailed causes (Fig. 3 and Supplementary Table 6, only online). The classification schemes were based on previous report.27
RESULTS
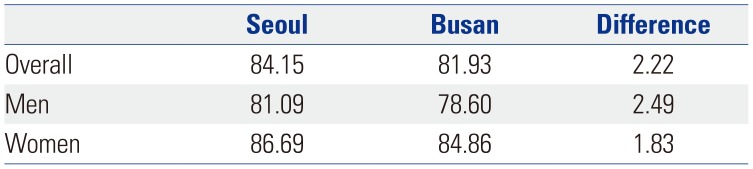
Table 1 presents LE at birth by sex for the years 2015–2017 combined in Busan and Seoul. In men, Seoul had a greater LE compared to Busan by 2.49 years. The LE gap in women was slightly smaller than that in men (a 1.83-year difference). Overall, Busan citizens had shorter LE than Seoul citizens by 2.22 years.
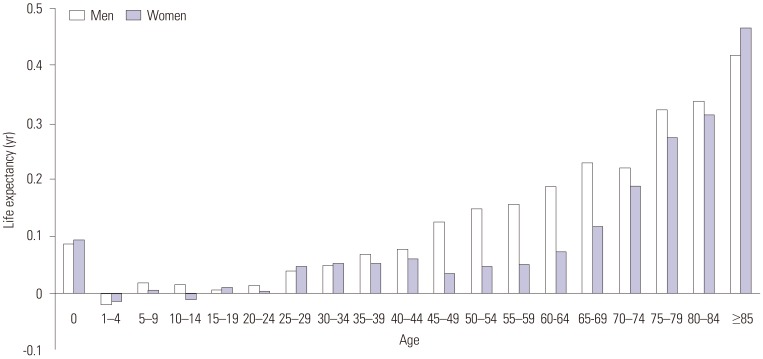
Fig. 1 and Supplementary Table 4 (only online) show age-specific contributions to the LE difference between Busan and Seoul due to excess mortality in Busan. Except for ages 1–4, all age groups positively contributed to the LE gap between Seoul and Busan among men and women combined (Supplementary Table 4, only online). In women, due to the small numbers of deaths among ages 1–4 (n=11), 5–9 (n=13), and 10–14 (n=6) in Busan, unstable patterns in age-specific contributions were noticed. Fig. 1 also shows increasing age-specific contributions with age, especially in men. The contribution made by elderly people aged ≥65 was 1.47 years, accounting for 66.2% of the total LE gap (2.22 years) in men and women combined. The corresponding figures for men and women were 1.53 years in men (61.4% of the total LE gap in men) and 1.35 years in women (73.7% of the total LE gap in women). In men and women, the largest age-specific contribution was made by the ≥85 age group: 0.48 years in men and women combined, 0.42 years in men, and 0.47 years in women. This contribution by the ≥85 age group accounted for 21.5% of the total LE gap between Seoul and Busan in men and women combined, 16.8% in men, and 25.4% in women.
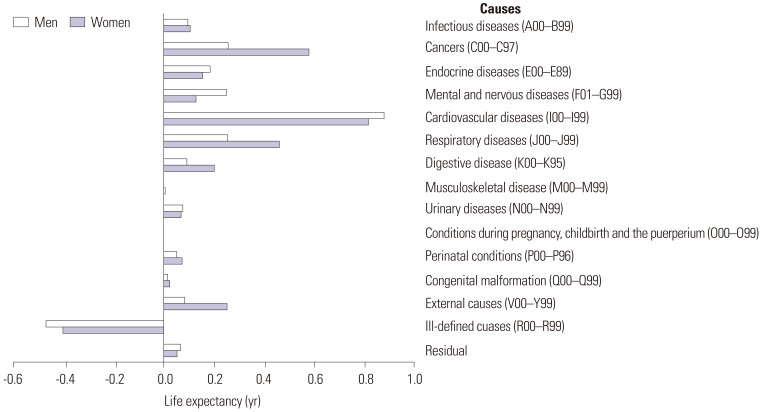
Fig. 2 and Supplementary Table 5 (only online) present 15 broad cause-specific contributions to the LE difference. Of the 15 broad causes of death, positive contributions to the LE gap were found for 14 causes among men and women, with the exception of ill-defined causes (ICD-10 code: R00–R99). The largest positive contribution was made by cardiovascular diseases (I00–I99) in both men and women: 0.94 years in men and women combined, 0.81 years in men, and 0.88 years in women. This contribution by cardiovascular diseases accounted for 42.1% of the total LE gap between Seoul and Busan in men and women combined, 32.7% in men, and 48.0% in women. In men, contributions by cancers (C00–C97), respiratory diseases (J00–J99), and external causes (V00–Y99) were especially significant. These four broad causes (cardiovascular diseases, cancer, respiratory diseases, and external causes) together contributed positively to 2.10 years (94.3%) of the LE gap in men. In women, in addition to cardiovascular diseases, significant contributors to the LE gap included cancers, endocrine diseases (E00–E89), mental and nervous diseases (F01–G99), and respiratory diseases. Meanwhile, contributions by musculoskeletal disease (M00–M99), conditions during pregnancy, childbirth and puerperium (O00–O99), and congenital malformations (Q00–Q99) were minimal in both men and women.
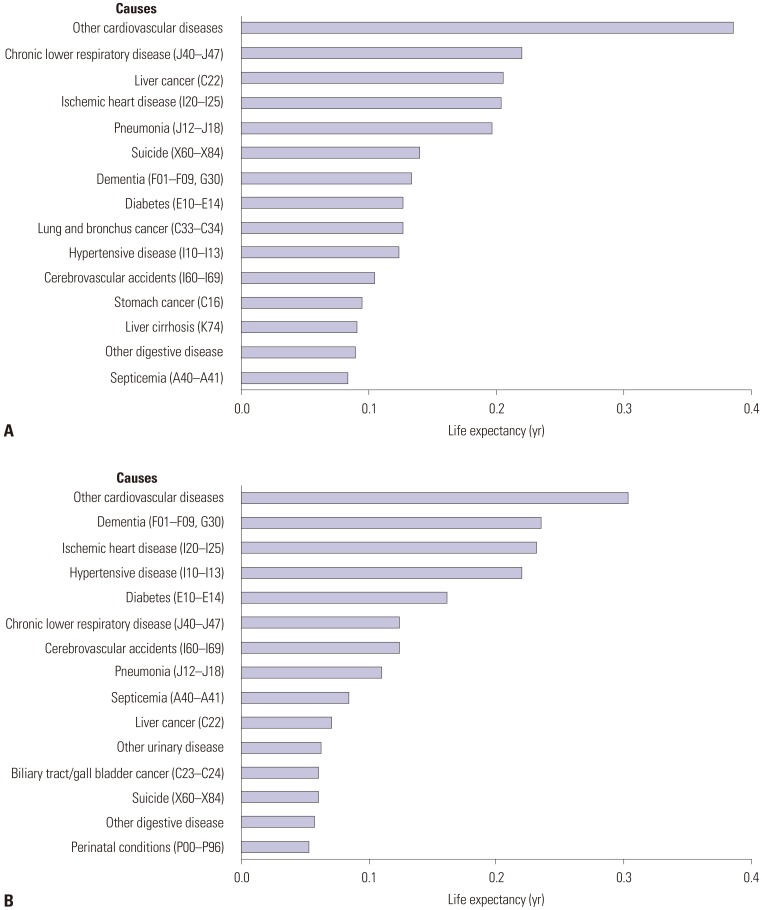
Fig. 3 shows cause-specific contributions to the LE gap between Seoul and Busan for the top 15 leading causes in terms of the absolute magnitude of the contribution, which was derived from an analysis of cause-specific contributions to the LE gap according to 60 detailed causes of death (Supplementary Table 6, only online). Combined contributions of the top 15 causes to the LE gap were 2.31 years in men and 1.95 years in women, corresponding to 93.0% of total LE gap in men and 106.4% of the total LE gap in women. The cause of death that contributed most to the LE gap was other cardiovascular diseases in both men and women. However, differences were found between men and women in the ranking of causes of death contributing to the LE gap. In men, chronic lower respiratory disease (J40–J47) and liver disease (C22) were relatively important, while dementia (F01–F09, G30) and hypertensive diseases (I10–I13) were among the top causes in women. Lung and bronchus cancer (C33–C34), stomach cancer (C16), and liver cirrhosis (K74) were among the top 15 causes only in men, while other urinary diseases, biliary tract/gall bladder cancer (C23–C24), and perinatal conditions (P00–P96) were among the top 15 causes only in women.
DISCUSSION
The results of this study indicated that LE for the years 2015–2017 in Busan was shorter compared to Seoul by 2.22 years. The magnitude of this disadvantage in Busan is considerable. Given that a 4.5-year increase in LE was achieved in the 12-year period between 2005 and 2017 among the entire Korean population (Supplementary Table 2, only online), the 2.22-year difference in LE between Seoul and Busan corresponds to roughly a 6-calendar-year difference in LE in Korea. In addition, according to the data from the Korea Statistical Information Service, a 3.78-year gain in LE would be expected in 2017 if all cancer deaths were eliminated in Korea.28 A 2.22-year gain in LE would be anticipated when deaths from stomach cancer, liver cancer, colon cancer, and lung cancer were eliminated from the Korean population in 2017.28
This study also showed that roughly two-thirds of the LE gap between Seoul and Busan was due to excess mortality among elderly people in Busan. The ≥85 age group alone contributed to 20% of the LE gap, while no meaningful contributions were made by the 1–24 age groups. These results highlight the importance of excess mortality among the elderly, especially among the oldest age group in Busan. Prior LE decomposition studies in Korea on the increase in LE with time,21 socioeconomic inequalities in LE,25 and gender inequality in LE22 showed that major differences in LE were caused by mortality differences among middle-aged adults and the early elderly population. Contributions of the oldest old were not large in those studies.212225 Several explanations for these discrepancies should be considered. Healthcare services and end-of-life care for the elder population and the oldest old should be examined. Differences in public attitudes toward deaths among the oldest old should also be explored. In addition, the possibility of selective migration prior to death (i.e., moving to Busan at the end of one's life) and the effect of adverse experiences accumulated throughout the life course29 should be also considered.
The results of our analysis of broad cause-specific contributions revealed that over 40% of the LE gap between Seoul and Busan was due to excess mortality from cardiovascular diseases in Busan, especially among those aged ≥65 (Supplementary Table 7, only online). Some of this contribution might have been due to higher prevalence rates of unhealthy behaviors in Busan, including current smoking, alcohol consumption, high-risk alcohol use, and not engaging in walking as physical activity, compared to Seoul.30 Contribution of cardiovascular diseases was more prominent in women. The high level of cardiovascular mortality in Busan compared to other provinces has been suggested to be an explanation of the high overall mortality rate in Busan.513 However, no previous study has quantified the extent of contribution of cardiovascular disease to the LE gap between Seoul and Busan. In men, among broad causes, cancers, respiratory diseases, and external causes played an important role in explaining the high mortality rate in Busan.
This study also identified 15 leading specific causes of death that contributed most to the LE difference between Seoul and Busan. These 15 leading causes of death explained nearly all of the LE gap between Seoul and Busan (93.0% in men and 106.4% in women). Our calculation also showed that the 10 leading causes explained 74.6% of the LE gap in men and 90.5% of the LE gap in women, respectively. These results suggest the possibility of reducing the LE gap by addressing excess mortality from each leading cause of death in Busan. In both men and women, other cardiovascular diseases, ischemic heart disease, hypertensive disease, and cerebrovascular accidents were among the 15 leading causes of death contributing to the LE gap, which again highlights the importance of cardiovascular disease in explaining the LE disadvantage in Busan compared with Seoul.513 In contrast to the findings in women, in men, chronic lower respiratory disease and liver disease were the second and third causes of death, respectively, and lung and bronchus cancer, stomach cancer, and liver cirrhosis were among the 15 leading causes of death contributing to the LE gap in men. Cigarette smoking,31 alcohol consumption,32
Clonorchis sinensis infection,3334 and hepatitis B and C infections3536 should be considered as explanations for these findings among men in Busan.
This study was limited in its ability to provide more direct information on the cause of the LE disadvantage in Busan compared to Seoul. However, the results of this age- and cause-specific analysis may guide further explorations of downstream causes (e.g., health-related behaviors, occurrence and treatment of chronic diseases, or access to medical treatment) of the LE disadvantage. In addition, our quantification of the contribution of each age group and cause to the LE gap could be an important item to consider in planning strategies to reduce the age- and cause-specific mortality rate in Busan.
In conclusion, this study quantified age- and cause-specific contributions to the LE difference between Seoul and Busan. The 2.22-year difference in LE for the years 2015–2017 between Seoul and Busan was mainly due to excess mortality in the elderly population and from cardiovascular diseases. Those aged ≥65 accounted for two-thirds of the LE gap, while over 40% of the LE gap was due to cardiovascular diseases. The top 15 leading specific causes of deaths explained nearly all of the LE gap between Seoul and Busan. Information on age- and cause-specific contributions to the LE difference between Seoul and Busan may guide health policy-makers in planning strategies to reduce the gap in LE. This study shows that the mortality disparity between Busan (second largest metropolitan city in Korea) and Seoul (capital city) exist in almost all age groups. Typically, regional health disparities have tended to be explained in the frame of the gap between urban and rural areas. However, especially in the Korean context, the gap between capital and non-capital regions is also important as well as between urban and rural areas.
 XML Download