

 PDF
PDF ePub
ePub Citation
 Print
Print


INTRODUCTION
Type 1 diabetes mellitus (T1D) occurs as a result of autoimmune destruction of beta cells in the pancreas, leading to a loss of insulin production and hyperglycemia.1 The causes of T1D are not completely clear and may be genetic or environmental, such as viral infection or exposure to toxic chemicals.2 Women who are positive for auto-antibodies, such as antibodies to insulin, glutamic acid decarboxylase, protein tyrosine phosphatase, and others, are at high risk of developing T1D.3 Poorly controlled T1D can have severe effects on female reproductive health, including low fertility, hypogonadism through impairment of the hypothalamic-pituitary-ovarian (HPO) axis, miscarriage, and congenital malformation. Female mouse models of T1D show hypogonadism, reduced ovary size, and decreased oocyte quality.45 Within the ovarian follicle, T1D mice show impaired granulosa cell-oocyte communication, mitochondrial dysfunction during meiosis, apoptosis of cumulus cells, and alteration of DNA methylation status.6789 Nevertheless, the mechanisms underlying these effects of diabetes on reproduction are not completely understood.
Most studies of the reproductive effects of T1D have used a single animal model, either a genetic- or chemical-induced model of T1D. The AKITA mouse expresses an autosomal dominant mutation on chromosome 7 that leads to a cysteine to tyrosine change and misfolding of the insulin 2 protein.10 This induces abnormal activation of the unfolded protein response, which causes endoplasmic reticulum (ER) stress and apoptosis of pancreatic beta cells.1112 Streptozotocin (STZ) is a toxic glucose analogue that accumulates in pancreatic beta cells through glucose transporter-2 and causes selective cell death.1314 Injections of high doses of STZ are used to chemically induce T1D in mice. In both genetic and chemically induced mouse models of T1D, the destruction of pancreatic beta cells leads to hypoinsulinemia and the inability to regulate blood glucose.
To shed light on the underlying mechanisms driving impaired fertility in women with T1D, we sought to compare the effects of T1D on a comprehensive set of female ovarian functional endpoints—from follicle growth to oocyte maturation to embryo development—in two mouse models. We hypothesized that T1D caused by either a genetic mutation (AKITA model) or an environmental factor (STZ-induced model) would affect ovarian physiology.
MATERIALS AND METHODS
Animals
The use of mouse models of T1D in this study was approved by the Institutional Animal Care and Use Committee (IACUC) of Northwestern University (IS00000442). All procedures were carried out under an IACUC-approved protocol. Animals were housed in a temperature- and light-controlled environment (14h light: 10h dark) and provided with food and water ad libitum. Animals were fed Teklad Global irradiated 2919 chow, which does not contain soybean or alfalfa meal and contains minimal phytoestrogens as described in a previous paper.15 Heterozygous AKITA male (003548, The Jackson Laboratory, Bar Harbor, ME, USA) and wild type C57BL/6J female (000664, The Jackson Laboratory, Bar Harbor, ME, USA) mice were bred, and the offspring were genotyped to confirm AKITA heterozygosity. For the STZ model of T1D, wild-type C57BL/6J mice were administered 190 mg/kg of STZ (S0130-1G, MilliporeSigma, Burlington, MA, USA) at 2 weeks after weaning.9 Blood glucose levels were measured by a blood glucose and ketone monitoring system (98814-65, Abbott, Chicago, IL, USA) 4 days after injection to confirm whether T1D was completely induced. Mice with blood glucose levels higher than 1.67 mM (300 mg/dL) were considered to have induced T1D (Fig. 1).16 Three weeks after the blood glucose check, the body weights of control, AKITA, and STZ-injected mice were measured. A total of 150 mice [wild-type C57BL/6J (n=50), AKITA (n=50), and STZ-injected mice (n=50)] were used in this study.
We did not use homozygous AKITA mice because they rarely survive beyond 12 weeks of age without insulin treatment.17 Although homozygous AKITA mice may be more relevant to human T1D, the homozygous AKITA mouse was not ideal for evaluating ovarian functional endpoints due to their early mortality.
Genotyping
Genomic DNA (gDNA) was extracted from tail tips and used for PCR. We followed Jackson Laboratory's protocol for genotyping. A set of primers (forward: 5'-TGCTGATGCCCTGGC CTGCT-3', reverse: 5'-TGGTCCCACATATTGCACATG-3') was used to amplify the gDNA. PCR was performed according to the manufacturer's instructions (K0171, Thermo Fisher Scientific, Waltham, MA, USA) and was followed by digestion with the restriction enzyme Fnu4HI (R0178, New England Biolabs, Ipswich, MA, USA) at 37℃ overnight. PCR products of 140 base pairs (bp) and 280 bp indicated the presence of the wild-type allele and AKITA mutant allele, respectively.10
Ovarian morphology and immunoblot analysis
Ovary size was compared in control, AKITA, and STZ-injected mice by gross observation. Follicle number and growth was assessed based on immunoblot analysis of anti-Mullerian hormone (AMH), follicle-stimulating hormone receptor (FSHR), and luteinizing hormone/chorionic gonadotropin receptor (LHCGR), which are exclusively expressed in granulosa cells and theca cells of ovarian follicles. Ovarian tissues from each group were homogenized according to a previous report,18 and total protein was collected for immunoblot analysis. Primary antibodies were rabbit anti-AMH (PA5-35851, Thermo Fisher Scientific, Waltham, MA, USA; 1:2000), anti-FSHR (PA5-50963, Thermo Fisher Scientific, Waltham, MA, USA; 1:2000), and anti-LHCGR (SC-25828, Santa Cruz Biotechnologies, Dallas, TX, USA; 1:2000), and mouse anti-alpha-tubulin (T9026, MilliporeSigma, Burlington, MA, USA; 1:5000). Secondary antibodies were horseradish peroxidase (HRP)-conjugated goat anti-rabbit or anti-mouse (65-6120, 65-6520, Thermo Fisher Scientific, Waltham, MA, USA; 1:5000). A sample of 20 µg of total protein was separated by SDS-PAGE (NP0335 BOX, Thermo Fisher Scientific, Waltham, MA, USA) at 150 V for 2 hr and then transferred to a polyvinylidene difluoride membrane (IB23002, Thermo Fisher Scientific, Waltham, MA, USA). The membranes were then blocked at room temperature for 1 hr and incubated with primary antibodies at 4℃ overnight. Membranes were then washed three times and incubated with secondary antibodies at room temperature for 1 hr. The blots were developed with Luminata Crescendo Western HRP substrate (WBLU0500, MilliporeSigma, Burlington, MA, USA). Images were captured by Azure C500 (Azure C500, Azure Biosystems, Dublin, CA, USA).
Histological and immunohistochemical analysis of ovarian tissue
Three weeks after a single STZ injection, control, AKITA, and STZ-injected mice underwent gonadotropin hyperstimulation and the ovaries were collected. The mean number of corpora lutea (CLs) was counted on the surface of whole ovaries. The ovaries were then fixed with 4% paraformaldehyde (PFA) and embedded in paraffin wax, then serially sectioned at 5 µm thickness. Ovarian tissues were stained with hematoxylin and eosin (H&E, Merck, Kenilworth, NJ, USA) for histological analysis. For immunofluorescence, the paraffin sections were incubated with anti-AMH (sc-6886, Santa Cruz Biotechnology, Dallas, TX, USA; 1:100), anti-estrogen receptor-beta (ER-beta, sc-6821, Santa Cruz Biotechnology, Dallas, TX, USA; 1:50), Ki-67 (652401, BioLegend, San Diego, CA, USA; 1:50), and anti-MSY2 (a gift from Dr. Richard Schultz, University of Pennsylvania, 1:4000) antibodies. Alexa Fluor 488 donkey anti-rabbit IgG (H+L) was used as the secondary antibody.19 To counterstain the nucleus, the slides were mounted with DAPI [2-(4-amidinophenyl)-1H-indole-6-carboxamidine, Vector Laboratories, Burlingame, CA, USA] mounting solution.
Hormone stimulation and evaluation of oocyte quantity
Eight-week-old female mice were hormonally primed by intraperitoneal injection of 5 IU equine chorionic gonadotropin (367222, equine chorionic gonadotropin, MilliporeSigma, Burlington, MA, USA) and then 5 IU human chorionic gonadotropin (hCG) (CG10-1VL, MilliporeSigma, Burlington, MA, USA) 48 hr later. At 16 hr after hCG administration, metaphase II oocytes were collected from the oviduct to assess oocyte quality. The number and stage of oocytes retrieved after superovulation was determined to evaluate in vivo folliculogenesis and oocyte maturation in control, AKITA, and STZ-injected mice.
Serum hormone ELISA
After hormonal stimulation to induce superovulation, whole blood was collected and the serum separated by centrifugation at 3000 RPM for 30 min. ELISAs for insulin (EZRMI-13K, Calbiochem, San Diego, CA, USA), AMH (MBS2507173, MyBioSource, San Diego, CA, USA), 17 beta-estradiol (E2, ES180S, Calbiochem, San Diego, CA, USA), testosterone (T, TE187S, Calbiochem, San Diego, CA, USA), and progesterone (P4, PG129S, Calbiochem, San Diego, CA, USA) were performed to compare levels of each hormone between control, AKITA, and STZ-injected mice.
Immunofluorescence of oocyte structures after superovulation
Meiotic spindle formation and the distribution of cortical granules were investigated to determine oocyte quality. To detect the intra-oocyte meiotic spindle, chromosomal alignment, and cortical granules, metaphase II oocytes retrieved from control, AKITA, and STZ-injected mice were denuded by treating with 85 IU/mL hyaluronidase (H4272, MilliporeSigma, Burlington, MA, USA) and then immediately fixed with 4% PFA (15710, Electron Microscopy Sciences, Hatfield, PA, USA). Following fixation, the oocytes were permeabilized by treating with 0.1% Triton X-100 (X100, MilliporeSigma, Burlington, MA, USA) in phosphate-buffered saline (14190-250, Thermo Fisher Scientific, Waltham, MA, USA) and then blocked with 3% BSA in PBS (A0281, Thermo Fisher Scientific, Waltham, MA, USA) at room temperature for 1 hr. Oocytes were then incubated with rabbit anti-α-tubulin antibody (5063S, Cell Signaling Technology, Danvers, MA, USA; 1:100) at 4℃ overnight to detect the meiotic spindle. To localize cortical granules, oocytes were incubated with rhodamine-conjugated Lens Culinaris Agglutinin (RL-1042, LCA, Vector Laboratories, Burlingame, CA, USA; 1:100) at room temperature for 1 hr. After staining, the oocytes were mounted with 4’,6-diamidino-2-phenylindole mounting solution (H-1200, Vector Laboratories, Burlingame, CA, USA) and then examined under a TCS SP5 confocal microscope (SP5, Leica, Wetzlar, Germany). Oocytes with barrel-shaped bipolar spindles, well-organized microtubule fibers, and tightly aligned chromosomes on the metaphase plate were scored as normal. All other configurations were considered abnormal.2021
Measurement of mitochondrial function (Δψm) and mtDNA
Following oocyte denudation with 0.1% bovine testes hyaluronidase (MilliporeSigma, Burlington, MA, USA), metaphase II oocytes were stained with JC-1 dye (T3168, Thermo Fisher Scientific, Waltham, MA, USA) at 37℃ for 30 min. Oocytes were then transferred into a mineral oil-covered Leibovitz-15 medium (11415-114, Thermo Fisher Scientific, Waltham, MA, USA) and green/red fluorescence was captured by confocal microscopy to evaluate high (green) and low (red) mitochondrial membrane potential of the metaphase II oocytes, as described in previous studies.2223
Mitochondrial DNA from individual metaphase II oocytes was isolated, and the copy number was determined as described previously by Dr. Robker's group.24 Briefly, oocytes isolated from wild-type control, AKITA, and STZ-injected mice were washed with 0.1% polyvinylpyrrolidone (PVP) (P5288, MilliporeSigma, Burlington, MA, USA) in PBS and then transferred into 5 µL of 0.1% PVP in PBS. Carrier RNA (1 µg) was then added into each sample, and the DNA was isolated using the QIAamp DNA Micro Kit (56304, Qiagen, Venlo, Netherlands) according to the manufacturer's instructions. DNA copy number (mtDNA) was eluted with 50 µL of distilled water and used for quantitative PCR. A standard curve for absolute quantification of copy number was generated based on 101 to 107 copies, kindly provided by Dr. Robker's group. The primers used for PCR were 5'-CGTTAGGTCAAGGTGTAGCC-3' and 5'-CCAGACACACTTTCCAGTATG-3'. All experiments were carried out at least three times. The mtDNA copy number in individual oocytes was determined by comparing the calculated cycle threshold value against the corresponding standard curve as described in previous studies.2526
Live cell fluorescence measurement of calcium
Intracellular calcium [(Ca2+)i] measurement in activated oocytes was performed as previously described.2527 (Ca2+)i was measured using the Ca2+ sensitive dye Fura-2-acetoxymethyl ester (F1221, Fura 2-AM, Thermo Fisher Scientific, Waltham, MA, USA). Oocytes were monitored simultaneously using an inverted Nikon Eclipse Ti microscope (Eclipse Ti, Nikon, Shinagawa, Tokyo, Japan) outfitted with fluorescence measurement capabilities. Ionomycin stock (I9657, MilliporeSigma, Burlington, MA, USA) solution was introduced into the imaging drop 1 min after the start of monitoring. The Fura 2-AM dye was stimulated between 340 nm and 380 nm by a filter wheel (Lambda 10-3, Sutter Instrument, Novato, CA, USA), and fluorescence was captured every 4 sec. Emitted light was collected by a CoolSnapES2 CCD camera (Photometrics, Tucson, AZ, USA). Fluorescence ratios were analyzed by ImageJ (Bethesda, MD, USA).
In vitro fertilization
In vitro fertilization (IVF) was carried out using cumulus-oocyte complexes (COCs) containing metaphase II oocytes from 8-week-old wild-type control, AKITA, and STZ-injected mice. Epididymal spermatozoa were collected from wild-type mice and capacitated to ensure penetration and fertilization of the metaphase II oocytes. For capacitation, the collected spermatozoa were incubated in 0.4% bovine serum albumin containing EmbryoMax® human tubal fluid (HTF) (MR-070-D, MilliporeSigma, Burlington, MA, USA) at 37℃, 100% humidity, and 5% CO2 atmosphere. COCs were isolated from the ampulla region of the oviduct and pre-incubated in HTF medium. Following capacitation, approximately 1 to 2×10⁶ fully capacitated motile spermatozoa were incubated with COCs for 4 hr. The fertilized oocytes were then isolated and transferred into a potassium simplex optimized medium (EmbryoMax® KSOM Medium, MR-121-D, MilliporeSigma, Burlington, MA, USA) for 5 days at 37℃ in 5% CO2. Cleavage (% of two-cell embryos/oocytes fertilized) and blastocyst formation rate (% of blastocyst/oocytes fertilized) were then measured as markers of embryonic developmental competence.27
Blastomere TUNEL staining
Five days after IVF, blastocysts from wild-type control, AKITA, and STZ-injected mice were immediately fixed with 4% PFA and then washed three times with 0.1% PVP. The blastocysts were then incubated with 0.1% Triton X-100 in PBS at room temperature for 30 min. To visualize blastomere apoptotic status, blastocysts were treated with an incubation buffer containing equilibration buffer, nucleotide mix, and rTdT enzyme (G3250, Promega, Madison, WI, USA) at 37℃ for 1 hr. Blastocysts were mounted with DAPI-containing mounting solution. The apoptotic and total blastomere numbers were measured by Z-stack confocal microscopy.28
Statistical analysis
Data were analyzed by either Chi-square test (oocyte maturation, spindle normality, and embryonic development after IVF) or one-way ANOVA (body weight, blood glucose, hormone measurements, number of oocytes retrieved after superovulation, number of CL, and apoptotic and total blastomeres) using SPSS ver. 12.0 (SPSS Inc., Chicago, IL, USA) or GraphPad Prism 5.0 (GraphPad Software, San Diego, CA, USA). Tukey's multiple comparison was used as a post-hoc test. Values were considered statistically significantly different at p<0.05.
RESULTS
Characteristics of T1D mouse models
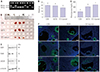
Fig. 1A shows the PCR-based confirmation of ins2 mutant heterozygosity in the AKITA mouse model of T1D (presence of both 140 bp and 280 bp Fnu4HI digestion products). STZ-injected mice had elevated blood glucose and significantly lower body weight compared with wild-type control mice. While the heterozygous AKITA mice also showed higher blood glucose levels, body weights were comparable between AKITA and wild-type control mice (Fig. 1B and C, p<0.05).
The HPO axis is impaired by STZ treatment in mice
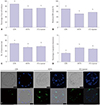
To investigate the effect of diabetes on female reproductive tissues, ovaries from 8-week-old control, AKITA, and STZ-injected mice were harvested (Fig. 1D). Ovary size was not significantly different in control and AKITA mice, whereas ovaries from STZ-injected mice were substantially smaller 3 weeks after injection. To assess the function of granulosa and theca cells in ovarian follicles in the three groups of mice, we examined protein expression levels of AMH, FSHR, and LHCGR. Consistent with the smaller ovary size, STZ-injected ovaries had relatively low expression levels of AMH, FSHR, and LHCGR protein (Fig. 1E, left; control, middle; AKITA, and right; STZ-injected). Immunofluorescence showed uneven expression of AMH in antral follicles in the ovaries of AKITA mice, while it was uniformly expressed in granulosa cells of growing follicles (primary, secondary, and multilayered secondary follicles).16 Furthermore, the expression of ER, a granulosa cell marker, was barely detectable in the granulosa cells of antral follicles from AKITA and STZ-injected mice, while high expression levels of Ki-67 were detected in proliferating granulosa cells in all three groups (Fig. 1F). This suggests that hyperglycemia affects the expression patterns and levels of ovarian proteins in the diabetes mouse models.
Ovarian histology and the quantity and quality of oocytes following ovarian hyperstimulation are affected by T1D in mice
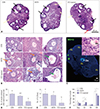
The ovaries in all three groups of mice contained growing follicles at all stages and antral follicles. All mice responded to stimulation with exogenous gonadotropin (Fig. 2A). Although STZ-injected mice had smaller ovaries compared with control and AKITA mice, follicle growth was stimulated by exogenous gonadotropins. Ovarian histology revealed antral follicle stages (black arrows) and CLs (yellow arrows), although the ovaries of STZ-injected mice contained CL with “trapped” oocytes (red arrow), suggesting impairment of the ovulation process (Fig. 2A). Interestingly, Fig. 2B shows a normal structure of ovary while, we observed abnormal morphology of COCs, such as pyknotic nuclei in granulosa cells in AKITA mice (inset, Fig. 2B) and disconnection of oocytes and granulosa cells in both AKITA and STZ-injected mice (Fig. 2B). To confirm that oocytes were “trapped” in CLs in STZ-injected mice, we conducted an immunofluorescence assay with MSY2, an oocyte-specific marker; a positive green signal indicated oocytes of growing follicles. Oocytes trapped in the CL, even after exogenous hCG stimulation, appeared only in STZ-injected mice. Trapped and ruptured oocytes showed diffuse MSY2 signals, in contrast to strong signals in growing follicles (Fig. 2C). In addition, STZ-injected mice produced significantly fewer metaphase II oocytes following hormonal stimulation compared with control mice (Fig. 2D), with significantly fewer CLs in STZ-injected mice (Fig. 2E). Oocyte maturation to the metaphase II stage after hCG treatment was less frequent in oocytes collected from AKITA and STZ-injected mice compared to control mice (Fig. 2F).
T1D mice show variations in hormonal response to exogenous hormone stimulation
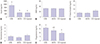
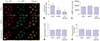
As expected, both AKITA and STZ-injected mouse models of T1D showed dramatically decreased serum insulin levels at 8 weeks of age (Fig. 3A, p<0.05). Serum AMH, 17-beta-estradiol (E2), and testosterone (T) levels following exogenous hormone stimulation and superovulation were comparable between control mice and the T1D mice (Figs. 3B–D). Serum progesterone levels were lower in STZ-injected mice than in control mice (Fig. 3E). This indicated that growing follicles in diabetic mice could be stimulated by exogenous hormone priming.
TID mice have abnormal meiotic spindle formation in metaphase II oocytes
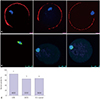
Fig. 4A shows the distribution of cortical granules (red) and DNA (blue) in metaphase II oocytes collected from control, AKITA, and STZ-injected mice. Representative images of oocytes with localization of the meiotic spindle with tubulin staining (green) and DNA with DAPI (blue) are shown in Fig. 4B. Abnormal oocyte spindle formation was observed more frequently in oocytes from the T1D mouse models compared to oocytes from control mice (Fig. 4C).
T1D affects mitochondrial membrane potential and DNA copy number in metaphase II oocytes
Fig. 5A shows JC-1 staining of the mitochondrial membrane potentials associated with oocyte quality. Red and green dots, respectively, indicate high and low mitochondrial membrane potentials in the metaphase II oocytes. Metaphase II oocytes from both T1D mouse models showed a significantly lower mitochondrial membrane potential compared with metaphase II oocytes from control mice (Fig. 5B). However, mtDNA copy number was comparable across all three mouse groups, as shown in Fig. 5C. Intracellular calcium release in activated oocytes was also comparable between control and T1D mice (Figs. 5D and E)
T1D mice have reduced embryonic developmental competence of metaphase II oocytes
In vitro fertilized oocytes from both AKITA and STZ-injected mice showed significantly impaired developmental competencies. Compared to control mice, fewer fertilized eggs obtained from T1D mice underwent cleavage at 24 hr (Fig. 6A) and reached the blastocyst stage by 120 hr (Fig. 6B). In addition, the number of blastomeres per blastocyst was significantly lower in T1D mice compared to controls (Fig. 6C), and fertilized oocytes retrieved from T1D mice also contained a higher number of apoptotic blastomeres than fertilized oocytes from control mice (Fig. 6D). Fig. 6E shows a representative image of terminal deoxynucleotidyl transferase dUTP nick end-labeling (TUNEL) and DAPI staining of a blastocyst following IVF.
DISCUSSION
In this study, we compared various markers of ovarian function, from ovarian health and oocyte quality to embryo developmental competence, between wild-type mice and two different mouse models of T1D (AKITA and STZ-induced). We found that, compared to wild-type control and AKITA mice, STZ-induced T1D mice showed more severe impairment of LHCGR signaling-associated events, including luteinization, oocyte maturation, and serum progesterone production. Metaphase II oocytes from both T1D mouse models showed impaired spindle formation, lower mitochondrial membrane potential, and lower developmental competence after IVF compared with oocytes from wild-type mice.
Though the severity of T1D in various animal models might differ, only a few studies have compared AKITA and STZ-injected mouse models in relation to function in the ovary.9293031 We found that mice injected with STZ showed a more severe hyperglycemic condition and lower body weight than the AKITA mice, which may underlie the observed differences in reproductive endpoints between the two models.
Previous studies have described the development of hypogonadism as a complication of T1D.293031 According to our data, AKITA mice did not show evidence of hypogonadism compared to wild-type controls, despite the presence of hypoinsulinemia and hyperglycemia. Schoeller, et al.3031 similarly described no difference in testis size between male heterozygous AKITA and wild-type control mice. In contrast, we observed that mice with T1D induced by STZ showed markedly reduced ovary size compared to controls, with lower levels of FSHR and LHCGR expression. The previous study by Schoeller, et al.3031 found that homozygous AKITA male mice, which have a more severe phenotype with lower serum insulin compared to heterozygous AKITA male mice, also showed more severe hypogonadism and reductions in serum LH. This suggests that the severity of T1D may determine the impact of the disease on the HPO axis, particularly LHCGR signaling, in diabetic mice.
Interestingly, the function of the HPO axis could be partially restored by exogenous gonadotropin in STZ-injected mice. The ovaries from both T1D mouse models contained all stages of growing, pre-ovulatory follicles and CLs, as well as normal E2 and T levels, comparable to wild-type controls. Johnson and Sidman32 showed normal sensitivity of target organs to gonadotropin and sex hormones in female T1D mice. Schoeller, et al.30 also reported no significant difference in serum FSH levels between wild-type control and AKITA mice. Taken together with our findings, this suggests that the FSH responsiveness of growing follicles is preserved in T1D mice. Conversely, Schoeller, et al.3031 found that serum LH levels were lower in both heterozygous and homozygous AKITA mice, and brainspecific knockout of the insulin receptor impaired spermatogenesis by reducing circulating LH. We found that STZ-induced T1D mice had a markedly decreased number of ovulated oocytes and CLs after hormonal stimulation, a reduced level of serum progesterone, and impaired oocyte maturation. Based on these findings, we conclude that poorly controlled, severe T1D might lead to impairment of later stages of folliculogenesis and oocyte maturation, which are strongly associated with LHCGR signaling, through a decrease in circulating LH and LHCGR expression, rather than changes in FSH.
Studies documenting oocyte quality in AKITA and STZ-injected T1D mice have been conducted by the Moley group.92630313334 In 2005, they found that T1D mice exhibit delayed germinal vesicle breakdown after hCG treatment and reduced connexin-43 expression in cumulus-enclosed oocytes.6 Oocytes from female T1D mice showed evidence of altered mitochondrial ultrastructure, mtDNA copy number, and adenosine triphosphate (ATP) and tricarboxylic acid (TCA) cycle metabolites due to mitochondrial metabolic dysfunction.93334 In addition, female T1D mice had a greater frequency of oocyte spindle or chromosomal misalignment leading to aneuploidy. Finally, they showed that T1D disrupted crosstalk between the oocyte and cumulus cells by inducing mitochondrial impairment in cumulus cells.9 Similar to their studies, we found significantly increased spindle abnormalities in both AKITA and STZ-injected T1D mice; however, there was no difference in cortical granule distribution in T1D mice compared to control, which had not been investigated previously in metaphase II oocytes. Some research groups previously demonstrated that T1D mice exhibit abnormal, dynamic changes in the ER, granulosa cell apoptosis, abnormal energy metabolism, and mitochondrial dysfunction in oocytes.6933 Recent papers have described that cortical granules can change the structure of zona pellucida3536 and can cause low fertility in diabetic mice. In this regard, we analyzed cortical granules in oocytes retrieved from both healthy and diabetic mice. We found a reduced mitochondrial membrane potential in both T1D mouse models compared to controls, but no change in mitochondrial DNA copy number. Wai, et al.37 demonstrated that oocytes with as few as 4000 copies of mtDNA can be fertilized and develop to the blastocyst stage, and that only 40000–50000 copies of mtDNA are required to permit fetal development. As there was no significant difference in mtDNA copy number in metaphase II oocytes between the T1D and wild-type control groups, it is likely that oocytes from either T1D model possess the potential to develop into a fetus.
Zhang, et al.38 demonstrated that T1D mice develop abnormal dynamic changes in the ER during oocyte maturation and early embryo development. We expected that the T1D-related abnormal distribution of ER would have a deleterious impact on calcium physiology during activation of the metaphase II oocyte. However, the amplitude and duration of calcium fluctuations after ionomycin-derived egg activation were comparable between control and both T1D mouse models. Thus, ER function, not ER distribution, appears to have been preserved in our T1D mouse models.
Finally, we found that T1D decreases pre-implantation embryonic development and promotes blastomere apoptosis 120 hr after IVF. Alterations in microorganelles, function, physiology, and ATP levels in metaphase II oocytes may mediate the detrimental effects of T1D on developmental competence after IVF. Moley, et al.39 found that pre-implantation embryos from diabetic mice exhibit a shift in glucose transporter 1-3 (GLUT 1-3) utilization. Additionally, Chi, et al.40 described a decline in GLUT 1 utilization, which may promote blastomere apoptosis at the blastocyst stage. Thus, our observation of an increase in total and apoptotic blastomeres in T1D mice may be related to impairment of glucose uptake and metabolism in pre-implantation embryos.
Collectively, we found that the STZ-induced mouse model of T1D, which developed more severe hyperglycemia compared to the AKITA mouse model, showed greater impairment of LHCGR signaling-related events, including ovulation, oocyte maturation, and luteinization, and pre-implantation embryonic development. Both T1D mouse models showed significantly decreased oocyte and pre-implantation embryo quality. Our study is limited in that it compared only two T1D mouse models and that exogenous insulin treatment was not used to examine factors underlying differences in reproductive function between the models. Future mechanistic studies of the effects of T1D on reproductive function may provide additional insights that may improve reproductive outcomes in women with T1D.
 XML Download