

 PDF
PDF Citation
 Print
Print


Abbreviations
APC
Ag presenting cell
CBA
cytometric bead array
CCR
C-C chemokine receptor type
CRD
carbohydrate-recognition domain
FSC
forward scatter
GI
gastrointestinal
MMP
matrix metalloproteinase
MyD88
myeloid differentiation primary response 88
PVDF
polyvinylidene fluoride
SSC
side scatter
TIR
toll/IL-1 receptor
INTRODUCTION
As a type of animal lectin, galectins have consensus amino acid sequences which can bind to β-galactoside, such as N-acetyllactosamine (12). Fifteen subtypes of galectins have been identified in mammals to date, and it is known that at least 12 galectins exist in humans. All galectins share the conserved carbohydrate-recognition domains (CRDs) comprising 130 amino acids with an affinity for β-galactoside sugars (2).
Galectins exert their biological functions by interacting with the glycans on cell surfaces and extracellular matrices. While some galectins, such as galectin-1 (Gal-1) and Gal-3, show a wide expression pattern across various types of tissues, others exhibit more tissue-specific expressions (3). The expression of galectins is modulated by the differentiation and development status of tissues and cells. Thus, the expression of galectins can be affected by various physiological or pathological factors (45). For the past decade, the roles played by galectins as the immune cell regulator have been focused upon, and it has been revealed that galectins can regulate physiological processes of cells, such as cell activation, proliferation, and apoptosis (6).
Gal-4 is a tandem repeat-type galectin which is composed of 2 different CRDs connected by a single peptide chain. Although both domains have conserved galectin-signature amino acids, only 40% of their sequences are identical (7). Each domain has an affinity to lactose similar to that of other tandem repeat-type galectins, but their binding preferences for other disaccharides and polysaccharides are quite different. Thus, Gal-4 has natural cross-linking properties (89) and has been identified as an adherent junction protein in porcine oral epithelial cells (910). Intriguingly, Gal-4 is predominantly and highly expressed within the gastrointestinal (GI) tract in the non-disease status. Owing to its selective expression, Gal-4 has been expected to play specific roles within the GI tract (1112). The Gal-4 expression level was dramatically reduced in colorectal cancer tissues compared to normal tissues, which coincided with enhanced cell proliferation, migration, and motility (13). With regard to mucosal immune system regulation, the contradictory role of Gal-4 in the intestines was reported to either exacerbate or ameliorate inflammation. Hokama et al. (14) revealed that Gal-4 induces the activation of CD4+ T cells of mice with colitis to produce the inflammatory cytokine IL-6, which contributes to the colitis pathogenesis. However, Paclik et al. (15) demonstrated that Gal-4 reduces intestinal inflammation by inducing selective apoptosis of peripheral and mucosal T cells. In the abovementioned studies, T cells were the only immune cell population that was the target of inspection. Thus, the effect of Gal-4 on other immune cells is a subject of ongoing studies, and still a lot of information about Gal-4 remains to be explored.
In this study, we revealed the potential effects of Gal-4 on monocyte activation and differentiation, showed that CD14 is a novel receptor for Gal-4, and identified the subsequent signaling pathway that mediates the immunoregulatory functions of Gal-4 in monocytes.
MATERIALS AND METHODS
Purification of PBMCs and monocytes
Whole blood samples were obtained from healthy human volunteers who were free of prescribed and over-the-counter medication. This study was approved by the Seoul National University Hospital Institutional Review Board (Approval number: C0904022277). The PBMCs were isolated using Ficoll-Paque PLUS (GE Healthcare Bio-Sciences AB, Uppsala, Sweden) as previously described. CD14+ monocytes were isolated from the PBMCs either by negative selection using MACS system (Miltenyi Biotech, Bergisch Gladbach, Germany) according to the manufacturer's protocol, or by the plastic adherence method.
Western blot analysis
Human Gal-4 was purchased from R&D Systems (Minneapolis, MN, USA). The endotoxin level of Gal-4 was <0.1 EU per 1 μg of protein determined by the Limulus Amebocyte Lysate method. Monocytes were stimulated with Gal-4 for different periods of time and lysed with a lysis buffer from Mammalian Protein Prep Kit (Qiagen, Valencia, CA, USA) in the presence of a protease and phosphatase inhibitor (Sigma-Aldrich, St. Louis, MO, USA). The monocyte lysates were centrifuged at 12,000g for 15 min. Proteins (20–30 μg) were heated at 100°C for 10 min in SDS sample buffer, separated by SDS-PAGE, and transferred from the gel to polyvinylidene fluoride (PVDF) membranes (Bio-Rad Laboratories, Hercules, CA, USA). Following Abs: anti-ERK, anti-JNK, anti-p38, anti phopsho-ERK, anti phopsho-JNK, anti phopsho-p38,(all from Cell Signaling Technology Inc., Danvers, MA, USA), anti-matrix metalloproteinase (MMP) 2 (Santa Cruz biotechnology, Dallas, TX, USA) and anti-GAPDH (Abcam, Cambridge, MA, USA) were used for detection, and HRP-conjugated secondary Abs purchased from the Jackson Laboratory (Bar Harbor, ME, USA) and Santa Cruz Biotechnology were used for the development of reactions with a chemiluminescent detection system (Pierce Chemical, Dallas, TX, USA).
Cytokine profile analysis using cytometric bead array (CBA) system
Cytokine concentrations were measured using the CBA assay (BD Pharmingen, San Diego, CA, USA) according to the manufacturer's protocol. The results of CBA assay were acquired by FACSCanto II (BD Biosciences, Heidelberg, Germany) and analyzed by BD CBA software.
Measurements of cytokine production using ELISA
Supernatants were collected from monocytes which had been stimulated with various concentrations of Gal-4 or LPS for 24 h or 48 h. The concentrations of IL-1β or IL-12 in the culture supernatants were determined with ELISA kits (both from eBioscience Inc., San Diego, CA, USA) according to the manufacturer's instructions. Absorbance at 450 nm was measured by a PerkinElmer Plate Reader (PerkinElmer, Waltham, MA, USA).
Confocal microscopy
Purified human monocytes were incubated with FITC-labeled Gal-4 on poly L-lysine-coated coverslips for 1 h on ice. Then, the coverslips were incubated at 37°C for 5 min and subsequently fixed with 2% paraformaldehyde. Cells were washed with PBS, mounted on slides with Anti-fade mounting media (Vectorlab, Burlingame, CA, USA) and dried at room temperature for overnight in the dark. The result was viewed on Fluoview laser scanning confocal microscope (Olympus America, Inc., Melville, NY, USA), and the images were processed with Fluoview imaging analysis software (Olympus America, Inc.).
Flow cytometry analysis
Cells were stained for flow cytometry analysis in PBS containing 1% BSA with the following Abs purchased from BD Biosciences and eBiosciences: anti-human CD14-PE-cy7, CD80-FITC, CD86-PE, CD40-APC, C-C chemokine receptor type 1 (CCR1)-FITC, CCR2-PE, CCR5-PE, CXCR4-APC, TLR1-FITC, TLR4-APC, TLR6-PE, CD11b-FITC, CD64-FITC, CD68-FITC, CD205-FITC, and CD209-FITC.
For active caspase-3 analysis, cells were fixed and permeabilized using Cytofix/Cytoperm Plus kit (BD Biosciences) and stained with anti-active caspase-3 Abs (BD Biosciences) according to the manufacturer's instructions. For apoptotic cell analysis, the cells were stained with FITC-conjugated annexin V and analyzed according to the manufacturer's instructions (Molecular Probes, Eugene, OR, USA). Data were acquired on LSR II (BD Biosciences) or FACSCanto II cytometer and analyzed with FlowJo software (Tree Star Inc., Ashland, OR, USA).
Co-immunoprecipitation
Human monocytes (2×10⁶) were allowed to bind with Gal-4 (10 µg/ml) for 30 min at 4°C, and then Gal-4 cross-linkage to the cognate cell surface receptors was induced using non-membrane-permeable cross linker 3,3′-dithiobis sulfosuccinimidyl propionate. Cells were lysed in 200 μl of cold NP-40 lysis buffer with the Protease Inhibitor Cocktail (Sigma-Aldrich). Lysates were centrifuged at 12,000 g for 15 min. Supernatants (total 80 μg protein) were incubated overnight at 4°C with goat anti-human Gal-4 Ab (2 μg). Immune complexes were precipitated with Protein G–agarose beads (Sigma-Aldrich). Immunoprecipitated proteins were separated by 10% SDS-PAGE and transferred onto the PVDF membranes. CD14, TLR2, TLR6, and Gal-4 were detected by incubation with the corresponding Abs (1 µg/ml or 1:1,000 dilution, respectively). Chemiluminescent signals were detected using Super Signal ECL kit (Thermo Fisher Scientific, Rockford, IL, USA).
Phagocytosis assay
Lectin-mediated endocytosis was examined after the co-incubation of phagocytes (5×10⁵) with 500 µg/ml of FITC-Dextran (Sigma-Aldrich, MW 40000) for 30 min at 37 °C within RPMI1640 culture medium (GE Healthcare Life Sciences, Logan, UT, USA). To assess the phagocytosis of necrotic cells, Jurkat cells were fluorescently labeled with CFSE (Molecular Probes, Leiden, the Netherlands) according to the manufacturer's instructions. Then, the labeled cells (1×10⁵) were co-cultured with Gal-4- or LPS-treated monocytes at 1:1 ratio for different time periods at 37°C or 4°C within 250 μl of RPMI1640 in round-bottom glass tubes. Subsequently, the stained cells were analyzed using FACSCanto II cytometer.
RESULTS
Gal-4 prevented the apoptosis of monocytes without affecting their proliferation
Since the recognition of Gal-1 induced T cell apoptosis, numerous reports of galectin-induced apoptosis have been published (16) and Gal-4 has been found to promote the apoptosis of T cells in a calpain-dependent manner (15). To investigate the immunoregulatory role of Gal-4, we first checked if Gal-4 affects either the apoptosis or proliferation of human PBMCs. Interestingly, the percentage of CD14+ monocytes in the PBMC population increased after the 24-h culture with Gal-4 (data not shown). To account for this increase, we looked at the Gal-4's effects on apoptosis and proliferation of monocytes. As shown in Fig. 1A, Gal-4 reduced the active-caspase-3 level and simultaneously decreased the apoptosis of CD14+ cells. As for the proliferation, the proliferation of Gal-4-treated monocytes was not significantly different from that of untreated control (Fig. 1B). Together, these data suggested that Gal-4 promoted the survival of monocytes rather than their proliferation.
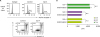 | Figure 1Effects of Gal-4 on apoptosis and proliferation of monocytes. (A) Human monocytes (5×10⁵) were treated with 10 µg/ml of Gal-4. After 24 h, the intracellular levels of active caspase-3 were analyzed by flow cytometry. Cell apoptosis was evaluated by staining with FITC-conjugated annexin V and PI. Data are representative results of 3 independent experiments. (B) Human monocytes (1×10⁵) were incubated with [3H] thymidine in the absence or presence of Gal-4 (10 µg/ml). At 24, 48, or 72 h post-treatment, [3H] thymidine incorporation was evaluated. Data are shown as mean ± standard deviation of 3 independent experiments. N.S, not significant.
|
Gal-4 altered the phenotypic characteristics of monocytes
To evaluate the influence of Gal-4 on the immunological phenotype of monocytes, we scrutinized various cell surface markers of Gal-4-treated monocytes. Interestingly, the expression of each chemokine receptor was differently modulated by Gal-4. As shown in Fig. 2A, CCR1 and CCR5 expressions were increased in Gal-4-treated monocytes, whereas CCR2 and CXCR4 levels were decreased.
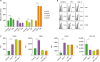 | Figure 2Immunophenotypic characteristics of Gal-4-treated monocytes. (A-C) Human PBMCs were treated with Gal-4 (10 µg/ml) or LPS (1 µg/ml) for 24 h. (A) Expression levels of CCR1, CCR2, CXCR4, and CCR5 on CD14+ monocytes were analyzed by flow cytometry. (B) Expression levels of TLR1, TLR2, and TLR4 on the CD14+ monocytes were analyzed by flow cytometry. (C) Bars show expression levels of CD80, CD86, CD40, and HLA-DR on CD14+ monocytes. (A, C) Each value is mean±standard deviation of 3 independent experiments. (B) Data are representative results of 3 independent experiments.
*p<0.05; **p<0.01.
|
In the case of TLR expression, TLR1, 4, and 6 expressions of monocytes were significantly increased by Gal-4 treatment (Fig. 2B). TLR2, which is known to be abundantly expressed on monocytes, showed slightly increased expression by Gal-4 (data not shown). Moreover, like LPS treated monocytes, Gal-4-treated monocytes showed increased CD40, CD80 levels and decreased MHC II level compared to the untreated control (Fig. 2C). However, unlike LPS, which could not increase CD86 expression, Gal-4 increased the CD86 expression (Fig. 2C). CD80 and CD86 are expressed predominantly on APCs and bind to CD28 on T cells. The higher affinity-binding of CD86 to CD28 is critical for the initiation of T cell responses, whereas the lower affinity-binding of CD80 to CD28 is essential for the amplification of T cell response (1718). Thus, Gal-4 stimulation may generate distinct monocyte populations which have different T cell activation capacity compared to LPS-stimulated monocytes.
Collectively, these data showed that Gal-4 could modulate the immunophenotype of monocytes by changing the expression patterns of cell surface molecules.
Gal-4 modulated the function of monocytes and induced their differentiation
In the above experiments, we showed that Gal-4 could induce the phenotypic change of monocytes. We next examined the functional properties of Gal-4-treated monocytes. As indicated in Fig. 3A, significantly higher levels of IL-6, IL-10, and TNF-α were detected in the supernatant of Gal-4-treated monocytes. However, the extent of increased cytokine level was less than that of the LPS-treated control, and unlike LPS treatment, Gal-4 treatment did not enhance the production of IL-1β and IL-12 (Fig. 3A and B). Increased production IL-6 in CD14+ cells was observed after 3 h of Gal-4 treatment (Supplementary Fig. 1) with the minimal effective concentration of 1.25 µg/ml (Supplementary Fig. 2). This increase depended on the interactions between Gal-4 and the glycans on the monocyte surfaces because Gal-4's effect on IL-6 production was decreased by lactose treatment in a dose-dependent manner (Supplementary Fig. 3).
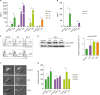 | Figure 3Functional and morphological changes in Gal-4-treated monocytes. (A, B) Human monocytes (1×10⁵) were treated with Gal-4 (10 μg/ ml) or LPS (1 μg/ml) for 24 h. Culture supernatant was harvested and assayed for TNF-α, IL-6, and IL-10 by CBA, and IL-12 and IL-1β by ELISA. (C) Human monocytes (5×10⁵) were treated with Gal-4 (10 µg/ml) or LPS (1 µg/ml) for 48 h. Phagocytic ability of monocytes was determined as described in materials and methods. (D) Western blot analysis for active MMP-2 in Gal-4-treated (10 µg/ml) monocytes. (E) Western blot result for active MMP2 normalized to GAPDH. (F) Laser confocal microscopy of a section through the center of human monocytes incubated with Gal-4 for 48 h. Scale bar represents 10 μm. (G) Human PBMCs were treated with Gal-4 (10 μg/ml) or LPS (1 μg/ml) for 24 h. Flow cytometry analysis for the expression of the monocyte/macrophage markers was performed. (A, B, E, G) The values are mean±standard deviation from 3 independent experiments. (C, D, F) Data are representative results of 3 independent experiments. MFI, mean fluorescence intensity.
*p<0.05.
|
We next quantified the phagocytic capacity of the Gal-4-treated monocytes since the phagocytic ability of macrophages and monocytes is critical for the defense against pathogens. As shown in Fig. 3C, Gal-4-treated monocytes had lower phagocytic capacity compared to the untreated or LPS-treated control. Specifically, the uptake of dextran beads was reduced from 28% to 7% in Gal-4-treated cells, and the phagocytic ability against necrotic cells was reduced approximately 2-fold compared with the LPS-treated group (Fig. 3C).
In general, MMP expression is increased significantly as blood monocytes differentiate into monocyte-derived macrophages (19). To better understand the effect of Gal-4, expression of active MMP-2 in Gal-4-stimulated monocytes was analyzed. As shown in Fig. 3D and E, active-MMP-2 activity was increased in Gal-4-treated cells, whereas pro-MMP-2 level was consistent in all samples (data not shown). To confirm the effects of Gal-4 on the monocyte differentiation, we observed morphological changes of monocytes at 48 h after Gal-4-treatment by confocal microscopy. As shown in Fig. 3F, monocytes differentiated into macrophage-like cells in the presence of Gal-4. Because monocytes can give rise to either macrophages or dendritic cells, we performed a detailed analysis with their specific cell markers. As shown in Fig. 3G, Gal-4 treatment significantly increased each macrophage cell marker, especially CD64, but did not increase the dendritic cell markers (Supplementary Fig. 4). On the basis of these results, we concluded that Gal-4 affected various functions of monocytes and induced the differentiation of monocytes into macrophages-like cells.
Gal-4 bound to CD14 and activated the MAPK signaling pathway in monocytes
To better understand the pathways involved in Gal-4 function, we decided to find its cognate receptor on the surface of monocytes. We expected that Gal-4 would bind to receptors that were possibly expressed abundantly or specifically on monocytes because Gal-4 dramatically increased the cytokine production in monocytes (Fig. 3A) but not in T cells (data not shown). TLRs exist abundantly on the surface and intracellular sites of monocytes and the recognition of pathogen-associated molecules by TLR promotes various innate immune responses (20). CD14 is a surface protein preferentially expressed on monocytes and macrophages and acts as a co-receptor for either TLR4 or MD-2 for the detection of bacterial LPS. Thus, we investigated whether Gal-4 could bind to TLRs or CD14 on monocytes by using co-immunoprecipitation and western blot analysis. As shown in Fig. 4A, Gal-4 strongly interacted with CD14 but not with TLR 2, 4, and 6, on monocytes.
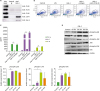 | Figure 4Activation of MAPK signaling pathway after engagement of Gal-4 with CD14. (A) Interaction of Gal-4 and CD14 was analyzed by co-immunoprecipitation and western blot as described in materials and methods. (B, C) 2×10⁵ human PBMCs were treated with Gal-4 (10 µg/ml) or LPS (1 µg/ml). To confirm the interaction of CD14 with Gal-4, cells were pretreated with anti-CD14 neutralizing Ab (10 µg/ml) or isotype control Ab (10 µg/ml) for 1 h before Gal-4 treatment. After 24 h, flow cytometry was performed and the monocyte cell subset was gated using FSC and SSC properties. (C) Cytokine production was estimated by CBA after 24-h Gal-4 treatment. The experiment was performed with 3 donor PBMCs, and triplicate data from a single donor is presented as representative data. Error bars indicate SD. (D) Human monocytes were treated with 10 µg/ml of Gal-4 for the indicated time periods. Representative western blots demonstrating phosphorylated ERK, p38, and JNK and total p38, JNK, and ERK. (E) The expression levels of phospho-p38, phospho-JNK, and phospho-ERK were normalized using total p38, JNK, and ERK. Data are representative results of 3 independent experiments.
*p<0.05; **p<0.01.
|
We further scrutinized the interaction of Gal-4 with CD14 by using anti-CD14 neutralizing Ab. In accordance with the immunoprecipitation results, anti-CD14 blocking Ab diminished the granularity of Gal-4 treated monocytes and dramatically reduced the cytokine production both in Gal-4-treated monocytes and PBMCs (Fig. 4B and C, Supplementary Fig. 5). The activation of the CD14/TLR4 signaling pathway recruits toll/IL-1 receptor (TIR) domain-containing adaptors and initiates downstream inflammatory cascades (2122) such as cytokine production. One of the critical TIR domain adaptor proteins, myeloid differentiation primary response 88 (MyD88), activates NF-κB and MAPK system comprised of the ERKs, JNK, and the p38 MAPK (22). To identify the signaling cascade induced by Gal-4, we investigated whether MyD88 was involved in the Gal-4-induced monocyte stimulation. Gal-4 significantly increased the expression of macrophage marker Ly6C in PBMCs from wild-type mice but not from MyD88-deficient mice (Supplementary Fig. 6). To further dissect the molecular biological pathway induced by Gal-4 treatment, phosphorylation of p38, ERK, and JNK in monocytes were assessed by western blotting at various time points after Gal-4 treatment. As expected from the previous results, Gal-4 treatment increased the phosphorylation of p38, JNK, ERK (Fig. 4D and E). Therefore, these results indicated that CD14 is a receptor for Gal-4, and TLR4-mediated MAPK signaling cascades are involved in the monocyte-regulatory functions of Gal-4.
DISCUSSION
During recent decades, intensive studies revealed the role of galectins in cancer, infection, inflammation, and development. Although a few studies have shown that Gal-4 interacts with CD4+ T cells under inflammatory conditions, little is known about its receptors and downstream effects in other types of immune cells. In this study, we identified the role of Gal-4 in modulating monocyte physiology. Gal-4 enhanced the survival of CD14+ monocytes by reducing the active caspase-3 level and apoptosis (Fig. 1A). To date, other galectins such as Gal-7, Gal-8, and Gal-12 have been shown to be pro-apoptotic, whereas Gal-3 functioned as an anti-apoptotic factor (232425).
Although Gal-4 was not a chemoattractant itself (data not shown), it was intriguing that it altered the expression pattern of chemokine receptors, and thus it may modulate the migration ability of monocytes. Similar to LPS, Gal-4 enhanced the expression of costimulatory molecules and TLRs on monocytes, whereas it decreased the HLA-DR expression (Fig. 2B). Although Gal-4 had some similar effects to LPS on monocytes, its effects depended on the interaction with glycans since Gal-4's effects were diminished by lactose treatment in a dose-dependent manner (Supplementary Fig. 3)
In addition to the phenotypic changes, Gal-4 induced the functional changes of monocytes. Gal-4-treated monocytes showed unique cytokine production patterns and phagocytic capacity. Moreover, a microscopic observation confirmed that these cells became flattened with extensive pseudopodia similar to the macrophages (Fig. 3E). Interestingly, Gal-4-treated monocytes showed a significant increase of CD64 (Fcγ receptor I) expression. Based on this result, we speculate that Gal-4-induced macrophage-like cells may have specialized functions in Ab-mediated phagocytosis and the clearance of immune complexes.
Although we could not entirely identify the glycoproteins that interacted with Gal-4, we found that CD14 is a critical Gal-4 receptor which mediated monocyte activation because blocking CD14-Gal-4 interaction by neutralizing Ab almost completely blocked the cytokine production by monocytes. Binding of Gal-4 to CD14 resulted in the activation of p38 and NF-κB, which was similar to the response of LPS interaction with CD14 or TLR4 (26). Even though Gal-4 could bind to CD14 as LPS could, its effects on the cytokine production and surface molecule expression were not exactly the same. To understand this more deeply, the exact binding affinity and the binding site of Gal-4 to CD14 will have to be identified.
The intestine is the largest reservoir of macrophages (27) and intestinal macrophages play a central role in the regulation of immune responses against commensal and pathogenic bacteria. However, typical human intestinal macrophages do not express innate immune receptors, including the LPS receptor (CD14). Moreover, intestinal resident macrophages do not produce pro-inflammatory cytokines such as IL-1, IL-6, IL-12, and regulated on activation, normal t cell expressed and secreted (RANTES), but still retain the avid phagocytic and bactericidal activities (28). Intriguingly, Gal-4-induced macrophage-like cells exhibited the opposite characteristics as to the intestinal resident macrophages. Therefore, it is possible that the abnormal up-regulation, exposure, or secretion of Gal-4 under pathogenic conditions may result in the imbalance of gut homeostasis by affecting monocyte activation and differentiation. Actually, Gal-4 was not detected in the lamina propria of the colon of normal mice but was significantly increased in the lamina propria of those damaged by dextran sulfate sodium (29). Therefore, it is quite possible that circulating monocytes encounter the Gal-4 that is passively released from a damaged, inflamed gut. Therefore, further in vivo study will be needed to discover if Gal-4-induced macrophage-like cells could contribute to mucosal immunity in inflammatory conditions.
In summary, our study showed that the interaction of Gal-4 with CD14 promoted the differentiation of monocytes into unique macrophage-like cells through MAPK signaling pathway. These results suggest that Gal-4 may be an important triggering factor for monocyte differentiation and propose a first step for understanding the complex dialogue between Gal-4 and monocytes.
 XML Download