

 PDF
PDF Citation
 Print
Print


Abbreviations
ATCC
American Type Culture Collection
BMP
bone morphogenetic protein
ECSIT
evolutionarily conserved signaling intermediate in Toll pathways
gAcrp
globular adiponectin
IB
immunoblotting
IKK
IκB kinase
IP
immunoprecipitation
IRAK1
IL-1 receptor-associated kinase 1
MAP3K7
mitogen-activated protein kinase kinase kinase 7
MEF
mouse embryonic fibroblast
MyD88
myeloid differentiation primary response 88
NGF
nerve growth factor
NOS
nitric oxide synthase
PAMP
pathogen-associated molecular pattern
SQSTM1
sequestosome 1
TAB1
TGF-β activated kinase 1 binding protein 1
TAB2
TGF-β activated kinase 1 binding protein 2
TAK1
TGF-β activated kinase 1
TRAF6
TNF receptor associated factor 6
WT
wild-type
INTRODUCTION
TLRs act as the first line of host defense against microbial infections and play pivotal roles in the initiation of innate immunity and the induction of adaptive immune responses by recognizing distinct pathogen-associated molecular patterns (PAMPs) of pathogens (123). TLRs recognize PAMPs and subsequently activate distinct intracellular pathways that lead to the inflammatory response (12345). Upon TLR stimulation, myeloid differentiation primary response 88 (MyD88) recruits IL-1 receptor-associated kinase 1 (IRAK1) and IRAK4. IRAK1 is then phosphorylated, resulting in recruitment of TNF receptor associated factor 6 (TRAF6), an E3 ubiquitin ligase and a scaffold protein. TRAF6 is then autoubiquitinated through Lys63 (K63)-linked ubiquitin chains (45). Ubiquitinated TRAF6 activates a complex containing mitogen-activated protein kinase kinase kinase 7 (MAP3K7), TGF-β activated kinase 1 (TAK1) binding protein 1 (TAB1), and TAK1 binding protein 2 (TAB2) (678). This complex then induces phosphorylation of the inhibitor of IκB kinase (IKK) complex, leading to activation of NF-κB and induction of the expression of genes encoding inflammatory cytokines.
The evolutionarily conserved signaling intermediate in Toll pathways (ECSIT) has been identified as a cytoplasmic protein interacting specifically with the multi-adaptor protein and TRAF6, which participates in both Drosophila and mammalian TLRs signaling pathways that regulate innate immunity (910111213). In addition, previous reports have shown that ECSIT played an essential role in bactericidal activity through the generation of mitochondrial reactive oxygen species in response to TLR stimulation (131415) and functioned in BMP signaling in the nucleus (12). Moreover, studies have reported that TRAF6 interacted with ECSIT and induced the ubiquitination of ECSIT (10131415). Ubiquitinated ECSIT further interacted with p65/p50 NF-κB proteins and colocalized to the nucleus in the presence of TLR4 stimulation, eventually leading to the activation of NF-κB proteins and the induction of pro-inflammatory cytokines (13), strongly indicating that ECSIT, as a multi-functional protein, plays a pivotal role in TLRs, bone morphogenetic protein (BMP), and TGF-β signaling.
Sequestosome 1 (SQSTM1, p62) plays diverse biological roles ranging from inflammation to oxidative stress, tumorigenesis, and misfolded protein degradation (161718). The function of p62 in the inflammatory response is controversial, as it can play either positive (1920) or negative roles (2122). p62 is involved in the induction of inflammatory cytokine production via TRAF6 polyubiquitination and, thereby, NF-κB activation (19). Additionally, p62 is involved in the α-protein kinase C-mediated activation of IKK/NF-κB signaling via formation of the p75-bound TRAF6 complex (20). Conversely, previous reports have shown that p62 signaling was involved in anti-inflammatory responses (2122). p62 inhibited MyD88-TRAF6 complex formation, a vital process for activating the downstream signaling cascade in inflammatory responses, which suppressed the expression of IL-6 and nitric oxide synthase 2 (NOS2) (21). Moreover, p62 overexpression led to the decrease of inflammatory cytokine production (22). Since it has been well known that MyD88 and TRAF6 proteins play a pivotal role for the activation of NF-κB induced by TLR4 stimulation (4567), it can be assumed that p62 is functionally involved in TLR4-mediated signaling.
In this study, we investigated whether p62 was implicated in TLR4-induced inflammatory responses. Biochemical studies revealed that p62 interacted with ECSIT. p62-ECSIT interaction inhibited the association of TRAF6 to ECSIT, thereby, suppressing the ubiquitination of ECSIT, suggesting that p62 might negatively regulate TLR4-mediated signaling via the inhibition of ECSIT-TRAF6 interaction and suppression of the ubiquitination of ECSIT. Consistent with these results, we found that p62−/− (p62-knockout) mouse embryonic fibroblast (MEF) cells enhanced of NF-κB activation and production of pro-inflammatory cytokines, such as TNF-α, IL-6, and IL-1β, in the presence of LPS stimulation, compared to p62+/+ (p62 wild type) MEF cells. In contrast, these responses were significantly suppressed by p62-overexpressed cells. Interestingly, we also found that p62−/− mice exhibited significantly decreased survival in response to LPS challenge, compared to wild-type p62+/+ mice. Taken together, our data strongly suggest that p62 was negatively implicated in TLR4-mediated signaling via interruption of the ECSIT-TRAF6 complex, thereby inhibiting ECSIT ubiquitination.
MATERIALS AND METHODS
Mice
p62−/− knockout mice were generated by standard gene targeting methods based on previously published protocols (2324). All p62 mutant mice were bred by mating 10- to 20-week-old heterozygous male and female mice. Water and regular chow (LabDiet 5L79 containing 5.2% fat) were available ad libitum and all mice were handled in the AAALAC accredited Sungkyunkwan Medical School Animal Care Facility. Animal procedures complied with National Institutes of Health guidelines and were approved by the Institutional Animal Care and Use Committee (IACUC, 14-19) of Sungkyunkwan University School of Medicine. For the LPS challenge, wild-type (WT) p62+/+ and p62−/− mice were injected intraperitoneally with 25 mg/kg LPS (n=6 per group) or 12 mg/kg LPS (n=11–13 per group) in phosphate buffered saline (PBS). Survival was monitored for 10 days or seven days after LPS challenge. The Kaplan-Meier method was used to compare the differences in mortality rates between the groups.
Cells
WT p62+/+ MEF and p62−/− MEF cells were isolated from −13.5-day embryos of WT p62+/+ mice and p62−/− mice. MEF cells with passage numbers between two and five were used in the experiments. MEF cells were cultured at 37°C in DMEM (Thermo Fisher Scientific, Waltham, MA, USA), supplemented with 10% FBS, 100 units/ml of penicillin, and 100 µg/ml of streptomycin. HEK293T human embryonic kidney cells were purchased from the American Type Culture Collection (ATCC, CRL-11-268) and maintained in DMEM (Thermo Fisher Scientific). THP-1 human monocytic cells were purchased from ATCC (TIB-202) and maintained in RPMI 1640 medium (Thermo Fisher Scientific) containing 10% FBS (Hyclone, Ogden, UT, USA), 2 mM L-glutamine (Gibco, Grand Island, NY, USA), 100 units/ml penicillin (Gibco), 100μg/ml streptomycin (Gibco), and 5×10⁻⁵ M β-mercaptoethanol (Gibco).
Antibodies
Specific anti-HA, anti-Flag anti-Myc, anti-TRAF6, anti-pho-TAK1, anti-TAK1, anti-pho-IKKβ, anti-IKKαβ, and anti-GAPDH antibodies were purchased from Cell Signaling Technology (Beverly, MA, USA). The anti-p62 and anti-ECSIT antibodies were purchased from Abcam (Cambridge, MA, USA). Mouse TrueBlot ULTRA: anti-Mouse Ig HRP was purchased from Rockland Immunochemicals, Inc. (Limerick, PA, USA).
Luciferase reporter assay
THP-1, WT p62+/+ MEF, and p62−/− MEF cells were transiently transfected with different vectors, as indicated in the figures, using Lipofectamine LRX (Invitrogen, Carlsbad, CA, USA) or the Neon transfection system (Invitrogen), together with the pBIIx-luc NF-κB-dependent reporter construct and the Renilla luciferase vector (Promega, Madison, WI, USA). At 24 h post-transfection, the THP-1 cells were treated with 200 ng/ml LPS and the WT p62+/+ MEF and p62−/− MEF cells were treated with 1 µg/ml LPS for 6 h, then lysed. The luciferase activity was measured using a dual luciferase assay kit (Promega).
Measurement of pro-inflammatory cytokines and p65- and p50-DNA-binding assays
The THP-1 cells were transiently transfected with mock or Myc-p62 vectors using the Neon transfection system (Invitrogen), then the cells were treated with LPS (200 ng/ml) for 9 h and the supernatants were collected. The levels of human TNF-α, IL-1β, and IL-6 were measured in the supernatants according to the manufacturer's protocol (R&D Systems, Minneapolis, MN, USA). WT p62+/+ MEF and p62−/− MEF cells were treated with LPS (1 µg/ml) for 9 h and the supernatants were collected. The levels of moue TNF-α, IL-1β, and IL-6 were measured in the supernatants according to the manufacturer's protocol (R&D Systems). Control THP-1 and MEF cells were not treated with LPS. For the p65- and p50-DNA-binding assays, the THP-1 cells were transiently transfected with mock or Myc-p62 vectors using the Neon transfection system (Invitrogen). After 38 h, nuclear proteins from the transfectants treated for 6 h with or without LPS (200 ng/ml) were prepared with the CelLytic NuCLEAR extraction kit in accordance with the manufacturer's protocol (Sigma-Aldrich, St. Louis, MO, USA). WT p62+/+ MEF and p62−/− MEF cells were treated with or without LPS (1 µg/ml) and nuclear proteins were prepared with the CelLytic NuCLEAR extraction kit in accordance with the manufacturer's protocol (Sigma-Aldrich). Activities of the p65 and p50 transcription factors were determined with the TransAM NF-κB transcription factor assay kit according to the manufacturer's instructions (Active Motif North America, Carlsbad, CA, USA).
Plasmids
Myc-tagged p62, Flag-tagged p62, Myc-tagged ECSIT, Myc-tagged TRAF6, Flag-tagged ECSIT, Flag-tagged TRAF6, and HA-tagged Ub vectors were used. Flag-tagged ECSIT truncated mutants, Flag-tagged 1-200, and Flag-tagged 1-300 were generated as described previously (910). Flag-tagged TRAF6 truncated mutants, Flag-tagged 110-522, Flag-tagged 260-522, and Flag-tagged 349-522 were generated as described previously (15).
Western blotting and immunoprecipitation (IP) assay
Cells were transfected with the appropriate vectors, as indicated in each figure. Western blotting and IP assays were performed as described previously (25262728). HEK293T cells were transfected with a mock vector as a control vector and appropriate vectors. At 38 h post-transfection, the transfected cells were extracted and the cell lysates were subjected to immunoprecipitation with anti-Flag or anti-Myc antibodies followed by immunoblotting (IB) using anti-Flag, anti-Myc, anti-HA, anti-p62, anti-TRAF6, or anti-ECSIT antibodies. WT p62+/+ MEF and p62−/− MEF cells were stimulated without or with LPS for different times, lysed in lysis buffer, and the lysates were examined by Western blotting with anti-p62, anti-IKKαβ, anti-pho-IKKβ, anti-pho-TAK1, anti-TAK1, and anti-GAPDH antibodies (Cell Signaling Technology).
Ubiquitination assay
HEK293T cells were transfected with mock, Flag-TRAF6, Myc-ECSIT, HA-Ub, and different concentrations of Flag-p62. At 38 h post transfection, the transfected cells were extracted and the cell lysates were subjected to immunoprecipitation with anti-Myc antibody. The immunoprecipitated complexes were separated by 6%–10% SDS-PAGE and probed with anti-HA, anti-Myc, anti-p62, or anti-TRAF6 antibodies.
RESULTS
p62 negatively regulates the activation of NF-κB induced by TLR4 stimulation
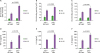
Although diverse roles of p62 have been reported in biological responses (19202122), whether p62 regulates the inflammatory response induced by TLR4-mediated signaling has never been investigated. To address this issue, Myc-p62 protein was overexpressed in human monocytic THP-1 cells, then NF-κB luciferase and p65/p50-DNA binding activities were measured in the presence or absence of LPS. The LPS-induced NF-κB luciferase activity was enhanced in mock-transfected THP-1 cells, whereas it was significantly suppressed in Myc-p62-transfected THP-1 cells (Fig. 1A, Mock vs. Myc-p62 in closed bars). Consistently, p65-and p50-DNA binding activities were suppressed in Myc-p62-transfected THP-1 cells treated with LPS compared to mock-transfected THP-1 cells treated with LPS (Fig. 1B, p65 and Fig. 1C, p50). NF-κB is required for the transcription of many cytokines, including TNF-α, IL-1β, and IL-6, which play pivotal roles for the generation of pro-inflammatory responses (29). To confirm the suppressive effect of p62 in NF-κB activation induced by TLR4 stimulation, therefore, we measured the production of pro-inflammatory cytokines, such as TNF-α, IL-6, and IL-1β. Upon LPS stimulation, TNF-α, IL-6, and IL-1β production was markedly decreased in Myc-p62-transfected THP-1 cells treated with LPS compared to mock-transfected THP-1 cells treated with LPS (Fig. 1D, TNF-α; Fig. 1E, IL-6; and Fig. 1F, IL-1β), indicating that p62 was negatively involved in the activation of NF-κB induced by TLR4 stimulation. To verify the functional role of p62 in TLR4-mediated signaling, WT p62+/+ and p62−/− MEF cells were treated with or without LPS and the NF-κB luciferase and p65/p50-DNA binding activities were measured. Conversely, these activities were markedly higher in p62−/− MEF cells treated with LPS than in WT p62+/+ MEF cells treated with LPS (Fig. 2A, NF-κB luciferase activity; Fig. 2B, p65-DNA binding activity; and Fig. 2C, p50-DNA binding activity). Consistently, TNF-α, IL-6, and IL-1β productions were markedly elevated in p62−/− MEF cells treated with LPS compared to WT p62+/+ MEF cells treated with LPS (Fig. 2D, TNF-α; Fig. 2E, IL-6; and Fig. 2F, IL-1β). These results suggest that p62 negatively regulated the activation of NF-κB induced by TLR4 stimulation.
Figure 1
p62 overexpression inhibits the activation of NF-κB induced by TLR4. (A) THP-1 cells were transfected with vector control (Mock) or Myc-p62 vector together with pBIIx-luc and Renilla luciferase vector, untreated or treated with LPS (200 ng/ml) for 6 h, then subjected to the luciferase activity assay. The results are expressed as fold-induction in luciferase activity relative to untreated cells. All error bars represent the mean ± SD of triplicate samples. Western blot analysis was used to measure the expression of transiently transfected Myc-p62 (lower panel). The expression of GAPDH was used as a loading control. (B and C) THP-1 cells were transfected with mock or Myc-p62 vector, untreated or treated with LPS (200 ng/ml) for 6 h, then analyzed for p65-DNA (B) or p50-DNA (C) binding activity. All error bars represent the mean ± SD of triplicate samples. (D-F) THP-1 cells were transfected with mock or Myc-p62 vector, untreated or treated with LPS (200 ng/ml) for 9 h, then subjected to ELISA to determine the levels TNF-α (D), IL-6 (E), and IL-1β (F) produced. All error bars represent the mean ± SD from triplicate samples.
WO, untreated; W LPS, treated with LPS.
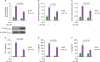
Figure 2
p62−/−MEF cells enhance the activation of NF-κB induced by TLR4. (A) Wild-type (WT) p62+/+MEF and p62−/−MEF cells were transfected with pBIIx-luc and Renilla luciferase vector, untreated or treated with LPS (1 µg/ml) for 6 h, then subjected to the luciferase activity assay. Results are expressed as fold-induction in luciferase activity relative to untreated cells. All error bars represent the mean±SD of triplicate samples. (B and C) WT p62+/+MEF and p62−/−MEF cells were untreated or treated with LPS (1 µg/ml) for 6 h, then analyzed for p65-DNA (B) or p50-DNA (C) binding activity. All error bars represent the mean±SD of triplicate samples. (D-F) WT p62+/+MEF and p62−/−MEF cells were untreated or treated with LPS (1 µg/ml) for 9 h, then subjected to ELISA to determine the levels TNF-α (D), IL-6 (E), and IL-1β (F) produced. All error bars represent the mean±SD from triplicate samples.
WO, untreated; W LPS, treated with LPS.
p62−/− MEF cells enhance the activation of TLR4-induced signaling
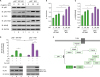
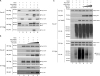
Having shown that p62−/− MEF cells increased NF-κB induced by TLR4 stimulation, we examined whether the activation of NF-κB was associated with TLR4-mediated activation of signal transduction. WT p62+/+ and p62−/− MEF cells were treated with LPS for different times, as indicated in Fig. 3A, then the activation of signaling molecules regulated by TLR4 was evaluated. As expected, the phosphorylation of TAK1 was gradually increased in the presence of LPS (Fig. 3A, IB: pho-TAK1 and Fig. 3B, WT p62+/+ MEF). Moreover, the activation of TAK1 was significantly associated with the activation of IKKs (Fig. 3A, IB: pho-IKKβ and Fig. 3C, WT p62+/+ MEF). Interestingly, the phosphorylation of TAK1 was significantly enhanced in p62−/− MEF cells in the presence of LPS compared to WT p62+/+ MEF cells (Fig. 3A, p62−/− MEF vs. WT p62+/+ MEF in IB: pho-TAK1 and Fig. 3B, p62−/− MEF vs. WT p62+/+ MEF). Consistently, the level of pho-IKKβ was increased in p62−/− MEF cells (Fig. 3A, p62−/− MEF vs. WT p62+/+ MEF in IB: pho-IKKβ and Fig. 3C, p62−/− MEF vs. WT p62+/+ MEF), suggesting that p62 negatively regulated the activation of TLR4-mediated signaling. To verify these results, Myc-p62 was transiently transfected into p62−/− MEF cells and the activation of NF-κB was measured. Consistent with the results shown in Fig. 2A, NF-κB activation was markedly increased in p62−/− MEF cells treated with LPS compared to WT p62+/+ MEF treated with LPS (Fig. 3D, p62−/− MEF vs. WT p62+/+ MEF). Interestingly, the activation of NF-κB was markedly decreased in p62−/− MEF cells transiently transfected with Myc-p62 to similar levels seen in WT p62+/+ MEF cells (Fig. 3D, p62−/− MEF-transfected p62 vs. WT p62+/+ MEF-transfected mock with LPS stimulation). Taken together, these results strongly suggest that the negative regulation of p62 may be closely associated with signaling cascades for the activation of NF-κB induced by TLR4, as depicted in Fig. 3E.
Figure 3
p62−/−MEF cells enhance TLR4-mediated signals. (A) Wild-type (WT) p62+/+MEF and p62−/−MEF cells were treated with or without LPS (1 µg/ml) for different time periods, as indicated, then subjected to Western blot analyses using anti-TAK1, anti-pho-TAK1, anti-pho-IKKβ, anti-IKKαβ, or anti-GAPDH antibody as a loading control. (B and C) The band intensity of pho-TAK1 (B) or pho-IKKβ (C) was analyzed with the Image J program. The data shown are averages from a minimum of three independent experiments (± SD). (D) WT p62+/+MEF and p62−/−MEF cells were transfected with vector control (Mock) or Myc-p62 vector together with pBIIx-luc and Renilla luciferase vector, untreated or treated with LPS (1 µg/ml) for 6 h, then subjected to the luciferase activity assay. The results are expressed as fold-induction in luciferase activity relative to untreated cells. All error bars represent the mean±SD of triplicate samples. Western blot analysis was used to measure the expression of transiently transfected Myc-p62 (lower panel). The expression of GAPDH was used as a loading control. (E) Model showing how p62 is negatively involved in TLR4-mediated signaling. TLR4 stimulation induces the activation of TRAF6 through upstream signaling molecules. TRAF6 is further associated with ECSIT/TAK1/TAB1/TAB2 molecules for the activation of TAK1, eventually leading to the activation of NF-κB. p62 may be negatively involved in these processes, as indicated.
*p<0.05, **p<0.01.
p62 inhibits the association of ECSIT-TRAF6 complex and suppresses the ubiquitination of ECSIT
Based on the above results, we next explored the molecular mechanism by which p62 negatively regulated TLR4-mediated signaling. Previous reports have shown that p62 interacted with TRAF6 (2030). TRAF6 ubiquitin-ligase activity plays a pivotal role in TLR4-mediated signaling for the activation of NF-κB (458152526). TRAF6 has been reported to interact with ECSIT and induce the ubiquitination of ECSIT, eventually regulating the activation of NF-κB in TLR4-mediated signaling (10). Therefore, we hypothesized that the regulatory role of p62 in TLR signaling might be associated with the formation of TRAF6-ECSIT, leading to the activation of NF-κB. To examine this hypothesis, we first tested whether p62 interacted with ECSIT. An immunoprecipitation assay in HEK293T cells revealed that Myc-p62 was precipitated with Flag-ECSIT protein (Fig. 4A, lane 6). To determine the p62 interaction site on ECSIT, HEK293T cells were transfected with Flag-ECSIT WT, Flag-ECSIT truncation mutants, or Myc-p62 vector, as indicated in Fig. 4A and the IP assay was performed using anti-Myc antibody. Myc-p62 proteins were precipitated with Flag-ECSIT WT and Flag-ECSIT 1-300, whereas a marginal interaction could be observed with Flag-ECSIT 1-200 (Fig. 4A, lane 6-8), indicating that p62 could interact with the internal domain of ECSIT (Fig. 4A, down). We next determined the p62 interaction site on TRAF6. HEK293T cells were transfected with Flag-TRAF6 WT, Flag-TRAF6 truncation mutants, or Myc-p62 vector, as indicated in Fig. 4B and the IP assay was performed using anti-Flag antibody. Myc-p62 proteins were significantly precipitated with Flag-TRAF6 WT, Flag-TRAF6 110-522, Flag-TRAF6 260-522, and Flag-TRAF6 349-522 proteins, suggesting that p62 interacted with the C-terminal domain of TRAF6 (Fig. 4B, down). Moreover, we previously identified that TRAF6 interacted with the internal domain, ECSIT 200-300, of ECSIT (9). These results suggest that p62 and TRAF6 interacted with the internal domain of ECSIT (Fig. 4C). As depicted in Fig. 4D, the interaction between TRAF6 and ECSIT lead to the ubiquitination of ECSIT, crucial for the activation of NF-κB in response to TLR4 stimulation (10). Our data suppose that the molecular interaction between p62 and ECSIT may be critically affected on the association of ECSIT-TRAF6 complex and the ubiquitination of ECSIT by TRAF6, eventually leading to the inhibition of NF-κB activation (Fig. 4D).
Figure 4
p62 interacts with ECSIT. (A) HEK293T cells were transfected with mock, Flag-ECSIT WT, and Flag-ECSIT truncated mutants, Flag-ECSIT 1-300 and Flag-ECSIT 1-200, and Myc-p62, as indicated. At 38 h post transfection, the transfected cells were extracted and the cell lysates were subjected to immunoprecipitation with anti-Myc antibody followed by IB using anti-Flag or anti-Myc antibody. Model of how p62 interacts with ECSIT (down). (B) HEK293T cells were transfected with mock, Myc-p62, Flag-TRAF6 WT, and Flag-TRAF6 truncated mutants, Flag-TRAF6 110-522, Flag-TRAF6 260-522, and Flag-TRAF6 349-522, as indicated. At 38 h post transfection, transfected cells were extracted and cell lysates were subjected to immunoprecipitation with anti-Flag antibody followed by IB using anti-Flag or anti-Myc antibody. Model of how p62 interacts with TRAF6 (down). (C) Model of how ECSIT interacts with TRAF6 and p62. (D) A possible model in which p62 is negatively implicated in TRAF6/ECSIT-mediated activation of NF-κB.
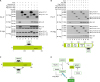
Having shown the molecular association of p62, TRAF6, and ECSIT proteins, we raised the possibility that p62 inhibits the association with the TRAF6-ECSIT complex, as suggested in Fig. 4D. To examine the possibility, Flag-TRAF6 was transiently expressed into HEK293T cells along with Myc-p62 and Myc-ECSIT, as indicated in Fig. 5A and the IP assay was performed with anti-Flag antibody. Consistently, Myc-p62 was significantly co-precipitated with Flag-TRAF6 in the absence of Myc-ECSIT (Fig. 5A, lane 5), whereas the interaction between TRAF6 and p62 was markedly abolished in the presence of Myc-ECSIT (Fig. 5A, lane 6). To examine the inhibitory effect of p62 in the TRAF6-ECSIT interaction, Flag-TRAF6 and Myc-ECSIT were transiently expressed into HEK293T cells along with different concentrations of Myc-p62, as indicated in Fig. 5B and the IP assay was performed with anti-Flag antibody. As expected, the interaction between TRAF6 and ECSIT was gradually attenuated in the presence of Myc-p62 (Fig. 5B, IP: Flag and IB: ECSIT). Significant increases in TRAF6-p62 interaction were detected corresponding to increases in Myc-p62 (Fig. 5B, IP: Flag and IB: p62). These results strongly suggest that p62 inhibited the interaction between TRAF6 and ECSIT. TRAF6-induced ubiquitination of ECSIT plays a pivotal role in the activation of NF-κB in TLR4-mediated signaling (10). Therefore, we further examined whether p62 affected the ubiquitination of ECSIT protein. Myc-ECSIT, Flag-TRAF6, and HA-Ub were expressed in HEK293T cells along with different concentrations of Flag-p62 and the IP assay was performed using anti-Myc antibody. Ubiquitination of ECSIT was strongly increased in the absence of Flag-p62 (Fig. 5C, lane 3), whereas significant decreases in the ubiquitination of ECSIT were observed in the presence of Flag-p62 (Fig. 5C, lane 4–6), indicating that p62 inhibited the ubiquitination of ECSIT. These results demonstrate that, p62 interacted with ECSIT and inhibited association with the TRAF6-ECSIT complex, leading to suppression of the ubiquitination of ECSIT, as depicted in Fig. 4D.
Figure 5
p62 inhibits the interaction of TRAF6-ECSIT and inhibits the ubiquitination of ECSIT. (A) HEK293T cells were transfected with mock, Flag-TRAF6, Myc-ECSIT, and Myc-p62, as indicated. At 38 h post transfection, the transfected cells were extracted and cell lysates were subjected to immunoprecipitation with anti-Flag antibody followed by IB using anti-Flag, anti-p62, or anti-ECSIT antibody. (B) HEK293T cells were transfected with mock, Flag-TRAF6, Myc-ECSIT, and different concentrations of Myc-p62, as indicated. At 38 h post transfection, transfected cells were extracted and cell lysates were subjected to immunoprecipitation with anti-Flag antibody followed by IB using anti-Flag, anti-p62, or anti-ECSIT antibody. (C) HEK293T cells were transfected with mock, Flag-TRAF6, Myc-ECSIT, HA-Ub, and different concentrations of Flag-p62, as indicated. At 38 h post transfection, transfected cells were extracted and cell lysates were subjected to immunoprecipitation with anti-Myc antibody followed by IB using anti-HA, anti-Myc, anti-p62, or anti-TRAF6 antibodies.
p62−/− mice exhibit high sensitivity to LPS challenge
Having shown that p62 negatively regulated the activation of NF-κB and production of pro-inflammatory cytokines induced by TLR4 stimulation (Figs. 1 and 2) via inhibition of TRAF6-ECSIT interaction and attenuation of ubiquitination of ECSIT (Figs. 4 and 5), we finally examined whether the mortality rate in p62−/− mice was critically affected by LPS challenge. p62+/+ WT and p62−/− mice were challenged with a high dose of 25 mg/kg LPS or a low dose of 12 mg/kg LPS and the survival rate was monitored over time. Following high dose LPS, the mortality rate in both mice was increased in a day-dependent manner but the rate was significantly higher in p62−/− mice than in p62+/+ WT mice (Fig. 6A, p62+/+ WT vs. p62−/− mice). Following low dose LPS, interestingly, 90% of the p62+/+ WT mice survived for 6 days, whereas 50% of the p62−/− mice died within 5 days (Fig. 6B). These results strongly suggest that the p62−/− mice exhibited a higher mortality rate following LPS challenge and the effects may be critically related to the production of pro-inflammatory cytokines, such as TNF-α, IL-6, and IL-1β, as shown in Figs. 1 and 2.
Figure 6
p62−/− KO mice exhibit a higher mortality rate following LPS challenge. (A and B) Wild-type (WT) p62+/+ and p62−/− KO mice were injected intraperitoneally with 25 mg/kg LPS (n=6 per group) in PBS (A) or 12 mg/kg LPS (n=11–13 per group) in PBS (B). Survival was monitored for 10 days or seven days after LPS challenge. The Kaplan-Meier method was used to compare the differences in mortality rates between the groups. (C) Model of how p62 negatively regulates TLR4-mediated signaling for the activation of NF-κB and the production of pro-inflammatory cytokines. TLR4 stimulation induces the activation of TRAF6 through upstream signaling molecules, such as MyD88 and IRAK1/2/4. TRAF6 is further associated with ECSIT/TAK1/TAB1/TAB2 molecules for ubiquitination of ECSIT and activation of TAK1 for the activation of NF-κB, eventually leading to the production of pro-inflammatory cytokines, including TNF-α, IL-6, and IL-1β (left). However, the interaction between p62 and ECSIT may lead to the inhibition of TRAF6-ECSIT interaction and ubiquitination of ECSIT, leading to the inhibition of NF-κB activation and production of pro-inflammatory cytokines (right).
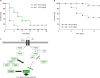
In summary, TLR4 stimulation induced the activation of TRAF6 through upstream signaling molecules, such as MyD88 and IRAK1/2/4 (1-5). TRAF6 was further associated with ECSIT/TAK1/TAB1/TAB2 molecules for the ubiquitination of ECSIT and activation of TAK1 for the activation of NF-κB, eventually leading to the production of pro-inflammatory cytokines, including TNF-α, IL-6, and IL-1β (Fig. 6C, left). However, the interaction between p62 and ECSIT led to the inhibition of TRAF6-ECSIT interaction and ubiquitination of ECSIT, resulting in the inhibition of NF-κB activation and production of pro-inflammatory cytokines (Fig. 6C, right).
DISCUSSION
p62 is a multifunctional cytoplasmic protein involved in a number of biological responses, such as tumorigenesis and inflammatory responses (1920212230). p62 is a signaling adaptor induced by Ras and is necessary for Ras-mediated triggering of IKK through the polyubiquitination of TRAF6 (19). p62−/− mice are resistant to Ras-induced lung adenocarcinomas and p62 deficiency induces increased ROS levels, which account for the enhanced cell death and reduced tumorigenicity of Ras in the absence of p62, supporting the importance of p62 in NF-κB-mediated tumorigenesis (19). Additionally, formation of a TRAF6-p62 complex serves as a bridge linking both p75 and TrkA proteins, which interact with nerve growth factor (NGF) and involve the activation of NF-κB via their receptor-mediated signaling, suggesting that p62 serves as a scaffold for activation of the NF-κB pathway in NGF survival and differentiation responses (20). In contrast, it has been recently reported that p62 signaling played a crucial role in suppressing inflammatory cytokine production by globular adiponectin (gAcrp) in macrophages (30). Knockdown of p62 abrogated the suppressive effects of gAcrp on LPS-stimulated TNF-α and IL-1β expression and the TRAF6/p38 MAPK pathway (30). Nevertheless, the precise molecular mechanism by which p62 is involved in inflammatory signaling has remained unclear.
In this study, we proposed a possible molecular mechanism by which p62 negatively regulates TLR4-mediated signaling to activate NF-κB and produce pro-inflammatory cytokines. We found that, upon LPS stimulation, TLR4-mediated signaling and production of pro-inflammatory cytokines were markedly enhanced in p62−/− MEF cells compared to p62+/+ wild-type MEFs (Figs. 2 and 3). In contrast, p62 overexpression in THP-1 cells significantly attenuated the activation of NF-κB and the production of pro-inflammatory cytokines in the presence of LPS stimulation (Fig. 1). The results were partially consistent with a previous report (31). Based on these results, we assumed that p62 might be negatively implicated in TLR4-mediated signaling. TRAF6, as an E3 ubiquitin ligase and scaffold protein, plays pivotal roles in the activation of NF-κB in TLR-mediated signaling (45678910). TRAF6 interacted with ECSIT, which is known as a multifunctional regulator of different signals (910111213), and that regulated TLR4-mediated signaling (9101115). We found that p62 interacted with the internal domain of ECSIT, which is critical for the interaction with TRAF6. The p62-ECSIT interaction markedly interrupted the interaction of TRAF6 with ECSIT, thereby inhibiting the ubiquitination of ECSIT. Upon challenge with high or low dose LPS, intriguingly, the mortality was significantly higher in p62−/− mice than in p62+/+ wild-type mice. Since it has been reported that the association and ubiquitination of ECSIT by TRAF6 plays a pivotal role in the activation of NF-κB induced by TLR4 ubiquitination, these results strongly suggest that p62 was negatively implicated in TLR4-mediated signaling through the inhibition of TRAF6-ECSIT association and the ubiquitination of ECSIT by TRAF6.
In conclusion, in TLR4-mediated signaling for activation of NF-κB and production of pro-inflammatory cytokines, p62 regulated the function of TRAF6, as depicted in Fig. 6C. Upon TLR4 stimulation, TRAF6 activated and interacted with ECSIT to activate TAK1 (9101115). Meanwhile, ECSIT was ubiquitinated by TRAF6 and that regulated the activation of NF-κB (10). The molecular association and regulation were eventually implicated in the production of pro-inflammatory cytokines via NF-kB activation (Fig. 6C, left). However, the interaction of p62 with TRAF6 inhibited the interaction of ECSIT and TRAF6, resulting in the inhibition of NF-κB activation needed to produce pro-inflammatory cytokines by TLR4 (Fig. 6C, right). Our current results will contribute to our understanding of p62-related biological responses, such as tumorigenesis, inflammatory responses, autophagy induction.
 XML Download