

 PDF
PDF Citation
 Print
Print


Abbreviations
APC
Ag presenting cell
ATRA
all-trans retinoic acid
BM
bone marrow
CD11chi
high level of CD11c
CTV
CellTrace™ violet
DCs
dendritic cells
F4/80hi
high levels of F4/80
FCS
fetal calf serum
FITC-OVA
FITC-conjugated ovalbumin
FLT3L
FLT3 ligand
FOXP3
forkhead box P3
GEO
Gene Expression Omnibus
GSE
GEO series
ICAM2
intercellular adhesion molecule 2
i.p.
intraperitoneally
IRF4
IFN regulatory factor 4
iTreg
induced Treg
KO
knockout
Lin
lineage
LPM
large peritoneal macrophage
MHCIIlo
low-level MHC class II
MoDC
monocyte-derived DC
NOTCH2
neurogenic locus notch homolog protein 2
OVA
ovalbumin
RELMα
resistin-like molecule α
RNA-Seq
RNA sequencing
SPM
small peritoneal macrophage
Tc
cytotoxic T cell
YGM
yellow green microspheres
INTRODUCTION
Mononuclear phagocytes such as dendritic cells (DCs) and macrophages are essential in orchestrating immune responses and maintaining tissue homeostasis. In almost all tissues and organs, they efficiently take up Ags and thus effectively induce immune responses against Ags. Despite some similarities in recognizing and capturing Ags, DCs and macrophages play quite a different role in innate and adaptive immune responses (12). DCs are specialized immune cells function as both sentinels and Ag-presenting cells (APCs). DCs pick up Ags in periphery and migrate to draining lymph nodes where DCs present Ag-processed peptides as epitopes on MHC molecules to responding T cells. Depending upon the immune context in which the Ags are captured, DCs can trigger either immunity or tolerance (3). Macrophages are multifunctional cells that promote the initiation, progression, and resolution of inflammation (45). Compared to DCs, macrophages are highly phagocytic and thus mainly focus on the rapid elimination of phagocytosed Ags. By quickly phagocytosing and clearing Ags such as microorganisms and cell debris, they contribute to maintaining local tissue integrity. Macrophages also promote the resolution of inflammatory process by inducing angiogenesis and tissue repair. Macrophages and DCs are morphologically different; adherent macrophages display large irregular shapes while non-adherent DCs exhibit long probing processes or dendrites (6).
Besides the differences described above, macrophages and DCs are distinguished by their distinctive surface markers, such as high levels of F4/80 (F4/80hi) for macrophages and high level of CD11c (CD11chi) for DCs, respectively (78). However, recent advances in the techniques of multi-parameter cell analysis have revealed the complexity of surface markers for respective cells. As a result, both macrophages and DCs are deemed to have heterogeneous populations which vary between different tissues and organs (1910111213). For example, mouse lung alveolar macrophages and gut lamina propria macrophages express CD11c and MHC II (9101112) which are 2 of the signature markers for DCs, whereas epidermal Langerhans cells express F4/80, a prominent marker for macrophages (13). Therefore, it is important to establish tissue-specific strategies to accurately differentiate distinct subpopulations of macrophages and DCs.
Peritoneal cavity is a specialized compartment formed between the parietal peritoneum and visceral peritoneum. Not only multiple organs and circulatory systems but also a variety of immune cells are found in the peritoneal cavity where local and systemic immune responses occur dynamically (1415). Mononuclear phagocytes, mainly macrophages, comprise almost half of all peritoneal immune cells. Macrophages in the mouse peritoneal cavity consist of 2 major subsets: large peritoneal macrophages (LPMs) and small peritoneal macrophages (SPMs). LPMs, the most abundant mononuclear phagocytes in the peritoneal cavity, are long-lived self-renewing cells originating from yolk sac progenitors and express F4/80hi (1617). Although SPMs are much less abundant in steady state, their number increases during inflammation. SPMs are short-lived cells that differentiate from circulating monocytes that express high levels of MHC II but low levels of F4/80 (161819). Since the high expression of MHC II is a key feature of DCs, distinguishing DCs and SPMs based on their surface markers is not clearly defined and somewhat ambiguous. Some investigators used the CD11chi as a prerequisite for defining peritoneal DCs and thus excluded all the CD11chi cells from peritoneal SPMs (162021), while others categorized the peritoneal macrophages without considering their expression of CD11c and excluded all the CD115+ cells from peritoneal DCs (1922). Since cells expressing both CD11c and CD115 are present in the peritoneal cavity (17), it is needed to characterize whether those cells are a subset (s) of SPMs or DCs.
In this report, we classify the mouse peritoneal myeloid mononuclear cells into 5 populations: LPMs, SPMs, DCs, and 2 subpopulations of MHCII+CD11c+CD115+ cells. According to our examinations, 2 out of these 5 populations, i.e., DCs and one of the MHCII+CD11c+CD115+ subpopulations were able to present Ags to T cells efficiently. The potent Ag-presenting MHCII+CD11c+CD115+ subpopulation was identified as CD14−CD206− whereas the incompetent Ag-presenting MHCII+CD11c+CD115+ subpopulation was identified as CD14+CD206+. Although both subsets of APCs in the peritoneal cavity strongly stimulated T cells, DCs were more effective in inducing fully activated and cytokine producing inflammatory T cells, but MHCII+CD11c+CD115+CD14−CD206− subset possessed superior capacity to induce Treg. In development, the numbers of both peritoneal DCs and MHCII+CD11c+CD115+CD14−CD206− subset were similarly influenced by FLT3 ligand (FLT3L) and GM-CSF, while the MHCII+CD11c+CD115+CD14+CD206+ population was strongly affected by GM-CSF but not by FLT3L. In addition, the analysis of gene expression profiles indicates that MHCII+CD11c+CD115+CD14−CD206− cells are closely related to peritoneal DC2 subset, whereas MHCII+CD11c+CD115+CD14+CD206+ cells are indistinguishable from SPMs. Therefore, our present study clearly demonstrates that peritoneal MHCII+CD11c+CD115+ cells are divided into 2 subpopulations: one closely related to DCs and the other to SPMs.
MATERIALS AND METHODS
Animals
C57BL/6 mice were purchased from Orient Bio (Seongnam, Korea), and OT-1, OT-2, and GM-CSF−/− mice were from the Jackson Laboratory (Bar Harbor, ME, USA). FLT3−/− mice were a gift from Professor Jae-Hoon Choi in Hanyang University. All animals were maintained and bred in specific pathogen-free facilities in the Yonsei University College of Medicine. Female mice between 8 and 12 wk of age were used in all experiments. Animal care and experiments were performed according to the guidelines and protocol (#2016-0040) approved by the Institutional Animal Care and Use Committees of the Yonsei University College of Medicine.
Abs and reagents
Fluorochrome-conjugated mAbs to CD3, CD19, Ly6G, intercellular adhesion molecule 2 (ICAM2), MHCI, MHCII, CD11b, CD11c, CD115, XCR1, CD172a, 33D1, F4/80, CD14, CD206, CD24, CD8, CD4, Va2, CD25, CD69, CD44, CD62L, IFN-γ, IL-4, IL-17a, forkhead box P3 (FOXP3), CX3CR1, CD64, CD226, CD68, CD207, CD103, CD209a, CD209b, Ly6C, Clec9a, CD205, CD117, CD135, B220, PD-1, PD-L1, CCR2, CD40, CD80, CD86, CCR7, sialic acid binding Ig-like lectin F, and high-affinity IgE receptor were purchased from BioLegend (San Diego, CA, USA). PE-conjugated anti-CD207 and PE-Cyainine7-conjugated anti-proto-oncogene tyrosine-protein kinase MER were purchased from eBioscience (San Diego, CA, USA). CellTrace™ CFSE or CellTrace™ violet (CTV) Cell Proliferation Kits and LIVE/DEAD™ Fixable Yellow or Far Red Dead Cell Stain Kits were purchased from Thermo Fisher Scientific Korea (Seoul, Korea) and were used according to the instructions provided by the manufacturers. Ovalbumin (OVA; Sigma-Aldrich, St. Louis, MO, USA), FITC-conjugated OVA (FITC-OVA; Thermo Fisher Scientific Korea), and Fluoresbrite® yellow green microspheres (YGM) 1.00 μm beads (Polysciences, Warrington, PA, USA) were purchased respectively. LPS and all trans-retinoic acid were purchased from Sigma-Aldrich; human TGF-β1 from Peprotech (Rocky Hill, NJ, USA); mouse IL-4, mouse IL-6, and anti-mouse IFN-γ neutralizing mAb from BioLegend; PMA and ionomycin from LC Laboratories (Woburn, MA, USA). Cells were cultured in DMC7 medium (23) composed of DMEM containing L-glutamine, high glucose, and pyruvate (GE Healthcare Life Sciences, Logan, UT, USA) and 7% fetal calf serum (GE Healthcare Life Sciences) supplemented with 1× solutions of non-essential amino acids (GE Healthcare Life Sciences) and antibiotic-antimycotic (GE Healthcare Life Sciences). Mouse M-CSF, GM-CSF, and FLT3L were produced and purified in house as described previously (232425).
Flow cytometry
Peritoneal exudate cells were harvested by lavage with 5 ml cold PBS containing 3% fetal calf serum. Single cell suspensions were blocked with neat culture supernatant of 2.4G2 (Fc blocking) mAb hybridoma and washed with FACS buffer (2% FCS, 2 mM EDTA, 0.1% sodium azide). Then, the samples were incubated with the appropriate mixture of fluorochrome-conjugated mAbs and dead cell staining dye for 30 min at 4°C and washed twice with FACS buffer. The mixture of mAbs against lineage (Lin) makers of differentiated cells consisted of anti-CD3, anti-CD19, and anti-Ly-6G. Surface-stained cells were resuspended in Fixation/Permeabilization solution (BioLegend) prior to staining intracellular cytokines. Each sample was analyzed with FACSVerse™ and LSRFortessa™ flow cytometer (BD Biosciences, San Jose, CA, USA) or sorted with FACSAria™ II cell sorter (BD Biosciences) at the Flow Cytometry Core of the Yonsei Biomedical Research Institute in the Yonsei University College of Medicine. Flow cytometric data were analyzed with FlowJo software (FlowJo, Ashland, OR, USA).
Ag uptake
Mice were injected intraperitoneally (i.p.) with 200 μg of FITC-OVA or 200 μl of 0.0027% YGM beads for 1 h, and peritoneal exudate cells were harvested as described above. Then, peritoneal exudate cells were stained for surface markers with fluorochrome-conjugated mAbs followed by the analysis with a flow cytometer as described above. Geometric mean fluorescence intensity index of the FITC channel is defined as below.

Ag presentation and T cell proliferation
Mice were injected i.p. with 1.5 mg of soluble OVA for 1 h, and peritoneal exudate cells were harvested as described above. Then, peritoneal exudate cells were stained with fluorochrome-conjugated mAbs before purifying OVA-laden APCs by sorting with FACSAria™ II cell sorter. Splenic T cells from OT-1 and OT-2 mice were enriched by excluding CD19+, CD49b+, MHC II+, CD11b+, F4/80+, B220+, and CD4+ (for OT-1) or CD8+ (for OT-2) splenocytes using appropriate biotinylated Abs and anti-biotin Dynabeads® (ThermoFisher Scientific Korea) and labeled with 5 mM CFSE or CTV Cell Proliferation Kits for 10 min at 37°C. Then, CFSE or CTV labeled T cells were added into round bottom 96-well plates at 2.5×10⁴/well and mixed with isolated APCs at an indicated APC: T cell ratio in the media containing 57.2 μM β-mercaptoethanol (Sigma-Aldrich). After co-culture with APCs for 3–4 days, the proliferation of live T cells was evaluated by the dilution of CFSE or CTV (626). For in vitro T-cell polarization assays, the mixture of APCs and T cells (APC:T cell = 1:10) included additional cytokines, neutralizing Abs, and reagents as follows: Th0 (media alone), Th1 (1 μg/ml LPS) (27), Th2 (10 ng/ml IL-4) (2829), Th17 (3 ng/ml TGF-β, 20 ng/ml IL-6) (30), iTreg (3 ng/ml TGF-β, 1 nM all-trans retinoic acid (ATRA); (3132), type 0 cytotoxic T cell (Tc0) (media alone), Tc1 (1 μg/ml LPS) (33), Tc2 (10 μg/ml anti-IFN-γ, 20 ng/ml IL-4) (33), Tc17 (10 μg/ml anti-IFN-γ, 5 ng/ml TGF- β, 20 ng/ml IL-6) (33). After culture for 3–4 days, cells were stimulated with PMA (12 nM), ionomycin (1 μM), and brefeldin A (5 μg/ml) for 4 h before analysis.
Cytokine-induced cell expansion in vivo
Mice were subcutaneously injected daily with 10 μg of either mouse M-CSF, GM-CSF, or FLT3L for up to 5 days. The effect of mouse GM-CSF was significant enough after 3 consecutive daily injections. Peritoneal exudate cells were harvested and analyzed 24 h after the last injection.
RNA sequencing (RNA-Seq) and bioinformatics analysis
Peritoneal exudate cells were prepared, stained, and subjected to flow cytometric isolation with FACSAria™ II cell sorter as described above. Then, we isolated RNA samples from the respective Lin-MHCII+ peritoneal cell subsets using MiniBEST Universal RNA Extraction kit (TaKaRa Bio, Shiga, Japan). Subsequent procedures and analysis were performed by Macrogen, Inc (Seoul, Korea) as follows: reverse transcription of mRNA and generation of cDNA libraries were carried out with SMARTer Ultra low input RNA library kit and sequenced with Illumina NovaSeq. The relative abundances of gene were measured in Fragments Per Kilobase of exon per Million fragments mapped using StringTie. The result was statistically analyzed to find differentially expressed genes using the estimates of abundances for each gene in samples. Multidimensional scaling method was used to visualize the similarities among samples. The larger the dissimilarity between 2 samples, the further apart the points representing the experiments in the picture should be. We applied to the Euclidean distance as the measure of the dissimilarity. Hierarchical clustering analysis also was performed using complete linkage and Euclidean distance as a measure of similarity to display the expression patterns of differentially expressed transcripts which are satisfied with |fold change|≥2. All data analysis and visualization of differentially expressed genes was conducted using R 3.5.1 (https://www.r-project.org). RNA-Seq data have been deposited in NCBI's Gene Expression Omnibus (GEO) and are accessible through GEO Series accession number GSE130424 (https://www.ncbi.nlm.nih.gov/geo/query/acc.cgi?acc=GSE130424).
Statistical analysis
Experiments with multiplicate samples were presented as mean±SEM from at least 3 independent experiments. Statistical comparisons between different groups were analyzed using unpaired Student's t-test using SigmaPlot (Systat Software, San Jose, CA, USA). Statistical significance is denoted by the p values equal or below 0.05 (*), 0.01 (**), 0.001 (***), and 0.0001 (****). Data were plotted for graphs with PRISM6 (GraphPad Software, La Jolla, CA, USA).
RESULTS
Phenotypic characterization of peritoneal myeloid mononuclear cells
Myeloid mononuclear cells of the mouse peritoneal exudate cells were analyzed for the expression of various surface markers of DCs and macrophages using multi-parameter flow cytometry (Fig. 1A). Peritoneal myeloid mononuclear cells were recognized following the exclusion of other hematopoietic cells expressing CD3, Ly6G, and CD19. Then, the cells with ICAM2−MHCII− phenotypes (peritoneal eosinophils, mast cells, and monocytes) were further excluded (17). LPMs were identified as ICAM2+low-level MHC class II (MHCIIlo) population (P-I in Fig. 1A), which also expressed F4/80hi (Fig. 1B) and comprised the vast majority of peritoneal myeloid mononuclear cells (Fig. 1C).
Figure 1
Classification of peritoneal myeloid mononuclear cells. Cells in the peritoneal cavity are harvested and analyzed by multi-parameter flow cytometry. (A) The gating strategies to divide peritoneal myeloid mononuclear cells. Cells expressing Lin markers of CD3, CD19, and Ly6G are excluded. (B) Distinct expression of myeloid cell markers. P-IV subset is further divided into P-IV.I and P-IV.II based on the expression levels of CD14 and CD206 (in red box). (C) The number of cells in each subset is evaluated from the peritoneal cavity. Data are shown with SEM from at least 5 independent experiments. Each experiment analyzed peritoneal exudate cells from a single mouse.
SSC, side scatter; FSC, forward scatter.
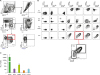
Unlike the most abundant LPMs, the other peritoneal myeloid mononuclear cells expressed high levels of MHC II, a typical feature of APCs. These MHCII+ cells were further divided into 3 populations based on the expression of CD11c and CD115: CD11c+CD115− DCs (P-II), CD11c−CD115+ SPMs (P-III), and CD11c+CD115+ population (P-IV) (Fig. 1A). The identity of CD11c+CD115+ P-IV subset in the peritoneal cavity has been ambiguous and classified as either DCs (162021) or SPMs (1922) because it expresses both markers of DCs (CD11c) and macrophages (CD115). To clarify the nature of P-IV cells, we further examined the levels of various markers expressed by DCs and macrophages, including F4/80, XCR1, 33D1, CD11b, CD14, CD24, CD172α, CD206, CD226, CD301b, and others (Fig.1B; not all data shown). Similar to DCs which consisted of a minor subset of XCR1+CD24+ DC1 and a major subset of XCR1−CD24− DC2, the result clearly indicated that P-IV subset was also composed of 2 phenotypically heterogeneous cells (Fig. 1B). Therefore, we further classified P-IV subset into 2 subpopulations, i.e., CD14−CD206− P-IV.I and CD14+CD206+ P-IV.II. The number of P-IV.II cells was almost twice the number of P-IV.I cells but similar to the number of DCs in the peritoneal cavity (Fig. 1C).
Characterization of morphology and Ag uptake
DCs and macrophages can be distinguished by their peculiar morphological characteristics (62134). Mouse peritoneal exudate cells were separated into 5 subsets of myeloid mononuclear cells, as described above, by flow cytometric sorting and were then cultured overnight before examination. It was obvious that, out of these 5 populations, 3 populations, i.e., LPMs, SPMs, and P-IV.II cells exhibited a typical macrophage morphology, or were observed as large adherent cells with irregular shapes (Fig. 2A). Meanwhile, DCs and P-IV.I cells displayed a dendritic morphology, or were observed as non-adherent cells with long cellular processes (Fig. 2A).
Figure 2
Morphology and Ag uptake ability are examined for each subset of peritoneal myeloid mononuclear cells. (A) Peritoneal exudate cells are harvested and sorted by flow cytometry according to the gates as in Fig. 1. Isolated cells in each subset are cultured overnight before taking pictures under 200× magnification. Cells in each subset are compared for their ability to take up Ags via endocytosis (B) or phagocytosis (C). (B) 200 μg of soluble FITC-conjugated OVA proteins are injected i.p. After 1 h, peritoneal exudate cells are harvested and analyzed. The extents of Ag uptake are assessed by the geometric mean fluorescence intensity index of the FITC channel. Each gray-filled histogram is from each subset in control uninjected mice. Overlay of histograms on FITC channel from each subset is shown on the right lower side. Representative data shown are from 2 independent experiments. (C) A volume of 200 μl of 0.0027% YGM (1.0 μm diameter) is injected i.p. After 1 h, peritoneal exudate cells are harvested and analyzed. Percentages of cells that phagocytose more than 1, 2, or 3 beads are denoted in order. Overlay of histograms on YG channel from each subset is shown on the right lower side. Representative data shown are from 2 independent experiments.
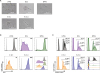
DCs and macrophages are also distinguished by their different ability to take up Ags (1734). Endocytic and phagocytic capacities of the 5 myeloid mononuclear cell subsets we classified above were evaluated within the peritoneal cavity. We injected either soluble (FITC-OVA) or particulate (YGM) forms of fluorescently labeled Ags into the peritoneal cavity. An hour after injection, endocytosis of FITC-OVA or phagocytosis of YGM beads by the 5 myeloid mononuclear cell subsets were assessed respectively and compared to one another (Fig. 2B and C). As expected, LPMs were the most active in both endocytosis and phagocytosis. Compared to LPMs, the other populations were much poor in endocytosis and phagocytosis. However, the activities of both endocytosis and phagocytosis by SPMs and P-IV.II cells were similar and significantly higher than those by DCs and P-IV.I cells (Fig. 2B and C).
Comparison of Ag-presenting ability to stimulate naïve T cells
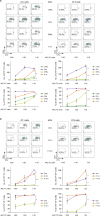
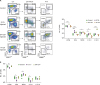
A key functional difference between DCs and macrophages is determined by the outcome of Ag uptake; i.e., DCs are efficient in processing and presenting Ags to responding T cells whereas macrophages are much less efficient (3435). To evaluate the difference in Ag-presenting ability, soluble OVA protein was injected into the peritoneal cavity, and the peritoneal exudate cells were harvested after an hour and were sorted by flow cytometry into the subsets of myeloid mononuclear cells. Then, the subsets of cells isolated from the OVA-pulsed peritoneal cavity were assessed for their ability to stimulate naive T cells in vitro using OVA-specific OT-1 (CD8) and OT-2 (CD4) T cell receptor transgenic mice (3637). First, OVA-pulsed LPMs, DCs, SPMs, and P-IV cells were separated and examined for their ability to stimulate CD8+ OT-1 and CD4+ OT-2 T cells. Although all the subsets of peritoneal myeloid mononuclear cells showed similar levels of MHC I expression (Supplementary Fig. 1), it was evident that DCs were most capable of cross-presenting OVA Ag and thus strongly inducing the proliferation of CD8+ OT-1 T cells (Fig. 3A, left panels). P-IV cells were also efficient in stimulating OT-1 T cells although weaker than DCs. Meanwhile, both LPMs and SPMs were poor in cross-presenting OVA Ag to CD8+ OT-1 T cells. Similarly, CD4+ OT-2 T cells were used to evaluate the Ag presentation of OVA via MHC II molecules (Fig. 3A, right panels). Among the MHCII+ subsets, DCs were the most potent in stimulating responding OT-2 T cells and P-IV cells were weaker but SPMs were very poor. However, LPMs were completely incompetent to induce the proliferation of OT-2 T cells even in the highest APC to T cell ratio, likely because of the MHCII−/lo phenotype of LPMs. These data imply that P-IV cells might contain a DC-like subpopulation. Therefore, we compared the Ag-presenting ability between P-IV.I and P-IV.II subsets (Fig. 3B). To our surprise, P-IV.I cells were able to stimulate both CD8+ OT-1 and CD4+ OT-2 T cells as efficiently as or better than peritoneal DCs. Meanwhile, like other peritoneal macrophage subsets, P-IV.II cells were unable to induce the proliferation of responding T cells.
Figure 3
Comparison of Ag-presenting ability to stimulate naïve T cells. (A, B) 1.5 mg of OVA Ag are injected i.p. After 1 h, peritoneal exudate cells are harvested and sorted by flow cytometry according to the gates as in Fig. 1. Isolated cells in each subset are cultured with 25,000 CTV-labeled OT-1 or OT-2 T cells in the indicated APC:TC ratio. The numbers and percentages of CTVlo proliferated OT-1 and OT-2 T cells are analyzed on day 3 and day 4 respectively. Representative flow cytometric plots of OT-1 (left panels) and OT-2 (right panels) TCs are shown. Data are shown from more than 2 independent experiments. Error bars indicate mean±SEM across multiplicate sample.
TC, T cell; CTVlo, low level CTV.
*p≤0.05; **p≤0.01; ***p≤0.001; ****p≤0.0001.
Distinct differentiation of T cells by peritoneal APCs
We investigated the functional difference between 2 robust APCs, i.e., DCs and P-IV.I cells by analyzing the activation status of proliferated T cells following co-culture with the respective APCs. Activated T cells are considered to upregulate CD25, CD69, and CD44 and to downregulate CD62L (35). Compared to peritoneal DCs, P-IV.I cells induced both OT-1 and OT-2 T cells with less activated phenotypes (Fig. 4A). In particular, Ag-specific T cells stimulated by P-IV.I cells contained fewer fractions of CD25+, CD69+, or CD62L− cells than those stimulated by peritoneal DCs.
Figure 4
Distinct differentiation of T cells by peritoneal APCs. As in Fig. 3, from mice treated with OVA Ag, peritoneal APCs, i.e., DCs and P-IV.I cells, are sorted by flow cytometry. Isolated 2,500 cells of respective APCs are co-cultured with 25,000 OT-1 or OT-2 T cells for 3 or 4 days respectively. (A) Proliferated T cells are stained and analyzed for specific markers, CD25, CD69, CD44, and CD62L. Cells with indicated phenotypes (i.e., CD25+, CD69+, CD44+, and CD62L−) and their respective percentages among the proliferated (i.e., CTVlo) T cells are gated and denoted in representative flow cytograms. Bar graphs are drawn from triplicate samples. (B, C) PMA, ionomycin and brefeldin A are treated for the last 4 h of culture. Indicated cytokines are stained intracellularly. Represented flow cytometric plots of live CTVlo CD8+ OT-1 (B) or CD4+ OT-2 (C) T cells are shown. Bar graphs illustrate the frequencies of described cytokine producing OT-1 (B) and OT-2 (C) T cells among total proliferated T cells. (D) hTGF-β and/or ATRA are added to the wells containing OVA-laden APCs and OT-2 T cells. Foxp3 is stained intracellularly followed by the staining and fixation of surface molecules. Live CTVlo CD4+ T cells are shown, and iTreg cells are gated and denoted with frequencies. Representative data are shown from at least 2 independent experiments. Error bars indicate mean±SEM across multiplicate sample.
CTVlo, low level CTV; NS, not significant.
*p≤0.05; **p≤0.01; ***p≤0.001; ****p≤0.0001.
DCs can modulate the type of immune response through mediating the activation and differentiation of naïve T cells, and the type of functionally differentiated T cells are classified on the profiles of cytokines they secrete (383940414243). To check whether peritoneal DCs induce a specific type of T cell response, we performed an intracellular staining of cytokines. When OVA-laden peritoneal APCs were cultured with CD8+ OT-1 T cells, DCs were able to generate a higher frequency of IFN-γ producing Tc1 cells than P-IV.I cells (Fig. 4B). However, both DCs and P-IV.I cells induced neither IL-4 producing Tc2 nor IL-17a producing Tc17 cells. In the co-culture with CD4+ OT-2 T cells, a higher frequency of IFN-γ+ Th1 cells was produced by DCs than P-IV.I cells, but IL-4 and IL-17a, the signature cytokines of Th2 and Th17 cells, were not detected (Fig. 4C). It is known that when Ag-laden APCs and responding naïve T cells are cultured under specifically conditioned media, T cells are preferentially converted to particular types of Tc or Th cells (28303344). Hence, we tested the culture of peritoneal APCs and naïve T cells under differently conditioned media (Supplementary Fig. 2). With the addition of LPS, both DCs and P-IV.I cells produced comparable levels of IFN-γ+ Tc1 and Th1 cells. Similarly, both DCs and P-IV.I cells exhibited a comparable ability to induce IL-4+ Tc2/Th2 and IL-17a+ Tc17/Th17 under pertinent conditions.
Our data indicated that T cells stimulated by P-IV.I cells possessed less activated phenotypes than those stimulated by DCs. Therefore, we examined whether DCs and P-IV.I cells had different ability to promote immunological tolerance by generating iTreg cells. DCs are known to induce FOXP3+ iTreg cells in vitro when cultured with naïve T cells in the media conditioned with TGF-β and/or ATRA (3132). Both peritoneal DCsand P-IV.I cells rarely produced iTreg cells in the culture medium without any supplements (Fig. 4D). However, when TGF-β and/or ATRA were added to the culture media, both DCs and P-IV.I cells strongly iTreg cells. Especially when both TGF-β and ATRA were included in the culture, P-IV.I cells produced iTreg cells more potently and in a higher frequency than DCs. With both TGF-β and ATRA supplemented, OVA-laden P-IV.1 cells could make nearly 50% of proliferated OT-2 T cells differentiate into iTreg cells, which was a frequency almost twice as higher than peritoneal DCs iTreg cells in the same condition (Fig. 4D). Interestingly, under these conditions, more of the proliferated high level of CD25 OT-2 T cells induced by P-IV.I cells were FOXP3+ than those induced by peritoneal DCs (Fig.4D).
Influence of hematopoietic cytokines on the development of subpopulations
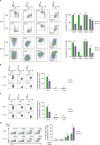
Since P-IV.I cells were potent peritoneal APCs expressing significant levels of CD115 (Supplementary Fig. 3), the receptor for a key hematopoietic cytokine M-CSF, we investigated the role of different hematopoietic cytokines in the development of myeloid mononuclear cells in the peritoneal cavity. First, we examined the effect of M-CSF, GM-CSF, and FLT3L by injecting each hematopoietic cytokine. After 3 to 5 daily injections of the respective cytokines to mice, peritoneal exudate cells were harvested and analyzed (Fig. 5A). Interestingly, the administration of M-CSF to mice did not cause any changes in the numbers of not only CD115− DCs and LPMs but also CD115+ SPMs, P-IV.I, and P-IV.II cells. Meanwhile, the injection of either GM-CSF or FLT3L augmented the numbers of DCs and P-IV.I cells, whereas the injection of only GM-CSF, not FLT3L, increased the numbers of LPMs, SPMs, and P-IV.II cells. Especially, the increase in the number of P-IV.II cells by the injection of GM-CSF was quite dramatic (Fig. 5A).
Figure 5
Influence of hematopoietic cytokines on the development of peritoneal myeloid mononuclear subsets. Mice are injected subcutaneously with a hematopoietic cytokine daily for 3 (for GM-CSF) to 5 (for FLT3L and M-CSF) consecutive days. (A) Representative flow cytometric plots of peritoneal myeloid mononuclear subsets are shown from the mice treated with each hematopoietic cytokine. Numbers indicate frequencies of gated cells in each population. Data in graph are calculated from at least 3 mice, and each dot represents a mouse. (B) Numbers of cells in peritoneal myeloid mononuclear subsets are detected from FLT3−/− and GM-CSF−/− mice. Data in graph are calculated from at least 3 mice, and each dot represents a mouse. Error bars indicate mean±SEM across multiplicate sample.
*p≤0.05; **p≤0.01; ***p≤0.001; ****p≤0.0001.
To further verify the roles of hematopoietic cytokines tested above, we also evaluated the number of subpopulations in peritoneal myeloid mononuclear cells from FLT3 knockout (KO) and GM-CSF KO mice (Fig. 5B). In GM-CSF KO mice, no significant changes were observed in the numbers of all subpopulations. In FLT3 KO mice, however, the numbers of LPMs, DCs, and P-IV.I cells decreased while the number of SPMs increased. Unlike the other subpopulations, the number of P-IV.II cells was not affected in FLT3 KO mice.
Gene expression profiles of MHCII+ peritoneal myeloid mononuclear cells
To systematically analyze the differences and similarities among the 5 subsets of MHCII+ peritoneal myeloid mononuclear cells, including DC1 and DC2 subpopulations (Fig. 6A), RNA samples were prepared from these peritoneal cell subsets and subjected to global mRNA-seq. The main principal components analysis identified 4 distinct clusters among the 5 subsets of MHCII+ peritoneal myeloid mononuclear cells (Fig. 6B); peritoneal DC1s, DC2s, and P-IV.I cells formed separate clusters, but SPMs and P-IV.II cells clustered indistinguishably close to each other. Meanwhile, P-IV.I cells clustered closer to DC2s than either DC1s or SPMs (Fig. 6B).
Figure 6
Comparison of gene expression profiles of MHCII+ peritoneal myeloid mononuclear cell subsets. (A) The gating strategy to categorize peritoneal DC subsets. Peritoneal DCs, gated as in Fig. 1A, are further divided into DC1 and DC2 subsets by the surface expression levels of XCR1 and CD11b. RNA-Seq is performed with mRNA samples from the respective subsets of MHCII+ peritoneal myeloid mononuclear cells isolated by flow cytometric sorting on the gating strategies as in Figs. 1A and 6A. (B) Multidimensional scaling analysis of principal components from RNA-Seq profiles of MHCII+ peritoneal myeloid mononuclear cell subsets. (C-F) Heat maps show the genes differentially expressed among MHCII+ peritoneal myeloid mononuclear cell subsets. Heat maps for the differential expression of genes related to macrophages (C), cDCs (D), DC-associated transcription factors (E), and monocytes/MoDCs (F) are shown. The color scale represents the row Z score.
cDC, classical DC.
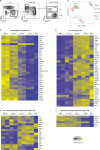
As expected from the result of principal components analysis above, the gene expression profile of P-IV.II cells was highly similar to that of SPMs. Especially, most of the macrophage core signature genes (45) were induced in both SPMs and P-IV.II cells (Fig. 6C). In the meantime, P-IV.I cells were found to upregulate the expression of a significant number of conventional DC core signature genes (46) as similarly to peritoneal DC2s (Fig. 6D). To better characterize the relationship between P-IV.I cells and DC subsets, we also analyzed the different expressions of transcription factors involved in DC development. The expression of transcription factors involved in DC2 development such as RELB, IFN regulatory factor 4 (IRF4), and neurogenic locus notch homolog protein 2 (NOTCH2) (46) were elevated in both DC2s and P-IV.I cells compared to DC1s (Fig. 6E). The transcription factors involved in DC1 development such as BATF3 and IRF8 (46) were expressed more in peritoneal DC1s than DC2s or P-IV.I cells (Fig. 6E). Then, we also examined the expression profile of the genes associated with monocytes and/or monocyte-derived DCs (MoDCs) (4748). None of the MHCII+ peritoneal myeloid mononuclear cell subsets expressed detectable levels of Ly6C, a monocyte marker, according to RNA-Seq data (data not shown). MoDCs in LPS-inflamed lymph nodes were found to express CD14, CD206, and CD209a (4748). It is noticeable that both DC2s and P-IV.I cells expressed significantly elevated levels of CD209a compared to the other subsets, but the expression of CD14 and CD206 was not particularly upregulated in P-IV.I cells (Fig. 6F).
DISCUSSION
Although many investigators addressed the heterogeneity of peritoneal macrophages (16171949), there has been no study that clearly distinguished various subsets of DCs and macrophages in the peritoneal cavity. Interestingly, those studies showed the existence of peritoneal cells expressing the markers for both monocytes (CD115) and DCs (CD11c and MHC II). In the current study, we classify the peritoneal myeloid mononuclear cells into 5 subsets which include LPMs, DCs, SPMs, and 2 additional subpopulations with MHCII+CD11c+CD115+ phenotypes. The 2 subsets of MHCII+CD11c+CD115+ cells are distinguished based on their differential expression of CD14 and CD206. In summary, the 5 distinct populations in the peritoneal cavity are 1) ICAM2+F4/80hiMHCIIlo LPMs, 2) ICAM2−CD115−CD11c+MHCII+ DCs, 3) ICAM2−CD115+CD11c−MHCII+ SPMs, 4) ICAM2−CD115+CD11c+CD14−CD206−MHCII+ P-IV.I cells, and 5) ICAM2−CD115+CD11c+CD14+CD206+MHCII+ P-IV.II cells.
From a morphological point of view, LPMs, SPMs, and P-IV.II cells exhibit adherent, macrophage-like appearances whereas DCs and P-IV.I cells show a non-adherent, dendritic morphology. In terms of endocytosis and phagocytosis, LPMs are far more potent than any other subset. Meanwhile, SPMs and P-IV.II cells are similarly more active than DCs and P-IV.I cells in endocytosis and phagocytosis. Out of these 5 subsets, only DCs and P-IV.I cells are capable of presenting Ags and thus stimulating naïve T cells into proliferation. Besides, both DCs and P-IV.I cells are likewise able to induce the differentiation of T cells following their Ag presentation. In addition to the morphological and functional similarities, the development of DCs and P-IV.I cells is also influenced similarly by the hematopoietic cytokines FLT3L and GM-CSF.
As previously reported (1719), peritoneal DCs were largely low level of CD226 and resistin-like molecule α (RELMα) while SPMs were mainly high level of CD226 and RELMα. Our present study demonstrated that the expression levels of both CD226 and RELMα in P-IV.I cells were significantly lower than those in P-IV.II cells (Figs. 1B and 6C), implying that P-IV.I cells are related to peritoneal DCs and P-IV.II cells to SPMs. Our analysis of transcriptomes in MHCII+ peritoneal myeloid mononuclear cell subsets revealed that the expression of many DC signature genes, including FLT3, ZBTB46, RELB, IRF4, and NOTCH2, was elevated in P-IV.I cells, more closely resembling peritoneal DC2s than DC1s. In general, multidimensional scaling analysis of gene expression profiles indicates that P-IV.I cells are closely related to peritoneal DC2s, whereas P-IV.II cells are quite identical to SPMs. Previously, Bain et al. (17) demonstrated that the generation of peritoneal monocytes and SPMs are dependent on CCR2 expression in bone marrow (BM) cells; CD11c+CD115+ P-IV cells are partially dependent on CCR2; while peritoneal DCs are independent. Therefore, based on our gene expression profiles, we speculate that the generation of P-IV.II cells, like SPMs, might be dependent on BM monocytes in a CCR2 dependent manner. Meanwhile, the expression of CD209a, a marker of MoDCs, was highly induced in both peritoneal DC2s and P-IV.I cells, suggesting that significant fractions of both peritoneal DC2s and P-IV.I cells might consist of MoDCs.
In the present study, both DCs and P-IV.I cells were equally effective in stimulating naïve T cells into proliferation, but those T cells differentiated by DCs and P-IV.I cells exhibited different phenotypes. Especially, T cells differentiated by P-IV.I cells displayed reduced expression levels of CD25 and CD69 and elevated levels of CD62L, compared to those differentiated by DCs, indicating that the T cells proliferated by P-IV.I cells are less activated. Besides, P-IV.I cells are found to possess the ability to produce FOXP3+ iTreg cells better than peritoneal DCs. All in all, these findings highlight the possibility that P-IV.I cells are a distinct, tolerogenic subset of DCs in the peritoneal cavity.
 XML Download