

 PDF
PDF ePub
ePub Citation
 Print
Print


Introduction
Cone-beam computed tomography (CBCT) has become an indispensable imaging technology in dental practice. CBCT imaging provides a higher spatial resolution and a lower exposure dose than multi-detector computed tomography (MDCT) imaging.1 Furthermore, CBCT images provide better image quality than conventional radiographs and complement their limitations. However, the radiation doses from CBCT examinations are generally higher than those from conventional radiographs.234 Depending on the CBCT scanner and imaging settings selected, the effective dose of a CBCT examination can be from 4 to 78 times higher than that of a panoramic radiograph.56 Therefore, in order to protect patients from radiation, the optimization of CBCT is essential.7
Differences exist in the required radiation dose and image quality for various diagnostic tasks, such as periapical diagnosis, detection of sinus pathology, and implant planning. Exposure parameters, such as tube voltage, tube current, exposure time, rotation arc, and field of view (FOV) size, affect the radiation dose and the image quality.1 Recent advances in CBCT technology have led to the proposal of several dose reduction strategies, such as decreasing the FOV size and tube current-exposure time product (mAs).48 However, decreasing the radiation dose may entail degrading the image quality. Therefore, it is important to perform examinations using doses that are as low as diagnostically acceptable (ALADA), without loss of adequate image quality. Furthermore, CBCT machines used for dental imaging have a variety of radiation doses and image qualities, and findings concerning optimization are often limited to the studied type of scanners.9101112 For the optimization of these diverse machines, Al-Okshi et al.4 emphasized that a standardized method to evaluate image quality is essential.
The clinical evaluation is usually used as the gold standard for assessing image quality according to the diagnostic task. Many studies have used skulls or patient data to evaluate 1 or more aspects of CBCT image quality.9131415 Although these studies are clinically relevant, it is difficult to standardize the results of studies that use skulls or patient data.13 For these reasons, a quality control phantom for CBCT was recently developed as part of the SedentexCT project.16 Additionally, some studies have used geometric phantoms.1410 Although those methods are useful for device comparison and quality control, there is no direct way of translating these results to clinical image quality. Therefore, it is essential to study the relationship between the clinical evaluation and physical factors for the development of a standardized method.7
The physical factors of contrast resolution, spatial resolution, and image noise are related to the clinical image quality in MDCT.717 Contrast resolution refers to the ability to detect very subtle changes in gray scale and distinguish them from the noise in the image.18 Spatial resolution refers to the capability of an imaging system to resolve fine details of the object being studied.19 Image noise is random variation of brightness that broadly interferes with the ability to detect a signal in images. Additionally, metal artifacts can affect the image quality of CBCT. If metal is present in the FOV, CBCT imaging is inherently vulnerable to the beam hardening phenomenon. This artifact may degrade the clinical image quality and reduce the diagnostic accuracy.20
The aim of this study was to investigate the effect of exposure parameters on image quality obtained using a CBCT scanner and the relationship between physical factors and the clinical evaluation depending on the diagnostic task.
Materials and Methods
All CBCT images were obtained using an Alphard 3030 CBCT scanner (Asahi Roentgen Industrial Corporation, Kyoto, Japan). The scanner has an amorphous silicon flat panel detector. A voxel size of 0.39 mm×0.39 mm×0.39 mm was used. An X-ray beam was rotated 360° around the phantom, and the exposure time was 17 seconds. A total filtration of 2.8 mm aluminum was used.
A FOV of 200 mm×179 mm was used to obtain the whole image of the SedentexCT IQ phantom (SedentexCT IQ, Leeds Test Objects Ltd., North Yorkshire, UK). To obtain images with different image qualities, 28 combinations of 4 different tube voltages and 7 different tube currents were used for a SedentexCT IQ phantom and a real skull phantom (78, 80, 85, and 90 kVp; and 2, 3, 4, 5, 6, 7, and 8 mA). Images obtained using the CBCT machine were saved in the Digital Imaging and Communications in Medicine (DICOM) format.
Physical measurement of the image quality
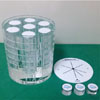
To measure the physical image quality, CBCT images of a SedentexCT IQ phantom were obtained under 28 exposure combinations. This phantom is a head-sized cylindrical polymethyl methacrylate (PMMA) phantom (diameter: 160 mm; height: 162 mm). The base part (height: 22 mm) of the phantom is made of uniform PMMA. The upper part of the phantom contains 6 layers of 7 cylindrical inserts (diameter: 35 mm; height: 140 mm) positioned at the center and periphery arranged in a regular hexagon (Fig. 1). With the upper part and the base part, a total of 5 image quality parameters were tested. A list of the image quality parameters that were measured using the phantom is presented in Table 1.
All images were scanned 3 times, and under each exposure condition, a total of 227 slices of the axial images were analyzed using Radia diagnostic software version 1.10 (Radiological Imaging Technology Inc., Colorado Springs, USA). All images were analyzed, and all measured values were statistically processed.
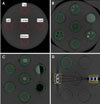
Image noise was measured on the obtained images by scanning the base part of the phantom. On the axial slice images, 5 circular regions of interest (ROIs) were placed at the center and periphery (top, left, right, and bottom) of the FOV (Fig. 2A). Image noise was also calculated using the differences in the standard deviations between the ROIs.
In the phantom, the contrast resolution layer has 5 inserts. Each insert contains rods measuring 1.0 mm, 2.0 mm, 3.0 mm, 4.0 mm, and 5.0 mm in diameter made of aluminum, polytetrafluoroethylene (PTFE), Delrin, low-density polyethylene (LDPE), and air. The aluminum insert simulates dentin, the PTFE insert simulates dense bone, the LDPE insert simulates soft tissues, and the air simulates air cavities (Fig. 2B). The contrast-to-noise ratio (CNR) and the number of detected PTFE, Delrin and LDPE rods were calculated by the Radia diagnostic software.
To measure the line pair (LP) chart, alternating aluminum/polymer chart inserts (1.0, 1.7, 2.0, 2.5, 2.8, 4.0, and 5.0 line pairs per mm) were used (Fig. 2C). Two inserts of the spatial resolution layer were used to analyze the XY-plane and the Z-axis. A line spread function (LSF) insert is located on the sharp edge of the PMMA/PTFE interface (Fig. 2C). Modulation transfer function (MTF)-50 and MTF 10 values were obtained from the LSF using the Radia diagnostic software.
To measure the extent of metal artifacts, 2 types of inserts were used. One contained 3 titanium rods aligned parallel to the phantom radius and the other contained 3 rods aligned perpendicular to it. The average voxel values of each of the 4 boxes located in the vicinity of the rods in the images were calculated. Then, the difference between the average voxel value of each box and the average voxel value of the background level was calculated by the Radia diagnostic software (Fig. 2D).
Subjective evaluation of image quality
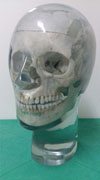
To evaluate the subjective image quality, CBCT images of a real skull phantom with a soft-tissue replica (X-ray skull phantom, Erler Zimmer Co., Lauf, Germany) were obtained under the same combinations of tube voltage and current with a SedentexCT IQ phantom (Fig. 3). All images were saved in DICOM format and underwent reconstruction into axial, coronal, and sagittal planes with a slice thickness of 1 mm.
Six oral and maxillofacial radiologists observed all images for the subjective evaluation, using 21-inch medical display monitors (WIDE 3 mega CX30P, WIDE Co., Yongin, Korea) with a resolution of 2048×1536 pixels. All observers had a trial session before the evaluation, and the evaluation was carried out individually at random and in an irreversible order. The observers were not aware of the exposure conditions, but were allowed to adjust the brightness and the contrast settings. There were no limitations on the observation time.
Each observer first assessed the palatal root area of the right maxillary first molar and then evaluated the distal root area of the left mandibular second molar. In the maxillary tooth area, the assessment items were as follows: clear lamina dura and periodontal ligament space, clear inferior border of the maxillary sinus, clear buccal and palatal cortical plates, clear trabecular pattern, image quality sufficient for periapical diagnosis, and image quality sufficient for implant planning. In mandibular tooth area, the following items were evaluated: clear lamina dura and periodontal ligament space, clear border of the mandibular canal, clear border of the marginal bone crest, clear trabecular pattern, image quality sufficient for periapical diagnosis, and image quality sufficient for implant planning. The observers were instructed to assess each structure in the entire image, rather than to focus on a specific region. The purpose of the assessments related to the anatomical landmarks was to allow the observers to focus on structures related to the diagnostic tasks. In fact, the results were based on 2 diagnostic assessment points. For all assessments, the following 5-point rating scale was used: certainly agree (5), agree (4), neither agree nor disagree (3), disagree (2), certainly disagree (1). The assessment was repeated 3 times with an interval of 2 weeks to calculate the intraobserver reliability. The interobserver reliability was also calculated.
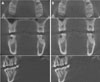
The observers classified the image quality as acceptable or unacceptable, using the average observer score criterion (Fig. 4). Acceptable images were those with an average score of 3.5 or higher, which was the cut-off between the acceptable and unacceptable image quality groups.
Statistical analysis
The relationship between exposure parameters (tube voltage, tube current), physical factors and observer scores was evaluated.
The intraobserver and interobserver reliability for the 6 observers was calculated using intraclass correlation coefficients (ICCs). The ICC values were interpreted according to Landis and Koch's guidelines, as follows:21 ICC<0.20=slight agreement, ICC 0.21–0.40=fair agreement, ICC 0.41–0.60=moderate agreement, ICC 0.61–0.80=substantial agreement, and ICC 0.81–1.0=almost perfect agreement.
The Mann-Whitney U test was used to evaluate the differences in tube voltage and tube current between the acceptable and unacceptable images. The independent t-test was used to evaluate the differences in the results of the image noise, CNR, rod visibility test, LP chart, MTF, and metal artifact tests between the acceptable and unacceptable image quality groups. For physical factors with significant differences, a receiver operating characteristic (ROC) curve was used to determine the cut-off values.
All statistical analyses were performed using IBM SPSS Statistics version 25.0 (IBM Corp., New York, NY, USA). A statistical significance level of P<0.05 was used.
Results
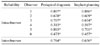
In the subjective evaluations, the intraobserver reliability was statistically significant in all cases. The interobserver reliability was statistically significant for both diagnostic tasks (Table 2).
Subjective evaluation and the effects of tube voltage and tube current on image quality
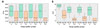
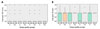
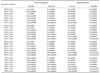
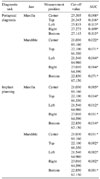
The classification of images according to the subjective evaluations is presented in Table 3. The differences in tube voltage and tube current between the acceptable and unacceptable image quality groups are shown in Figure 5. In both the maxilla and the mandible, for periapical diagnosis and implant planning, the tube current of the acceptable images was significantly higher than that of the unacceptable images (P<0.05). In all cases, the area under the curve (AUC) was higher than 0.5 and the significance level was below 0.05, suggesting that the cut-off values were useful for distinguishing between acceptable and unacceptable images (Table 4). However, the tube voltage of the acceptable images did not show statistically significant differences from that of the unacceptable images (P>0.05). This result implies that tube current has a major influence on periapical diagnosis and implant planning in the maxilla and the mandible.
Relationships between physical factors and clinical image quality
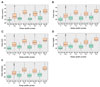
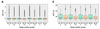
In the maxilla and the mandible, for periapical diagnosis and the implant planning, image noise showed statistically significant differences between the acceptable and unacceptable image quality groups (P<0.05) (Fig. 6). For all cases, significantly more image noise was present in the unacceptable images than in the acceptable images. However, in all cases, the AUC was lower than 0.5, suggesting that the cut-off values were not useful (Table 5).
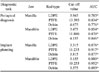
In the maxilla and the mandible, for periapical diagnosis and the implant planning, the CNR for LDPE, PTFE, and Delrin showed statistically significant differences between the acceptable and unacceptable image quality groups (P<0.05) (Fig. 7). In all cases, the CNR values of the acceptable images were significantly higher than those of the unacceptable images. All the AUCs were higher than 0.5 and all of the significance levels were below 0.05, suggesting that the cut-off values were useful (Table 6).
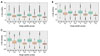
The results of the rod visibility tests varied depending on the material of the rod. In some cases, the results showed statistically significant differences between the acceptable and unacceptable image quality groups (Fig. 8).
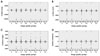
The results of the line pair chart analysis are shown in Figure 9. The results for the Z-axis showed statistically significant differences between the acceptable and unacceptable image quality groups (P<0.05). All the Z-axis results in the acceptable images were significantly lower than those in the unacceptable images. In the ROC analysis, all the AUCs were lower than 0.5, suggesting that the cut-off values were not useful (Table 7).
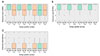
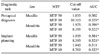
In all cases, the MTF 50 and MTF 10 showed statistically significant differences between the acceptable and unacceptable image quality groups (P<0.05) (Fig. 10). The values of the acceptable images were significantly higher than those of the unacceptable images. In the ROC curves of the MTF 10, all the AUCs were higher than 0.5 and all the significance levels were below 0.05, suggesting that the cut-off values were useful (Table 8).
The results of the metal artifact tests are shown in Figure 11. In all cases, there were no statistically significant differences in the results of the metal artifact tests between the acceptable and unacceptable image quality groups (P>0.05).
Discussion
In this study, the effects of tube voltage and current on technical and clinical image quality was assessed. To evaluate the effects of tube voltage and current on the technical image quality, physical factors associated with image noise, contrast resolution, spatial resolution, and metal artifacts were used. Contrast resolution was measured using the CNR and rod visibility tests, while spatial resolution was measured by means of a LP chart and the MTF using an LSF insert.
Image noise can be affected by factors such as the tube system (filtration, focal spot size, and FOV size), exposure parameters (tube voltage [kVp] and current [mA]), the object size, the efficiency of the detector, and reconstruction factors (filtering, voxel size).48 In this study, as the other factors were fixed, the noise values were only affected by differences in tube voltage and current. Generally, image noise decreases as tube voltage and current increase, because the detector signal increases. Pauwels et al.22 insisted that low-dose protocols should consist of current reduction, rather than tube voltage reduction, because the increase in noise for a given dose reduction would be smaller. However, Hidalgo Rivas et al.23 found that dose reductions to 50% less than the manufacturer's recommendations could be achieved by reducing the X-ray tube voltage (80%), and indeed for a range of combinations of tube voltage and current. The effect of tube voltage and current in CBCT has been investigated by several researchers, with most studies focusing on the effect of tube voltage and current reduction on image quality. Diverse results have been reported, depending on the criteria used to evaluate image quality, devices, exposure parameters, and the amount of dose reduction. Most studies have found that a considerable dose reduction using exposure parameters below manufacturers' default settings is possible with the image quality remaining adequate.2425262728293031 The results of this study support those results, as changes in the tube current showed a significant effect on image quality. In contrast, the tube voltage did not exert a significant influence on image quality. Therefore, dose reduction should not be done entirely by changing the current. Instead, by reducing the tube voltage, the radiation dose can be reduced without degradation of image quality.
To evaluate the effect of tube voltage and current on the contrast resolution of the image, the CNR and rod visibility tests were used. In conventional radiography, as tube voltage increases, both contrast and noise decrease. However, this dynamic of increased contrast at lower beam energies is not fully translatable to CBCT, because of the complementary information encoded by projectional data from many angles.2228 In addition, contrast resolution is affected by spatial resolution and noise.15 Therefore, it is difficult to define the relationship of the contrast resolution with tube voltage and current. Previous studies have measured the CNR to evaluate the technical image quality of CBCT images.1781222 Pauwels et al.8 found a clear hyperbolic relationship between CNR values and current. Choi et al.7 suggested investigating the relationship between CNR values and the results of the rod visibility test, because the rod visibility test would be more convenient and time-saving than measuring the CNR. Publication 93 of the International Commission on Radiologic Protection17 states that low-contrast resolution has a closer relationship to clinical image quality than high-contrast resolution because high-contrast resolution is not meaningfully influenced by an increase in the noise level. Bamba et al.1 reported that a contrast resolution phantom made of low-contrast materials such as LDPE, Delrin, and PTFE rods was useful for distinguishing between devices' performance in contrast resolution. They found that small-diameter rods made of low-contrast-resolution materials were not observed in some low-dose protocols. This study showed that the CNR values of the acceptable images were significantly higher than those of the unacceptable images for relatively low-contrast materials (LDPE, PTFE, Delrin). Nonetheless, the results of rod visibility tests obtained using Radia software varied according to the rod material.
Spatial resolution can be influenced by various factors, such as FOV size, tube current, noise, geometric accuracy, and voxel size.15 Brüllmann and Schulze19 reported that the line-pairs per millimeter (lp/mm) ranged between 0.61 lp/mm and 2.8 lp/mm in CBCT scanners according to the 9 articles that they reviewed. Bamba et al.1 reported the maximum line pairs distinguished using CBCT devices in their study was in the range of 1–3 lp/mm, depending on the exposure protocol. Furthermore, Pauwels et al.15 reported that the maximum line pairs varied according to the voxel size, FOV size and current. On that basis, they argued that the user should be able to select appropriate exposure protocols according to the various diagnostic requirements in dental practice. In this study, the results on the XY-plane ranged from 1 lp/mm to 2.5 lp/mm. The results on the Z-axis ranged from 0 l p/mm to 2 l p/mm. However, the results on the Z-axis of the acceptable images were significantly lower than those of the unacceptable images, which may have been due to decreased contrast between aluminum and the polymer at high radiation doses.
Suomalainen et al.12 revealed that the MTF at 10% modulation of their studied devices was a mean of 1.60 (±0.83) cycles per millimeter. Brüllmann and Schulze19 reported that in the 6 reports they reviewed, the MTF 10 values were in range of 0.5–2.3 cycles per millimeter with a median value of 2.1 cycles per millimeter. These data were acquired in experimental conditions using phantoms. The MTF 10 values in this study were in the range of 1.9–30.5 cycles per millimeter, with a median value of 7.5 cycles per millimeter. The range of the values obtained through the Radia software was much higher than the ranges reported in previous studies.1219 It is speculated that the Radia software might compute spatial resolutions from a single slice of image data without using an oversampling method, which probably led to the unreliable results.32 The short wire length of 16 mm limited the number of slices to only about 50 images, and the edge was too distorted to obtain an oversampled edge profile.32 However, due to the effects of the Nyquist theorem and other image-degrading factors, the spatial resolution in clinical situations is considerably lower than predicted.19 Furthermore, patient movement exceeding the voxel size further reduces the available spatial resolution. Although the MTF value can be influenced by tube current, the FOV diameter and voxel size affect it more strongly.10 However, it should not be considered that an instrument equipped with a smaller voxel size always leads to a higher spatial resolution. In fact, voxel size is only a very crude predictor of the available spatial resolution.1619 The spatial resolution of CT is affected by several parameters, including the collimation of the detector, density of the detector elements, helical pitch, reconstruction algorithm, and pixel size.33 This study proved that MTF 10 could be an important factor for subjective evaluations.
Metal artifacts were also measured in this study. Physical factors such as tube voltage, current, FOV size, and the reconstructed voxel size influence the quantities of metal artifacts in CBCT, as do the type of detector and reconstruction algorithms. According to Freitas et al.,20 increasing the tube voltage was effective for decreasing CBCT artifacts. Pauwels et al.34 reported there were no perceptible differences in the quantity of metal artifacts between high-current and low-current protocols for some CBCT devices. They also reported that artifact reduction by adjusting exposure parameters was possible to a very limited extent and was not clinically feasible. Schulze et al.35 argued that meaningful artifact reduction should be based on improvements of the reconstruction algorithms, because artifact reduction by increasing the FOV size and current is limited by the concomitant increase in the radiation dose. In all cases in this study, there were no statistically significant differences in the results of the metal artifact tests between the acceptable images and the unacceptable images. These results showed that the amount of metal artifacts was not significantly affected by exposure conditions.
This study demonstrated that clinical image quality can be maintained in lower exposure conditions than the parameters currently provided by the manufacturer. In addition, since tube current has a major influence on clinical image quality, optimization should be performed by reducing the tube voltage alone or the tube voltage and the tube current simultaneously within a certain range. The CNR and MTF 10 were also related to clinical image quality. Therefore, when establishing standardized objective criteria for measuring CBCT image quality, the CNR and MTF 10 should be measured.


 XML Download