

 PDF
PDF Citation
 Print
Print


Abbreviations
CVD
cardiovascular disease
PHQ-9
The Patient Health Questionnaire-9
MD
mild depression
MSD
moderate and severe depression
AOR
adjusted odds ratio
KNHANES
Korea National Health and Nutrition Examination Survey
HRA
health risk appraisal
ACRR
adjusted composite relative risk
CR
composite risk
CRR
composite relative risk
BMI
body mass index
WC
waist circumference
BP
blood pressure
FBS
fasting blood sugar
GFR
glomerular filtration rate
CI
confidence interval
HR
hazard ratio
MDD
major depressive disorder
OR
odds ratio
RR
relative risk
HPA
hypothalamic-pituitary-adrenal
BACKGROUND
Depressive disorder is a common mental illness and is considered a leading cause of major health problems worldwide [1]. Principal clinical manifestation of depression is recurring episodes of depressed mood, wherein each episode is marked by lowering of mood, reduction of energy and decrease in activity [2]. Until very recently, depression has been deemed a purely mental disorder whose clinical consequences fell solely in the hands of psychologists and psychiatrists [3]. But chronic depressive mood can lead not only to a mental illness but also to deteriorated physical health status [4]. Recent epidemiological studies have revealed that several metabolic disorders such as insulin resistance, established diabetes, alcoholism, inflammatory conditions and vascular disorders such as arterial hypertension may be associated with depression [3].
Cardiovascular disease (CVD) refers to those conditions such as coronary heart disease, cerebrovascular disease and peripheral arterial disease that affect the heart and blood vessels [5]. Depression is associated with changes in individuals’ health status that might in turn influence the development and progress of CVD and promote unhealthy behaviors of individuals at risk of developing CVD, such as tentativeness in modifying lifestyle, noncompliance with medical recommendations and predisposition to lifestyle choices like smoking cigarettes [67]. Several studies have shown depression and its associated symptoms to be major risk factors for both development of CVD and death after a myocardial infarction [8]. Depressed patients faced a significantly higher risk of cardiac morbidity and mortality even in an absence of a diagnosis of major depressive disorder (MDD) [9]. The strongest association was observed among the case of severe CVDs; during 6.6 years of follow up, the risk of CVD death and coronary death was found to be high among depressed people regardless of whether they were diagnosed with CVDs or not at the entry [10]. In addition, meta-analysis integrating longitudinal evidences from 21 studies involving over 120,000 subjects also suggested that depression results in a 80–90% increased risk of onset of CVD [11].
Now, although depression is considered as a known risk factor for CVD, as well as an independent predictor of poor prognosis following a cardiac event, the mechanistic relationship between the 2 remains unclear [6]. In addition, although there are many studies investigating the association between depression and CVD, most have scrutinized this relationship on a rather narrower and specific study population such as clinically diagnosed depressive patients, CVD patients or inpatients. By focusing our research on general population of Korea, we inspected the association between depression and CVD risk on a broader population, drawing a contrast in respect to previous researches. Further, we also aimed to seek association of depression with cardiovascular risk factors that were used as components of the formula for calculating CVD risk.
METHODS
Study population
The data from the first year (2016) of the 7th Korea National Health and Nutrition Examination Survey (KNHANES) was used in this study. The KNHANES is a nationwide, annual survey that is conducted since 1998 by the Korea Centers for Disease Control and Prevention. The target population comprises of national representatives of non-institutionalized civilians living in Korea. The sampling protocol follows a multi-stage clustered probability design. Each year's survey includes a new sample of approximately 10,000 individuals aged ≥ 1 year. Trained physicians, medical technicians and health interviewers conduct health interviews, health examinations, and nutritional surveys. The Patient Health Questionnaire-9 (PHQ-9) is administered to adults aged ≥ 19 years by trained interviewers [12].
Among 6,382 participants aged ≥ 19 years, 621 who did not complete the PHQ-9 were excluded. Then, as the reference data for calculating CVD risk were available only for adults whose age was ≥ 20 years, 59 participants who were 19 years old were excluded. Also, we excluded 394 participants who had missing values for calculating CVD risk. After the exclusion, 5,308 participants and their pertinent data remained for the analysis. All subjects who participated in the survey signed an informed consent form.
Measurement of depression
The PHQ-9 is a valid screening tool for diagnosing, monitoring of depression and measuring the severity of depression [1314]. The Korean version of PHQ-9, which was administered in the 2016 KNHANES, showed significant positive internal consistency (r = 0.88) and test-retest reliability (r = 0.60) among elderlies [15]. The PHQ-9 contains nine diagnostic criteria that measure the frequency of depressive symptoms as they happened over the last 2 weeks. The choice of responses for each diagnostic criterion is checked either as “not at all,” “on several days,” “on more than half of the days,” or “nearly every day” which are then scored on a scale of 0, 1, 2, and 3 respectively [16]. The sum of the scores from all nine criteria is then calculated; the sum ranges from 0 to 27, wherein the higher scores indicate more severe depression [17].
There were many studies investigating the valid cut-off value of PHQ-9 score that categorizes the severity of depression accurately. In Han et al.'s study [15], the sensitivity in diagnosing depression using the cutoff value of PHQ-9 score of 5 was 0.80, whereas the specificity was 0.78. Kroenke et al.'s study [13] showed that PHQ-9 scores of 5, 10, 15, and 20 represent valid and easy-to-remember thresholds demarcating the lower limits of mild, moderate, moderately severe and severe depression. A meta-analysis study suggests that the PHQ-9 was found to have acceptable diagnostic properties for detecting MDD for cut-off scores between 8 and 11; 15 of 18 validation studies reported a cut-off score of 10 [18]. So, referring to previous studies, participants were classified as such: normal group (PHQ-9 score: 0-4), mild depression (MD) group (PHQ-9 score: 5–9) and moderate and severe depression (MSD) group (PHQ-9 score: 10–27).
Calculation of CVD risk and details of incorporated cardiovascular risk factors
We calculated CVD risk by using health risk appraisal (HRA) model of national health screening program of Korea based on the data of 2016 KNHANES. HRA is a method of predicting or assessing future disease prevalence and mortality risk based on present health risk factors; the model was developed using the latest and pertinent studies to reflect the current health-related characteristics of Korean population and to improve the effectiveness of patient education and behavioral modifications [19]. We used adjusted composite relative risk (ACRR) from HRA model as individual CVD risk in evaluating differences of mean CVD risk among study groups. ACRR means the predicted possibility of future CVD occurrence of at-risk individuals compared to that of individuals who are of same sex and age but are without any apparent risk of CVD [20]. ACRR is calculated by dividing composite risk (CR) with composite relative risk (CRR). CR is calculated by the following method: for every individual risk factor's hazard ratio (HR) that exceeds one, one is subtracted from it, resulting value of which is summated with that of others, and basal HR of one is added the last (See Supplementary Table 1) [2021]. CRRs were calculated for men and women of pre-specified intervals of age utilizing sample cohort database of national health insurance corporation (See Supplementary Table 2) [22].
The cardiovascular risk factors included in HRA model are as follows: body mass index (BMI; kg/m2), waist circumference (WC; cm), smoking history (non-smoker/past smoker/current smoker), blood pressure (BP; mmHg), antihypertensive medication (yes/no), physical activity (times per week), fasting blood sugar (FBS; mg/dL), diabetes medication (yes/no), total cholesterol (mg/dL), glomerular filtration rate (GFR; mL/min/1.73 m2), proteinuria (none, trace, 1+/2+/3+ or above). However, while most of 2016 KNHANES data was gathered in intervals that would allow for their direct uses in HRA model, the data on the level of physical activities was not gathered in same intervals as used in HRA model; hence, we instead used the data on the level of aerobic physical activities from 2016 KNHANES. For the section regarding aerobic physical activities from 2016 KNHANES, responders were instructed to check “Yes” if they exercised more than either 150 minutes in moderate intensity or 75 minutes in high intensity during a week; they were instructed to check “No” if the duration fell short of aforementioned intervals. If they exercised in both intensities, then duration of exercise done in high intensity would be multiplied by 2 and added to duration of exercise done in medium intensity; the resulting sum would then be used in answering “Yes” or “No”. In substituting this calculated data of aerobic physical activities to the set intervals of physical activities specified by HRA model, “Yes” was matched to the intervals of ≥ 3 times per week, and “No” to ≤ 2 times per week, respectively.
Statistical analysis
All statistical analyses were performed using IBM SPSS Statistics Version 22 (IBM Corp., Armonk, NY, USA). To represent the general Korean population, sample weights constructed considering complexities of survey design, non-response rate of the target population, and post-stratification were applied to all analyses [12]. Study participants were divided to male and female groups for analysis because differences in cardiovascular risk between 2 sexes were already recognized in the risk stratification tools such as Framingham Risk Score and CHA2DS2-VASc score [23]. General linear model was used to analyze differences and the trend of mean CVD risk according to depression level. Adjusted odds ratios (AORs) were calculated by logistic regression to identify the association of depression with cardiovascular risk factors such as BMI, WC, smoking history, BP, antihypertensive medication, physical activity, FBS, diabetes medication, total cholesterol, GFR and proteinuria after adjusting for age, another well-known variable that influences CVD risk [24]. We set normal group as reference value for calculating AORs. The p-value less than 0.05 was considered statistically significant.
RESULTS
Participants' characteristics
Total number of male participants was 2,327 and its weighted number was 18,155,918. Total number of female participants was 2,981 and its weighted number was 17,824,553. Among men, weighted number of each group was 15,394,370 (84.8% of total male participants) for normal group, 2,068,195 (11.4%) for MD group and 693,352 (3.8%) for MSD group. Among women, weighted number of each group was 13,367,362 (75.0% of total female participants) for normal group, 3,198,640 (17.9%) for MD group and 1,258,551 (7.1%) for MSD group. Among men, average age of each group was 46.5 for normal group, 43.9 for MD group and 44.5 for MSD group. Among women, average age of each group was 48.4 for normal group, 46.5 for MD group and 51.3 for MSD group. The weighted number and proportion in percentage of participants falling into specified intervals of each category of cardiovascular risk factors are shown in Table 1.
Table 1
Weighted number and prevalence of participants according to cardiovascular risk factors
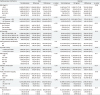
Values are expressed as weighted number (%).
Rounding off below decimal point was done in weighted number. Pearson's χ2 test was performed for test of independence.
MD group: mild depression group; MSD group: moderate and severe depression group; BMI: body mass index; WC: waist circumference; BP: blood pressure; SBP: systolic blood pressure; DBP: diastolic blood pressure; FBS: fasting blood sugar; GFR: glomerular filtration rate.
![]()
Differences of CVD risk according to the depression level
General linear model was implemented to figure out differences of CVD risk across the 3 groups divided according to PHQ-9 score; the results are shown in Table 2. Mean CVD risk of MSD group was significantly higher than that of normal group for both men and women (p < 0.01). Mean CVD risk of MD group was higher than that of normal group for both men and women; but the differences were not statistically significant. There was a tendency of CVD risk to increase as the degree of depression increased from normal to MSD groups for both men and women (p for trend < 0.01).
Table 2
Comparison of mean CVD risk among normal, MD and MSD groups and the trend of mean CVD risk according to depression level

| Depression level | Mean CVD risk | p-value | p for trend | |
|---|---|---|---|---|
| Men | < 0.01 | |||
| Normal | 0.99 ± 0.01 | |||
| MD | 1.01 ± 0.02 | 0.57 | ||
| MSD | 1.13 ± 0.04 | < 0.01 | ||
| Women | < 0.01 | |||
| Normal | 0.98 ± 0.01 | |||
| MD | 1.01 ± 0.02 | 0.08 | ||
| MSD | 1.11 ± 0.03 | < 0.01 | ||
Values represent means ± standard errors.
General linear model was used to analyze differences and the trend of mean CVD risk according to depression level.
CVD: cardiovascular disease; MD: mild depression; MSD: moderate and severe depression.
![]()
Logistic regression for cardiovascular risk factors
Logistic regression was carried out to reveal that depression was associated with cardiovascular risk factors; the results are shown in Table 3. Among men, MSD group was associated with increased risk for current smoking (AOR, 2.97; 95% confidence interval [CI], 1.78–4.97), taking antihypertensive medications (AOR, 2.42; 95% CI, 1.26–4.66), increased FBS (> 125 mg/dL; AOR, 2.37; 95% CI, 1.25–4.50) and taking diabetes medication (AOR, 3.08; 95% CI, 1.65–5.72). But MD group was only associated with increased risk for current smoking (AOR, 1.60; 95% CI, 1.18–2.17). Among women, MSD group was associated with increased risk for high BMI (≥ 25 kg/m2; AOR, 1.61; 95% CI, 1.11–2.32), large WC (≥ 85 cm; AOR, 1.63; 95% CI, 1.12–2.37), current smoking (AOR, 5.11; 95% CI, 3.07–8.52) and taking diabetes medication (AOR, 2.62; 95% CI, 1.68–4.08). However, MD group was only associated with increased risk for current smoking (AOR, 1.86; 95% CI, 1.18–2.93). In regards to proteinuria of male MD group, there was a limitation for analysis because the number of participants who had proteinuria (2+ or above) in that group was 0.
Table 3
AORs of cardiovascular risk factors according to depression level
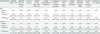
Values are expressed as AORs (95% confidence interval).
Logistic regression was performed to analyze after adjusting for age. In regards to proteinuria of male MD group, there was a limitation for analysis because the number of participants who had proteinuria (2+ or above) in that group was 0.
AOR: adjusted odds ratio; MD group: mild depression group; MSD group: moderate and severe depression group; BMI: body mass index; WC: waist circumference; BP: blood pressure; SBP: systolic blood pressure; DBP: diastolic blood pressure; FBS: fasting blood sugar; GFR: glomerular filtration rate.
![]()
DISCUSSION
While many studies have shown the association between depression and CVD in the past, most studies were carried out on very specific and select population such as patients who were diagnosed with depression or CVD or who were inpatients. Hence, focusing our research on the data that represents general population of Korea, we delved into the association between depression and CVD risk by comparing the mean CVD risk of normal, MD and MSD groups. Further, by calculating AORs of cardiovascular risk factors that are incorporated in calculating CVD risk in respect to MD group and MSD group compared to normal group, we tried to delineate the association of depression with each component.
Our study revealed that both male and female MSD groups faced a significantly raised mean CVD risk when compared to their normal counterparts. Further, there was a tendency for CVD risk to increase as the level of depression worsened in both men and women. We found that whether depression was diagnosed or not, depressive symptoms were associated with increased potential risk of CVD occurrence in general population of Korea. Also, depression was associated with cardiovascular risk factors such as high BMI, large WC, current smoking, taking antihypertensive medication, increased FBS and taking diabetes medication. Though limited findings on the association between depression and cardiovascular risk factors were shown in our study, we could find other studies that support the relationship between depression and those risk factors.
In this study, the relationship between age and depression is analyzed, looking for effects of maturity, decline, life-cycle stage, survival, and historical trend. The data are from a 1990 sample of 2,031 U.S. adults and a 1985 sample of 809 Illinois adults. The results show that depression reaches its lowest level in the middle aged, at about age 45. The fall of depression in early adulthood and rise in late life mostly reflects life-cycle gains and losses in marriage, employment, and economic well-being. Depression reaches its highest level in adults 80 years old or older, because physical dysfunction and low personal control add to personal and status losses. Malaise from poor health does not create a spurious rise of measured depression in late adulthood. However, some of the differences among age groups in depression reflect higher education in younger generations, and some reflect different rates of survival across demographic groups that also vary in their levels of depression.In this study, the relationship between age and depression is analyzed, looking for effects of maturity, decline, life-cycle stage, survival, and historical trend. The data are from a 1990 sample of 2,031 U.S. adults and a 1985 sample of 809 Illinois adults. The results show that depression reaches its lowest level in the middle aged, at about age 45. The fall of depression in early adulthood and rise in late life mostly reflects life-cycle gains and losses in marriage, employment, and economic well-being. Depression reaches its highest level in adults 80 years old or older, because physical dysfunction and low personal control add to personal and status losses. Malaise from poor health does not create a spurious rise of measured depression in late adulthood. However, some of the differences among age groups in depression reflect higher education in younger generations, and some reflect different rates of survival across demographic groups that also vary in their levels of depression.In a cross-sectional study on nationally representative samples from the 2005–2006 National Health and Nutrition Examination Survey of US, WC was significantly associated with both major depressive symptoms (odds ratio [OR], 1.03; 95% CI, 1.01–1.05) and moderate-to-severe depressive symptoms (OR, 1.02; 95% CI, 1.01–1.04) [25]. In the study using the data from WOBASZ study, a multi-center nationwide study of the Polish population’s health, men and women with depressive symptoms were not physically active than their counterparts without depressive symptoms [26]. In van Gool et al.'s study [27], depressed people were more likely to be smokers (OR, 1.71; 95% CI, 1.17–2.52). In the cohort study of US National Health and Nutrition Examination Survey I, a high level of depression remained an independent predictor of incident hypertension for whites aged 45 to 64 years (relative risk [RR], 1.80; 95% CI, 1.16–2.78) and blacks aged 25 to 64 years (RR, 2.99; 95% CI, 1.41–6.33) [28]. In a meta-analysis on the prevalence of comorbid depression in adults with diabetes, the risk of depression was twice higher in the diabetic group than in the non-diabetic group (OR, 2.0; 95% CI, 1.8–2.2) [29]. A study on the association between serum lipids level and MDD using data from the Netherlands Study of Depression and Anxiety showed that patients diagnosed with MDD exhibited unhealthier lipoprotein profiles such as lower HDL cholesterol level and higher triglyceride level when compared to patients with remitted MDD and individuals from the control group [30]. In addition, 568 participants diagnosed with chronic kidney disease but not requiring maintenance dialysis yet were recruited at a tertiary hospital in Southern Taiwan for a prospective observational cohort study; they were followed up for 4 years, and participants who exhibited a higher level of depressive symptoms had experienced more rapid reduction in GFR [31].
As evinced by findings from our study and aforementioned epidemiological studies, depression was associated with various cardiovascular risk factors. We assumed that this relationship could affect the association between depression and CVD risk because the method of estimating CVD risk was structurally dependent on the individual condition of those risk factors. Also, we could take into account of the possibility that other factors affected by depression were associated with CVD risk. Rottenberg et al. [32] suggested that depression was related to cardiac vagal control. Dysregulation of the autonomic nervous system could lead to development of the metabolic syndrome and CVD [333435]. Knorr et al. suggested that dysregulation of hypothalamic-pituitary-adrenal (HPA) axis was associated with depression [36]. Dysregulation of HPA axis in depression patients might increase cardiovascular mortality [37]. Dowlati et al. [3839] performed a meta-analysis and presented that proinflammatory cytokines, which reported as predictive factors of cardiovascular events, were higher in depressed people. Therefore, we could consider depression as one of the important risk factors of CVD.
This study has an advantage of representativeness since it used the KNHANES. Whereas previous studies concerning the association between depression and CVD were performed on select groups, such as clinically diagnosed patients and matched controls, this study was based on the data representative of Korean population. We showed not only that depression and CVD were associated but also that depression was associated with particular cardiovascular risk factors among general population of Korea.
Despite this strength, there are some limitations in this study. First, this study was a cross-sectional study, as it was based on observational data obtained from the KNHANES. While we can infer possibility of association between depression and CVD risk from the cross-sectional study, causality cannot be guaranteed. We also could not exclude the possibility of reverse causality; we should consider the bidirectional effect among depression, CVD and cardiovascular risk factors. Next, other factors that might affect both depression and CVD, such as family history or socioeconomic status, were not considered. Prospective longitudinal follow-up studies with considering these limitations are needed in the future.
CONCLUSIONS
We found that in general population of Korea, CVD risk was higher in MSD group than normal group and there was a tendency of CVD risk to increase as the degree of depression increased. Also, depression was associated with cardiovascular risk factors which were considered to calculate CVD risk and we assumed that this relationship could affect the association between depression and CVD risk. We suggest that depression is associated with increased risk for CVD occurrence in general population of Korea.
 XML Download