

 PDF
PDF ePub
ePub Citation
 Print
Print


INTRODUCTION
In many Western breast-cancer (BC) screening programs, digital mammography (DM) has replaced screen-film mammography (SFM) [123]; however, many SFM systems are still used globally. This transition was inevitable because DM has better accuracy than SFM [2] and because of the shortage of SFM supplies and film archives and the low costs associated with DM [4]. Many studies have also shown that detection rates are higher with DM than with SFM [15678] and that DM reduces the number of repeated tests owing to technical errors; however, other studies found no significant differences [910].
To date, several studies have narratively or systematically reviewed and compared the BC screening performance of DM and SFM [1281112]. Some quantitative reviews of these studies revealed that DM and SFM had statistically similar diagnostic performances for the overall screening population and that DM was significantly better for women aged < 50 years old or who had mammographically dense breasts [1112]. However, studies comparing the mammographic screening test performance pose unique design challenges, as they require distinct criteria to appropriately assess study quality and potential bias. Because of these challenges, the summarized results of these studies are subject to change over time owing to the publication of more recent data as well as improvements in technology.
Therefore, the objective of this systematic review and meta-analysis was to compare the diagnostic performance of DM and SFM in terms of test accuracy. Moreover, we aimed to assess and compare the accuracy of DM and SFM for BC screening by using recently published data.
METHODS
This systematic review was conducted according to the Preferred Reporting Items for Systematic Reviews and Meta-Analyses (PRISMA) guidelines [13].
Search strategy and study selection
We searched the MEDLINE, Embase, and Cochrane Library databases for articles published in English up to December 31, 2018. The search strategies were developed using combinations of free-text keywords and medical subject headings (MeSH), and we used similar search syntax across the other databases (Supplementary Table 1).
Two reviewers, who screened the titles and abstracts, evaluated every search hit for eligibility, and all potentially relevant articles were independently reviewed in full. In the case of a discrepancy in study selection, a consensus was reached through discussion. If no agreement could be reached, a third reviewer was consulted.
Studies were included if all of the following inclusion criteria were met: 1) paired studies, cohort studies, or randomized controlled trials (RCTs) comparing SFM and DM; 2) asymptomatic women aged 40 years or older who were enrolled in BC screening programs or for whom mammography was recommended; and 3) availability of sufficient data to construct 2 × 2 contingency tables for each mammography method. Studies were excluded if they assessed populations that are at a high risk of breast and/or ovarian cancer. Disagreements between the two reviewers were resolved through a consensus meeting with a third reviewer. If needed, we contacted the authors of the published studies for additional information.
Quality assessment and data extraction
Two separate observers independently evaluated the risk of bias of the included studies, using the Quality Assessment of Diagnostic Accuracy Studies 2 (QUADAS-2) instrument [14]. Disagreements were resolved via a joint review of the manuscript to reach consensus. When multiple articles for a single study were found, we used data from the most recent publication. Each item was scored as “yes,” “no,” or “unclear” if insufficient information was available to make an accurate judgment. Disagreements were resolved by the third reviewer. We used RevMan 5.3 software (The Cochrane Collaboration, Copenhagen, Denmark) to graphically display the quality assessment results.
To perform accuracy analyses, we extracted the relevant data from each study, including the first author's name, publication year, study location, sample size, description of the study population (age), study design (prospective, retrospective, or unknown), and consideration of the learning-curve effect. For each study, the values for true positive, false positive, false negative, true negative, sensitivity, and specificity results for the detection of BC were extracted.
Statistical analysis
We estimated the sensitivity and specificity, with 95% confidence intervals (CIs), of each selected study. The overall pooled sensitivity, specificity, positive likelihood (LR+), negative likelihood (LR−), diagnostic odds ratio (DOR), and area under the summary receiver-operating characteristic (SROC) curve (AUC) of DM and SFM were calculated using a bivariate random-effects model [15]. We also generated a hierarchical summary receiver-operating characteristic (HSROC) curve that plotted the individual and summary estimates of sensitivities and specificities, along with 95% CI and prediction region, and calculated the area under the HSROC curve [16].
Heterogeneity was assessed using the Cochran Q test and Higgins I2 heterogeneity index. We applied the random-effects model by using recently introduced bivariate mixed effects for diagnostic meta-analysis [17]. Several factors that could affect the diagnostic accuracy and cause heterogeneity were incorporated in the bivariate model to explore their influence on sensitivity and specificity. The following factors were evaluated: type of DM system (only full-field digital mammography [FFDM] or all DM, including computed radiography systems), enrollment of women younger than 50 years of age (yes or no), consideration of the learning-curve effect, initial year the digital mammogram was acquired, study design (prospective or retrospective), and study location (European countries or North America). We performed subgroup analyses to identify factors that influenced the diagnostic accuracy if four or more studies were included. To determine whether studies with short follow-up periods or negative mammography results were causing heterogeneity in the summary estimates, we performed sensitivity analyses by removing studies with a 1-year follow-up period and by estimating the I2 statistic for the remaining group. Furthermore, to ensure that no single study influenced the overall results, we conducted “leave-one-out” sensitivity analyses by repeating the analyses with the following exclusion of each study. Finally, we performed meta-regression analyses based on linear regression models for assessing the influence of the heterogeneity of study populations on the meta-analysis results. We performed regression analyses when heterogeneity was significant and when a reasonable number of data points were available (≥ 4).
The statistical computations were performed using STATA 14.0 software (STATA Corp., College, USA) for all statistical analyses. We considered 2-sided p-values < 0.05 to be statistically significant.
RESULTS
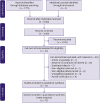
Search strategy and study selection
Characteristics of the included studies
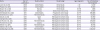
The main characteristics of the included studies are shown in Table 1. All included studies were published between 2002 and 2018. Thirteen articles described one RCT [21], three paired studies (in which the participants underwent both types of mammography) [181920], and nine cohort studies [102223242526272829] of screening mammography sensitivity and specificity for BC in average-risk asymptomatic women; the sample sizes ranged from 7,366 to 7,343,327. Six studies enrolled women aged < 50 years old [181921222528]; 8 studies were conducted in European countries [1020212324252729], and 5 were conducted in North America [1819222628].
Table 1
Main characteristics of the population screened
| Study | Year of publication | Study location | Study design | Age range (yr) | No. of screening mammograms |
|---|---|---|---|---|---|
| Lewin et al. [18] | 2002 | United States | Paired study | ≥ 40 | 13,472 |
| Pisano et al. [19] | 2005 | United States | Paired study | ≥ 40 | 85,520 |
| Skaane et al. [20] | 2005 | Norway | Paired study | 50–69 | 7,366 |
| Skaane et al. [21] | 2007 | Norway | Randomized clinical trial | 45–69 | 23,929 |
| Kerlikowske et al. [22] | 2011 | United States | Prospective cohort study | 40–79 | 869,286 |
| Nederend et al. [23] | 2014 | The Netherlands | Prospective cohort study | 50–75 | 123,952 |
| Sala et al. [24] | 2015 | Spain | Retrospective cohort study | 50–69 | 161,992 |
| Campari et al. [25] | 2016 | Italy | Retrospective cohort study | 45–79 | 87,436 |
| de Munck et al. [10] | 2016 | The Netherlands | Retrospective cohort study | 50–75 | 576,069 |
| Prummel et al. [26] | 2016 | Canada | Retrospective cohort study | 50–75 | 742,092 |
| Weber et al. [27] | 2016 | The Netherlands | Retrospective cohort study | 50–75 | 417,746 |
| Dabbous et al. [28] | 2017 | United States | Retrospective cohort study | 40–79 | 710,749 |
| Sankatsing et al. [29] | 2018 | The Netherlands | Retrospective cohort study | 50–74 | 7,343,327 |
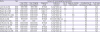
Four studies collected digital mammograms from the year 2004 [23252627], while the initial year of digital mammogram enrollment in the other 9 studies was after 2004 [101819202122242829]. Nine of the 13 studies used the Breast Imaging Reporting and Data System (BI-RADS) for mammogram interpretation [101819222324272829]. Four studies used screening mammograms with longitudinal follow-up of women with negative mammography results through cancer registries, medical records, or national insurance claims approximately 1 year later, as the reference standard [19222528]; 9 studies performed a follow-up for 2 years or more for negative screening results [101820212324262729] (Table 2).
Table 2
Main characteristics of the mammography examination
| Study | Year | Features of mammography examination | |||||||
|---|---|---|---|---|---|---|---|---|---|
| Year of film mammogram* | Year of digital mammogram* | Diagnostic scale | Reference standard | No. of views | Single vs. double interpretation | Consideration of learning-curve effect | % of cases with DCIS | ||
| Lewin et al. [18] | 2002 | 1999–1999 | 1999–1999 | BI-RADS | 2-year follow-up | 2 | S | N/A | N/A |
| Pisano et al. [19] | 2005 | 2001–2003 | 2001–2003 | BI-RADS/scale 1–7 | 1-year follow-up | N/A | S | N/A | 23.3 |
| Skaane et al. [20] | 2005 | 2000–2001 | 2000–2001 | Scale 1–5 | 2-year follow-up | 2 | D | No | 31.6 |
| Skaane et al. [21] | 2007 | 2000–2001 | 2000–2001 | Scale 1–5 | 2-year follow-up | 2 | D | Yes | N/A |
| Kerlikowske et al. [22] | 2011 | 2000–2006 | 2000–2006 | BI-RADS | 1-year follow-up | 1–2 | N/A | N/A | 24.2 |
| Nederend et al. [23] | 2014 | 2008–2010 | 2009–2011 | BI-RADS | 2-year follow-up | 1 | D | N/A | 19.9 |
| Sala et al. [24] | 2015 | 1995–2007 | 2004–2010 | BI-RADS | 30-month follow-up | 2 | D | Yes | 16.8 |
| Campari et al. [25] | 2016 | 2011 | 2012 | N/A | 1-year follow-up | N/A | D | Yes | 16.8 |
| de Munck et al. [10] | 2016 | 2004–2009 | 2004–2010 | BI-RADS | 2-year follow-up | 2 | D | No | 14.9 |
| Prummel et al. [26] | 2016 | 2008–2009 | 2008–2009 | N/A | 2-year follow-up | 2 | S | Yes | 17.2 |
| Weber et al. [27] | 2016 | 2000–2010 | 2009–2011 | BI-RADS | 2-year follow-up | 2 | D | No | 18.6 |
| Dabbous et al. [28] | 2017 | 2001–2010 | 2001–2010 | BI-RADS | 1-year follow-up | 2 | N/A | No | N/A |
| Sankatsing et al. [29] | 2018 | 2004–2010 | 2004–2011 | BI-RADS | 2-year follow-up | 2 | D | No | N/A |
BI-RADS = Breast Imaging Reporting and Data System; D = double interpretation for each mammogram; DCIS = ductal carcinoma in-situ; N/A = not available; S = single interpretation for each mammogram; S/D = a combination of single and double interpretation.
*Reported year in which the mammograms were obtained.
Quality assessment
The QUADAS-2 instrument suggested that the highest risk of bias occurred in the “flow and timing” category (Supplementary Figure 1), which is likely attributed to a study that acquired BC screening data from a single health care delivery organization, using a cancer registry as the reference standard [28]. This study only reported the final number of patients included in the data analysis, and the flow of study population selection was not adequately described in the article.
Overall diagnostic accuracy
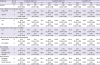
The overall pooled sensitivity, specificity, AUC, LR+, LR−, and DOR of BC screening conducted using the DM systems were 0.76 (95% CI, 0.70–0.81), 0.96 (95% CI, 0.94–0.97), 0.94 (95% CI, 0.92–0.96), 18.0 (95% CI, 12.2–26.7), 0.25 (95% CI, 0.20–0.32), and 72 (95% CI, 44–118), respectively. The overall pooled sensitivity, specificity, AUC, LR+, LR−, and DOR for the SFM systems were 0.76 (95% CI 0.70–0.81), 0.97 (95% CI, 0.94–0.98), 0.92 (95% CI, 0.89–0.94), 22.5 (95% CI, 13.1–38.8), 0.25 (95% CI, 0.20–0.31), and 91 (95% CI, 52–157), respectively (Table 3, Supplementary Figure 2, and Supplementary Table 2).
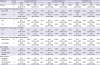
Table 3
Subgroup analysis based on the type of digital mammography system, enrollment of women < 50 years of age, consideration of learning-curve effect, the initial year of obtaining digital mammograms, study design, and study location
Heterogeneity exploration
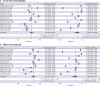
As shown in Table 3 and Figure 2, we identified substantial heterogeneity between studies when calculating the pooled sensitivity (DM, I2 = 99.3%; SFM, I2 = 99.8%), specificity (DM, I2 = 100.0%; SFM, I2 = 100.0%), and AUC (DM, I2 = 100.0%; SFM, I2 = 100.0%) of screening mammograms for BC in each mammography system by using the bivariate model.
Figure 2
Forest plot presenting the estimates of sensitivity and specificity of each study across two screening mammography systems. The estimates of each study are plotted. Error bars = calculated 95% confidence intervals; FN = false negative; FP = false positive; TN = true negative; TP = true positive.
Excluding the studies with 1-year follow-up periods did not reduce the heterogeneity for overall sensitivity (DM, I2 = 99.6%; SFM, I2 = 99.8%), specificity (DM, I2 = 100.0%; SFM, I2 = 100.0%), or AUC (DM, I2 = 100.0%; SFM, I2 = 100.0%). However, removing studies with 1-year follow-up periods decreased the pooled AUCs of DM and SFM (DM, 0.92 [95% CI, 0.89–0.94; SFM, 0.84 [95% CI, 0.81–0.87]).
Leave-one-out sensitivity analyses
To evaluate the robustness of the summarized diagnostic accuracy results, we performed a leave-one-out sensitivity analysis by iteratively removing one study at a time and recalculating the summary sensitivities and specificities (Supplementary Figure 3). Leave-one-out analyses showed no marked difference in results, indicating that no single study had any impact on them.
Subgroup analysis
Type of DM system
There were considerable differences in the AUC estimates of SROC according to the mammography system in our only FFDM subgroup. Studies using only FFDM as an index test had lower AUCs for DM and SFM than did studies using all DM as an index test (Table 3). We observed high heterogeneity in all pooled test accuracy indicators, regardless of the DM type. When we excluded studies with 1-year follow-up periods in our only FFDM subgroup, the pooled sensitivity and specificity estimates and their associated heterogeneity remained unchanged (Table 4). However, the AUC estimates of the SROCs decreased, showing significant differences between DM and SFM with no change in heterogeneity. Because of the scarcity of studies, we could not perform a sensitivity analysis in all the DM subgroups.
Table 4
Summary estimates of subgroups after removing studies with a 1-year follow-up period
Variance of paired design study was adjusted by correlation.
CI = confidence interval; AUC = area under the curve; SFM = screen-film mammography; DM = digital mammography; FFDM = full-field digital mammography.
*Inconsistency index; †Unable to perform a sensitivity analysis due to the lack of data/studies; ‡All digital mammography systems including the computed radiography system.
Enrollment of women younger than 50 years old
The difference in AUC estimates according to the mammography system (DM vs. SFM) significantly varied depending on the inclusion of women aged < 50 years old. Studies that enrolled women aged < 50 years old had a higher specificity than did studies that enrolled only women aged ≥ 50 years old; however, no significant difference was observed between DM versus SFM (Table 3). Studies that recruited women aged < 50 years old had similar AUCs for DM and SFM, while studies that enrolled women aged ≥ 50 years old had higher AUCs for DM than for SFM. Sensitivities remained similar for both DM and SFM regardless of the subgroups. We saw high heterogeneity in all pooled diagnostic accuracy indicators; even after removing studies with 1-year follow-up periods, all the indicators were highly heterogeneous (Table 4).
Consideration of the learning-curve effect
Consideration of the learning-curve effect did not influence the performance characteristics for DM compared to that of SFM. In both subgroups, no significant difference was observed in the sensitivity and specificity estimates between DM and SFM. High heterogeneity was shown in both subsets and eliminating studies with 1-year follow-up periods did not affect the heterogeneity of summary diagnostic indicators. However, after excluding studies with 1-year follow-up periods, the AUC of SFM decreased in studies without consideration of the learning-curve effect and became significantly lower than the AUC of DM in the same subgroup (Table 4).
The initial year of obtaining digital mammograms
Whether the digital mammograms were collected before or after the year 2004 had no impact on the diagnostic accuracy of DM and SFM. All the test accuracy indicators of DM were similar to those of SFM and were highly heterogeneous in both subgroups. After removing studies with 1-year follow-up periods, the AUC of DM and SFM decreased in the subgroup of digital mammograms obtained until 2004, but the heterogeneity remained high.
Study design
Estimates of sensitivity, specificity, and AUC of the SROC for DM were similar to those for SFM and highly heterogeneous in both subgroups according to the study design. When we excluded studies with 1-year follow-up periods, the pooled sensitivity and specificity estimates of DM were similar to those of SFM in both study designs. After removing studies with 1-year follow-up periods, the AUCs of DM and SFM decreased in prospective studies, and the pooled AUC for DM was highly homogeneous (Table 4). In retrospective studies, the pooled AUCs decreased, but the heterogeneity remained high.
Study location
Subgroup analysis according to study location showed no difference between the pooled test performance characteristics of DM compared to those of SFM by subgroups. In both subgroups, heterogeneity between studies was high for sensitivity, specificity, and AUC (Table 3). The exclusion of studies with 1-year follow-up periods lowered the pooled AUC estimates of studies from European countries. However, sensitivity and specificity estimates remained similar in studies performed in European countries despite the removal of studies with 1-year follow-up periods with high heterogeneity (Table 4).
Meta-regression analyses
There was high heterogeneity among studies in both subgroups on the SFM basis and the DM basis. To assess the influence of the heterogeneity of the study population and the data on meta-analysis results, we conducted meta-regression analyses.
Meta-regression analyses showed that the following factors led to a high heterogeneity in the sensitivity and specificity of the SFM screening results (Supplementary Figure 4A and B): enrollment of women younger than 50 years, study design, and study location. However, when we performed subgroup analyses in these subgroups, the pooled estimates remained highly heterogeneous (Table 3). In the DM screening results, on the other hand, the following factors were found to be related to the high heterogeneity (Supplementary Figure 4C and D): type of DM system, study design, and study location. According to the subgroup analysis results, however, the heterogeneity remained high except to the area under the summary receiver-operating characteristic curve of the prospective design group (Table 3).
Publication bias
We conducted the publication bias analysis for the included studies. However, as shown in Supplementary Figure 5, the funnel plots were asymmetric, and the p-value of Deeks' test was 0.08 for DM and 0.06 for SFM, indicating that a publication bias existed in the meta-analysis for both mammography systems.
DISCUSSION
Our study findings suggest that the pooled sensitivities of DM and SFM were approximately 76% and 76%, respectively, whereas those of DM and SFM were approximately 96% and 97%, respectively. Hence, the overall accuracy of DM and SFM was 94% and 92%, respectively. For all diagnostic performance measures, we saw high heterogeneity among studies. To convey this issue, we performed a subgroup analysis to identify potential sources of heterogeneity between studies.
We assumed that the heterogeneity in test accuracy might be caused by the type of DM system used as an index test in each study. The subgroup analysis showed that the type of DM system significantly affected the pooled AUC of SROC; in our only FFDM subgroup, DM was more accurate than was SFM. In addition, the AUC of DM was similar to that of SFM in the all DM subgroup. Nine studies to date have compared the accuracy of FFDM and SFM in asymptomatic women with an average risk of BC.
We also investigated whether the enrollment of women aged < 50 years old had any impact on the test accuracy of screening mammography. Surprisingly, the pooled AUC of the SROC was higher for DM than for SFM in studies with participants aged ≥ 50 years old only; meanwhile, the pooled AUC of DM was lower than that of SFM in the studies on women aged < 50 years old. However, heterogeneity in the pooled estimates of AUC remained high despite stratification by patient age and the exclusion of studies with 1-year follow-up periods. Previous studies have indicated that FFDM yields better screening performance than does SFM, especially in younger women; these studies, however, included only three studies in the meta-analysis [1112].
According to the subgroup analyses of studies with 2-year and longer follow-up periods, consideration of the learning-curve effect could have effects on the heterogeneity of the AUCs of SFM systems. The pooled AUC for SFM in the studies that did not consider the learning-curve effect was 79%, while the pooled AUC for DM was 99%. However, for studies that considered the learning-curve effect, the pooled AUCs were 97% for SFM and 97% for FFDM, suggesting that consideration of the learning-curve effect might have influenced the better test performance of DM systems over SFM systems in a previous meta-analysis study [12].
The results of the subgroup analyses according to the initial year of obtaining digital mammograms showed that studies with recently collected digital mammograms had better test performance for both DM and SFM than did studies with older data for DM, even though the pooled AUCs of DM and SFM were not significantly different. This result indicates that the test accuracy of mammographic screening has changed over time. However, studies that collected BC screening data prospectively showed higher test accuracy in DM than in SFM. Moreover, after removing studies with 1-year follow-up periods, the AUCs of both DM and SFM of prospective studies decreased, whereas the pooled AUC of DM was homogenous (I2 = 0%). The subgroup analysis considering study location did not explain the issue of heterogeneity, even though the pooled AUCs of European studies were higher than those of North American studies.
Our study had several limitations. First, heterogeneity existed in most analyses. Nevertheless, the less heterogeneous subgroup summary estimates were generally similar to the overall summary estimates, suggesting that despite statistical heterogeneity, the overall summary measures are reasonable estimations of overall test accuracy for DM than for SFM. Second, we could not determine the sensitivity and specificity of DM and SFM for breast adenomas stratified by pathological diagnosis or cancer stage owing to the complexity of accounting for various definitions of these subgroups used in each study. However, the meta-regression analysis showed that the proportion of ductal carcinoma in-situ (DCIS) out of all cancer types has no significant effect on the test accuracy across studies (Supplementary Figure 4). This finding indicates that considering cancer stage (DCIS vs. invasive) as a subgroup could have no impact on our meta-analysis results. Third, we could not account and adjust for various factors associated with the mammography interpreters. Fourth, our study lacked data regarding other sub-factors such as breast density, menopausal status, and the use of computer-aided detection. Last, our study may be subject to a publication bias.
In summary, the systematic review and meta-analysis results suggest that DM has similar accuracy, specificity, and sensitivity to SFM in the detection of BC. Pooled screening performance estimates reinforce that the accuracy of FFDM is better than that of conventional SFM systems; nonetheless, the performance of all DM systems, including computed radiography systems, is similar to that of SFM systems, suggesting that the digitalization of screening mammography should be transitioned to the FFDM system but not to the computed radiography system. Additionally, our meta-analysis shows high inconsistency in the summarized test accuracy indicators of screening mammography; hence, the results should be interpreted carefully. Although we found heterogeneity in all analyses, we were not able to examine several sources of heterogeneity owing to scarce information in the selected articles; therefore, further studies that compare the diagnostic accuracy of DM to that of SFM should be cautiously designed and reported.
 XML Download