

 PDF
PDF ePub
ePub Citation
 Print
Print


Abstract
Purpose
Methods
Results
Figures and Tables
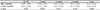
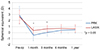 | Figure 1Changes in spherical equivalent manifest refraction over time after hyperopic PRK and LASIK. PRK = photorefractive keratectomy; LASIK = laser in situ keratomileusis; D = diopter; Pre-op = preoperation.
|
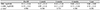
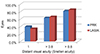 | Figure 2Uncorrected visual acuity at postoperative 1 year follow up. PRK = photorefractive keratectomy; LASIK = laser in situ keratomileusis.
|
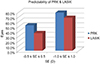 | Figure 3PRK and LASIK predictability. The percentage of eyes within ± 0.5 D and ± 1.0 D. PRK = photorefractive keratectomy; LASIK = laser in situ keratomileusis; D = diopter; SE = spherical equivalent.
|
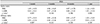
Table 1
Demographics of the surgical patients
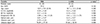
Values are presented as mean ± standard deviation (range) unless otherwise indicated.
PRK = photorefractive keratectomy; LASIK = laser in situ keratomileusis; M/F = male/female; UCVA = uncorrected visual acuity; logMAR = the logarithm of minimal angle of resolution; BCVA = best corrected visual acuity; SE = spherical equivalent; D = diopter.
*t-test, p < 0.05 is statistically significant.
![]()
Table 2
Changes in UCVA over time after PRK and LASIK
Values are presented as mean ± standard deviation unless otherwise indicated.
UCVA = uncorrected visual acuity; PRK = photorefractive keratectomy; LASIK = laser in situ keratomileusis; Pre-op = preoperation; logMAR = the logarithm of minimal angle of resolution.
*t-test, p < 0.05 is statistically significant.
![]()
Table 3
Changes in BCVA over time after PRK and LASIK
Values are presented as mean ± standard deviation unless otherwise indicated.
BCVA = best corrected visual acuity; PRK = photorefractive keratectomy; LASIK = laser in situ keratomileusis; Pre-op = preoperation; logMAR = the logarithm of minimal angle of resolution.
*t-test, p < 0.05 is statistically significant.
![]()
 XML Download