

 PDF
PDF ePub
ePub Citation
 Print
Print


Abstract
Purpose
Methods
Results
Conclusions
Figures and Tables
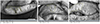 | Figure 1Images of Meibomian gland drop out, tortuosity, ectasis cases of meibographs, captured by LipiView® (TearScience, Morrisville, NC, USA). Meibography image analysis examples. The freehand tool in ImageJ was used to select the area of meibomian gland, and computerized analysis of the area of Meibomian gland. (A) Meibomian gland drop out, partial or total gland loss or atrophy. (B) Meibomian gland tortuosity. (C) Meibomian gland ectasis, partial or total gland dilatation.
|
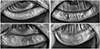 | Figure 2The grading of Meibomian gland loss. Partial or complete loss of Meibomian gland is scored for each eyelid from grade 0 to grade 3. (A) Grade 0 means no loss of meibomian glands, normal Meibomian gland. (B) Grade 1 means the lost area was less than 1/3 of total area. (C) Grade 2 means the lost area was between 1/3 and 2/3 of total area. (D) Grade 3 means the lost area was more than 2/3 of total area.
|
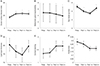 | Figure 3Analysis of the Meibomian gland expressibility, lipid layer thickness, Ocular surface disease index (OSDI), tear film break-up time preop and postop. (A) Change in OSDI from preoperative value. The increase in OSDI was statistically significant at 1 week, 1 and 2 months postoperatively compared to preoperative value (p < 0.05). (B) Change in tear break-up time (tBUT) from preoperative value. tBUT was significantly short at 1 week, 1 and 2 months postoperatively compared to the preoperative value (p < 0.05). (C) Change in corneal staining score from preoperative value. There was an increase in the corneal staining score at 1 week, 1 and 2 months postoperatively (p > 0.05). (D) Change in Meibomian gland expressibility from preoperative value. Meibomian gland expressibility was significantly decreased at 1 and 2 months postoperatively compared to the preoperative value (p < 0.05). (E) Change in lipid layer thickness from preoperative value (p > 0.05). (F) Change in partial blink from preoperative value (p > 0.05). Repeated-measures analysis of variance, compared with preoperative values. Preop = preoperative; Postop = postoperative; w = week(s); m = month(s). *Significant correlations (p < 0.05).
|

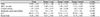
Table 3
Change in lid parameters of MGD before cataract surgery and postop 2 months
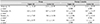
Compare to lid margin abnormality, drop out, tortuosity, ectasis, grade from preoperative value. There was no statistically significant difference between 2 months postoperatively and preoperative value (p > 0.05). Values are presented as mean ± standard deviation unless otherwise indicated.
MGD = meibomian gland dysfunction; Preop = preoperative; Postop = postoperative.
*Wilcoxon signed rank test, compared with preoperative values. p < 0.05 were considered statistically significant, significant correlations (p < 0.05).
![]()

Table 5
The follow up data after cataract surgery compare with obstructive and seborrheic MGD
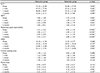
LLT was significantly higher in obstructive MGD at preoperative value, 1 week, 1 and 2 months postoperatively compared to obstructive and seborrheic MGD. tBUT was significantly short in obstructive MGD at 1 week postoperatively compared to obstructive and seborrheic MGD. Meibomian gland expressibility was significantly higher in seborrheic MGD at preoperative value, 1 week, 1 and 2 months postoperatively compared to obstructive and seborrheic MGD. There was no statistically significant difference in OSDI, Corneal staining score, partial blink compared to obstructive and seborrheic MGD. Values are presented as mean ± standard deviation unless otherwise indicated.
MGD = meibomian gland dysfunction; LLT = lipid layer thickness; tBUT = tear break up time; OSDI = ocular surface disease index.
*p < 0.05 were considered statistically significant, significant correlations (p < 0.05); †Wilcoxon signed rank test compared with preoperative values.
![]()
 XML Download