

 Citation
 Print
Print


BACKGROUND
Mercury exists in 3 forms: metal mercury, organic mercury, and inorganic mercury. Most forms of mercury present in the environment are metal mercury and inorganic mercury. Mercury in the atmosphere is not soluble in water. Even in rain, it only melts in a small amount and remains in the atmosphere, but it is finally oxidized to divalent mercury by reaction with atmospheric oxidizing agents such as oxygen, ozone and chlorine. Divalent mercury is water-soluble, stabilizing in water, and from the atmosphere into the soil due to precipitation. Elemental and inorganic mercury is deposited in watersheds or in direct waters. This mercury precipitates in sediments, some of which react with sulfate to form insoluble mercury sulphide precipitates, whereas a few are methylated in vivo by bacteria. This methylmercury is readily bioavailable and the food chain is bio-concentrated, accumulated by aquatic organisms and exposed to human ingestion [1]. This exposed mercury is well known for its toxic effect on the central nervous system, and it can also harm for cardiovascular system known to affect blood pressure, parasympathetic and sympathetic effects [2], affecting the autonomic nervous system and causing harmful effects on heart rate [34].
In Korea, old metal mines have not been properly treated since the development, polluting the surrounding soil and rivers, and heavy metals are being concentrated in the cultivated areas. In addition, since the heavy metal components contained in the waste mine and mine tailings generated during the ore mining process are accumulated in the surrounding soil for a long time, the pollution is caused not only in surrounding farmland but also in general living area [5]. Therefore, it is presumed that the residues of the residents around the mine area were exposed to heavy metals due to soil crops and drinking water.
In Korea, however, there is no clear standard for mercury concentration in the blood, and it follows the standards set by the US and Germany. Due to the lack of studies on the standard in Korea, we have studied the mercury concentration and the prevalence of hypertension in the residents around abandoned metal mines using US standard values.
METHODS
Subjects and data collection
From 2008 to 2011, we surveyed 7,055 residents in Gyeonggi, Gangwon, Gyeongnam, Gyeongbuk, Jeonla and Chungcheong provinces affected by abandoned metal mines and collected data from 6 hospitals. To investigate the demographic characteristics of the subjects, a questionnaire designed by the Korean Society of Epidemiology was used as a basis and modified to meet the purpose of the research. We conducted a personal questionnaire interview survey with residents on the basis of household questionnaires, sex, age, household income, smoking, and drinking items, and we used standardized questionnaires and questionnaires were prepared with the help of researchers.
Classification of subjects
We set standard value of mercury concentration in blood to 5.8 μg/L [6] and 15 μg/L [7] in order to divide high and low mercury concentrations among residents around abandoned metal mines. And we divided the residents into two groups less than 5.8 μg/L and equal or more than 5.8 μg/L (also 15 μg/L). The χ2 test and t-test was used to analyze the difference of disturbance variables in these groups.
Matching method
In the present study, the difference between the disturbance variables of the two groups was minimized by using propensity score matching (PSM). PSM is a technique used to control dissimilarly distributed variables other than processing variables when comparing experimental and control groups.
Measure blood pressure
The checkup teams at each hospital took blood pressure and pulse measurements using a mercury sphygmomanometer. The criteria for hypertension were systolic blood pressure ≥ 140 mmHg or diastolic blood pressure ≥ 90 mmHg [8], or whether they were diagnosed through a medical history, and current hypertension and we include people who are taking hypertension medication and whose blood pressure is normal.
Process the blood sampling
Each hospital's screening team conducted blood sampling for the residents at the local community center. Blood samples were collected in heparin and treated tubes, mixed well with ethylenediaminetetraacetic acid to prevent clotting, and stored in refrigerator. All the samples were refrigerated and transferred to the analysis room after the medical examination.
Analysis of blood mercury concentration
Serum mercury was determined by gold-amalgam method using Direct Mercury analyzer (DMA 80; Milestone, Sorisole, Italy). The 100 μL of well-stirred blood was placed in the sample container of the analyzer and immediately analyzed.
Statistical analysis
A geometric mean and a 95% confidence interval corrected for demographic characteristics and lifestyle were presented. All tests were conducted at a significance level of 5%.
Ethics statement
This study used the data of the Research for Health Effects of the residents around the abandoned metal mines, 2008–2011, National Institute of Environmental Research. All study participants of the research agreed to participate the survey and signed a consent. This research was approved by the Dong-A University Institutional Review Board (No. 13-010).
RESULTS
General characteristics of all subjects
As a result of analyzing the total data of the residents, the mean blood mercury concentration was 5.22 μg/L (standard deviation: 4.53), and the results are shown in Table 1.
Table 1
General characteristics of study subjects
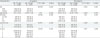
Values are presented as number (%). Alcohol drink: 1 - person who had lifetime drinking experience, 0 - never drink; Income: quartile subgroup for gross house income.
PSM: propensity score matching.
![]()
First, there was a statistically significant difference (p < 0.05) in sex, age, smoking, drinking and income for original data. In the age, the mean age was 66.10 in the group less than 5.8 μg/L, but the mean age was 63.68 in the group with 5.8 μg/L or more. After PSM match, there was no statistically significant difference in sex, smoking, and house income (p > 0.05).
Association between general characteristic and mercury concentration
Table 2 summarizes the differences in blood mercury concentrations according to general characteristics. First, the mean difference in mercury concentration between male and female was statistically significant (p < 0.05) and the male had higher blood mercury levels. The difference in mercury concentration by age was statistically significant (p < 0.001), and the mercury concentration was found to be higher at the age that below than 65. In the case of drinking, the mean difference of mercury concentration was statistically significant (p < 0.001), indicating a high mercury concentration level in the lifetime drinkers. The mean difference in mercury concentration was statistically significant (p < 0.001), and the current smoker and quit smoker had a high mercury concentration level than never smoked people. In last, the mean difference in mercury concentration was statistically significant (p < 0.001) and the mercury concentration was the highest at income level 4 (highest level in income).
Table 2
Differences in blood mercury concentrations according to general characteristics
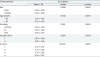
Alcohol drink: 1 - person who had lifetime drinking experience, 0 - never drink; Income: quartile subgroup for gross house income.
SD: standard deviation.
![]()
Association of blood mercury concentration and hypertension
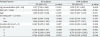
Table 3 summarizes the χ2 test to determine whether there is a relationship between hypertension and blood mercury levels. When reference level was 5.8 μg/L in the original data, the occurrence of hypertension of lower group was 53.9% and higher group was 57.1%, so the prevalence of hypertension was higher in the groups above 5.8 μg/L and there was a statistically significant difference (p < 0.05). In the PSM data using baseline characteristics, lower group (< 5.8 μg/L) was 52.5%, and higher group (≥ 5.8 μg/L) was 58.2%. The prevalence of hypertension was higher in the groups above 5.8 μg/L and there was statistically significant (p < 0.05).
Table 3
Differences in blood mercury concentration according to hypertension existence

![]()
And when reference level was 15 μg/L, in the original data, the occurrence of hypertension of lower group was 54.7% and higher group was 60.3%, so the prevalence of hypertension was higher in the groups above 15 μg/L but there was no statistically significant difference (p > 0.05). In the PSM data using baseline characteristics, lower group (< 15 μg/L) was 51.2%, and higher group (≥ 15 μg/L) was 60.3%. The prevalence of hypertension was higher in the groups above 15 μg/L and there was statistically significant (p < 0.05).
Analysis of factors related to hypertension
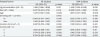
Logistic regression analysis was used to analyze factors affecting hypertension, and sex, age, smoking, drink, income and mercury concentration were set as influential variables. The logistic regression results are summarized in Tables 4 and 5. When reference level was 5.8 μg/L in the original data, mercury concentration, age, income had statistically significant effects on hypertension (p < 0.05), and the odds ratio (OR) of mercury in blood was 1.277, which means the high mercury concentration group showed a 27.7% higher risk of developing hypertension than the lower group. In the PSM data, mercury concentration, age, and income had statistically significant effects on hypertension (p < 0.05), and the OR of mercury in blood was 1.276, which means the high mercury concentration group showed a 27.6% higher risk of developing hypertension than the lower group.
Table 4
Logistic regression analysis for the occurrence of hypertension and related factors (Hg concentration 5.8 μg/L)
Alcohol drink: 1 - person who had lifetime drinking experience, 0 - never drink; Income: quartile subgroup for gross house income.
OR: odds ratio; CI: confidence interval; PSM: propensity score matching.
![]()
Table 5
Logistic regression analysis for the occurrence of hypertension and related factors (Hg concentration 15 μg/L)
Alcohol drink: 1 - person who had lifetime drinking experience, 0 - never drink; Income: quartile subgroup for gross house income.
OR: odds ratio; CI: confidence interval; PSM: propensity score matching.
![]()
And when reference level was 15 μg/L in the original data, mercury concentration, age, income had statistically significant effects on hypertension (p < 0.05), and the OR of mercury in blood was 1.426, which means the high mercury concentration group showed a 42.6% higher risk of developing hypertension than the lower group. In the PSM data, mercury concentration, age had statistically significant effects on hypertension (p < 0.05), and the OR of mercury in blood was 1.450, which means the high mercury concentration group showed a 45.0% higher risk of developing hypertension than the lower group.
DISCUSSION
This study assessed the mercury exposure levels of residents around abandoned metal mines in Gyeonggi, Gangwon, Gyeongbuk, Gyeongnam, Jeonla and Chungcheong provinces for four years from 2008 to 2011 and compared the difference in the prevalence of hypertension according to the concentration of mercury in the local residents. To increase the reliability of the subjects' presence of hypertension, using data that blood pressure measurements, interviews, and medical history of hypertension were used.
The difference in blood mercury concentration according to the characteristics of residents showed a higher blood mercury level in male than in female. The difference in mercury concentration by age was statistically significant and showed a higher mercury concentration at the age of less than 65-year group. In the case of drinking, high mercury concentrations were found in the lifetime drinkers and statistically significant. Smoking has a high level of mercury concentration in current smokers and quit smokers and had statistically significant. In last, income level showed the highest mercury concentration in the highest income group and had statistically significant.
We compared the prevalence of hypertension among the residents by dividing the blood mercury concentration by the higher and lower than the US environmental standard value of 5.8 μg/L and HBM-II level 15 μg/L. After adjustment for demographic characteristics, the prevalence of hypertension was higher in the high blood mercury concentration group and it was statistically significant. To investigate the relationship between mercury concentration and blood pressure, logistic regression analysis after adjusting for sex, age, smoking, drinking, and income also showed higher risk of hypertension in the group with higher mercury concentration than lower group.
In result of association between general characteristic and mercury concentration, there were differences in age, sex, smoking, drinking and income levels. In previous paper that reported differences in mercury concentrations according to sex, with a higher mercury concentration in males than females [9] and papers that published in opposition [1011], which showed higher results in men in this study.
In addition, in this study, mercury levels in blood were higher in the highest income group, according to Shin et al. [12], the higher the BMI, the higher the mercury in the blood. This study also showed high results in the higher income group, suggesting that the mercury concentration has increased due to the influence of BMI and fat.
In previous papers, several results have been published regarding the relationship between exposure to mercury and hypertension. In a study of Nunavik's Inuit, it was reported that blood mercury level and blood pressure were highly correlated [13], studies in Greenland and Denmark have shown a significant correlation between blood mercury and blood & pulse pressure [14], study in Amazon, systolic blood pressure was increased in subjects with high mercury levels of hair [15], Choi and colleagues [16] observed positive correlation between blood mercury concentration and systolic and diastolic blood pressures.
However, some studies have shown opposite results. In the same cohort study that tracked the same subjects on Faeroe Island, as reported by Sørensen et al. [1718], seven-year-old children who had been exposed to high mercury levels during pregnancy showed high systolic blood pressure, but after 7 years, there was no effect when they were 14 years old. And in Oka et al.'s study, individuals with fetal Minamata disease had low pulse pressure when compared to the control group[2].
In this study, there was a significant correlation between blood mercury and blood pressure, and the prevalence of hypertension was high in the group with high blood mercury concentration. There are several hypotheses about the mechanism of the effect of mercury concentration on blood pressure, one is that mercury causes injury of the blood vessels and hypertension, proven through animal experiments [19] and human studies [20], Another one is mercury can induce lesions in the vascular bed, and mercury accumulation in the human body is associated with accelerated atherosclerosis. So this atherosclerosis induce hypertension [2122]. A known mechanism of that is attributed to an enhancement of lipid peroxidation, as mercury generates reactive oxygen species, reduces the antioxidative capacity by binding to sulfhydryl groups, and counteracts the antioxidative effect of selenium [23]. And many studies have shown that mercury increases not only the risk of hypertension but the risk of coronary heart disease, myocardial infarction [2425].
Ministry of Food and Drug Safety conducted a survey of the blood mercury concentrations of 10,909 people in Korea from 2008 to 2011. They announced the average mercury concentration per capita was 3.45 μg/L, which is 28% of the food tolerable weekly intake, so it means it's safe level [26]. On the other hand, the average mercury concentration of the residents affected by the abandoned metal mines was 5.21 μg/L (standard deviation: 4.53), which difference was about 1.8 μg/L, indicating that the mercury concentration in the residents around abandoned metal mines were high, it is estimated that the longer the area is located in the area, the longer the exposure period and the long-term effect of mercury.
We estimated residents around abandoned metal mines to have chronic, direct or indirect effects of mercury on crops, soil, and drinking water around abandoned metal mines, therefore, it is thought that the occurrence of hypertension in the residents around abandoned metal mines are likely to be increased due to the influence of mercury on injury of vessels, atherosclerosis.
In addition, the majority of abandoned metal mines are into a suburban area that does not receive much health care, there is a high probability that blood pressure control in hypertensive patients will not be performed properly, this leads to another cardiovascular disease caused by uncontrolled hypertension.
Therefore, we should set the blood mercury concentration standard for our country and more blood pressure and health care will be needed for those who are above the threshold and those with hypertension.
The limitations of this study may be that other harmful substances other than mercury may not be considered, and the survey on dietary habits, obesity, occupation, and survey of residents during the survey are insufficient.
CONCLUSIONS
The average mercury concentration of residents affected by abandoned metal mines was high and the prevalence of hypertension was higher in residents with high mercury concentration than in residents with low mercury concentrations.
The relationship between blood mercury and hypertension has not yet been clarified, but this study showed a significant correlation between mercury and hypertension. So, local residents affected by abandoned metal mines are likely to be exposed to heavy metals such as mercury continuously, the high participation rate of the local residents of the abandoned residents' health survey is required and it is necessary to establish the blood mercury concentration standard suitable for Korea and to continuously monitor people who are higher than the standard value and the hypertensive patients.
 XML Download