

 Citation
 Print
Print


Abbreviations
KOSHA
Korea Occupational Safety and Health Agency
FRS
Framingham risk score
NHS
National Health Screening Program
HRA
health risk appraisal
CI
confidence interval
BMI
body mass index
LDL-C
low-density lipoprotein cholesterol
HDL-C
high-density lipoprotein cholesterol
CVD
cardio-cerebrovascular diseases
NHIS
National Health Insurance Service
ESC/ESH
European Society of Cardiology and the European Society of Hypertension
KSH 2018
2018 Korean Society of Hypertension guidelines for the management of hypertension
INTRODUCTION
According to the World Health Organization, the highest proportion of all deaths in 2016 was due to cardio-cerebrovascular diseases (CVDs) (27%) [1]. The prevalence and mortality rates of CVDs are rapidly increasing in Korea as the population ages and lifestyles become westernized [23].
CVDs develop from a combination of comorbidities and various risk factors such as hypertension, diabetes, smoking, and obesity. These risk factors can be actively managed to lower the prevalence of CVDs [4]. Therefore, efforts have been put in the workplace to identify and manage workers with a high-risk for CVDs. Additionally, essential research on evaluation tools that can predict the risk of CVDs is being conducted.
The Framingham risk score (FRS) [5] is a representative method to predict risk through measuring the level of risk-factor contribution to CVDs. The FRS is the most universally applied method, which has been validated in a number of foreign studies [678], to evaluate the risk of CVDs through calculating a score centered on risk factors such as gender, age, systolic blood pressure, hypertension medication, total cholesterol, high-density lipoprotein cholesterol (HDL-C), diabetes, and smoking.
There are 2 representative risk assessment tools for CVDs in Korea: the National Health Insurance Service's (NHIS) health risk appraisal (HRA) and “Risk assessment for the prevention of CVDs in the workplace and follow-up management guidelines” established by the Korea Occupational Safety and Health Agency (KOSHA) for the prevention of CVDs in the workforce. The HRA has been revised several times since its introduction in 2002 [9]. The most recent revision of the HRA was in 2017 and it became part of the 2018 National Health Screening Program [1011]. The KOSHA guidelines were first established as the KOSHA code in 2004 [12] and were followed by the KOSHA 2008 [13], KOSHA 2010 [14], KOSHA 2013 [15], KOSHA 2017 [16], and the most recent KOSHA 2018 [17] in October 2018.
Between the KOSHA 2004 and 2013, various domestic and foreign risk-assessment tools for CVDs have been developed. However, the risk-assessment tool for CVDs suggested by the KOSHA guidelines had not undergone a substantial revision. The overall reform of the suggested risk-assessment tool was made in the KOSHA 2017 and most recent KOSHA 2018. Periodical revision of assessment tools is essential for ensuring the reliability and validity of risk assessment, because medical knowledge and epidemiological characteristics continuously change. Therefore, the revision of the KOSHA 2017 and KOSHA 2018 can be considered positive. However, there is no evidence that the revision is more relevant or effective than other risk-assessment tools for CVDs in workplace health management. Furthermore, the risk group classification criteria for calculated 10-year risk of the National Health Screening Program HRA (NHS HRA) 2018 presented in the KOSHA 2018 were based on the European Society of Cardiology and the European Society of Hypertension (ESC/ESH) 2018 [18]. According to the results of the NHIS sample cohort database analysis, the average CVD risk in the 40s is 2.1%, which means that when the KOSHA 2018 classification criteria are applied, most of the 40s or above are classified as the moderate- or high-risk group, resulting in an overestimation of risk. Hence, we applied the classification criteria based on the risk group definition of the 2018 Korean Society of Hypertension guidelines for the management of hypertension (KSH 2018) [19] to compare with the KOSHA 2018 and conducted a comparative analysis of the KOSHA 2013, KOSHA 2017, KOSHA 2018 (2 methods), NHS HRA 2017, and NHS HRA 2018 on male shipyard workers in 1 region compared with the FRS as a gold standard to identify the most relevant risk-assessment tool in relation to CVDs workplace health management.
METHODS
Study participants
This study included shipyard workers from the Gyeongnam region who had undergone a health examination during January–December 2016 at 1 university hospital. We identified 9,273 workers as potential candidates for this study. We excluded 638 females due to their relatively small number, 2,023 workers < 30 years of age who did not fit the criteria for applying the risk-prediction model for CVDs, and 2,152 workers who had missing survey or examination results required to assess their CVDs risk. Finally, 4,460 male workers were included in the study.
Medical interview and questionnaire
Data concerning lifestyle habits, medical history and treatment (hypertension, diabetes, dyslipidemia, and CVDs), and family history were obtained through medical interviews and self-reported questionnaires.
Physical measurements and clinical examination
Height and weight were measured using an automatic height and weight scale (BSM-370; Biospace, Seoul, Korea). Body mass index was calculated as weight in kilograms divided by the square of height in meters (kg/m2) and was used to assess obesity. The midpoint between the lowest part of the ribs and the pelvic iliac crest was measured in an upright position for waist circumference. For blood pressure, the workers rested for at least 10 minutes prior to measurement and systolic and diastolic blood pressures were measured in a seated position; blood pressure measurements were taken again after 5 minutes, and the average value was used. After a minimum of 8 hours of fasting, the following were measured: blood glucose, glycated hemoglobin, total cholesterol, triglyceride, low-density lipoprotein cholesterol (LDL-C), and HDL-C levels. Additionally, electrocardiography, chest radiography, and urine test were conducted to identify left ventricular hypertrophy or proteinuria, which are indicators of target organ damage.
Risk assessment tools for CVDs
FRS
The FRS was calculated through applying a 10-year risk equation for CVDs that was based on the maximum 12-year follow-up in the Framingham heart study. The calculated 10-year risks for CVDs were used to categorize the workers into the following groups: a low-risk group (< 10%), a moderate-risk group (10%–20%), and a high-risk group (≥ 20%).
KOSHA 2013
The workers were evaluated using the KOSHA (2013) risk assessment and follow-up management guidelines for CVDs. The healthy and low-risk groups were combined and categorized as a low-risk group for comparison with the FRS risk assessment for CVDs.
KOSHA 2017
The workers were evaluated using the KOSHA (2017) risk assessment and follow-up management guidelines for CVDs. We thoroughly reviewed the KSH 2013 [20] that underpin the KOSHA 2017 and selected 1 of the 2 risks presented in the following categories: low risk (stage-2 prehypertension with 1–2 risk factors), moderate risk (stage-2 prehypertension with ≥ 3 risk factors or subclinical organ damage), moderate risk (stage-2 hypertension with no risk factor). The healthy, lowest-risk, and low-risk groups were combined and categorized as a low-risk group for comparison with the FRS risk assessment for CVDs.
KOSHA 2018
The workers were assessed by each of the 2 risk stratification methods of the KOSHA (2018) risk assessment and follow-up management guidelines for CVDs: the risk table based on blood pressure, CVDs, and comorbidities and the risk stratification based on the results of the NHS HRA 2018. The risk group classification criteria of the latter were based on the Systematic COronary Risk Evaluation criteria for CVD risk categories defined by the ESC/ESH 2018, and the classification criteria were as follows: a low-risk group (< 1%), a moderate-risk group (1%–5%), a high-risk group (5%–10%), and a highest-risk group (≥ 10%). The healthy and low-risk groups were combined and categorized as a low-risk group, and the high-risk and the highest-risk groups as a high-risk group for comparison with the FRS risk assessment for CVDs.
NHS HRA 2017
We performed our assessments using the heart diseases and stroke risk calculation method of the NHS HRA 2017 presented by the NHIS. The higher value of the range values for heart diseases and stroke was selected to categorize the risk level for a low-risk group (range value, < 0.33), a moderate-risk group (range value, between 0.33 and 0.66), and a high-risk group (range value, ≥ 0.66).
NHS HRA 2018
We performed our assessments using the NHS HRA 2018 risk calculation method for CVDs, presented by the NHIS. The calculated 10-year absolute risk level for CVDs was used to categorize the workers into low-risk (< 4%), moderate-risk (4%–6%), and high-risk (≥ 6%) groups based on the criteria derived by applying the risk group definition of the KSH 2018 to the mean 10-year absolute risk data by age [21], which were calculated by analyzing the sample cohort database of the NHIS, for comparison with the FRS risk assessment for CVDs.
Statistical analysis
Continuous variables were reported as means with standard deviations, and categorical variables were reported as absolute values and percentages. Risk levels for CVDs were calculated based on the FRS, KOSHA 2013, KOSHA 2017, KOSHA 2018 (2 methods), NHS HRA 2017, and NHS HRA 2018. The study participants were categorized into low-risk, moderate-risk, or high-risk groups. The sensitivity and specificity of each risk-assessment tool was calculated using the FRS as the gold standard. For this purpose, low-risk and moderate-risk groups identified using each risk-assessment tool for CVDs were combined into a low-moderate-risk group. Furthermore, to examine the correlation and agreement between each assessment tool and the FRS, a Spearman's rank correlation coefficient and a linearly weighted kappa coefficient were calculated. The correlation coefficient classification defined by Alfred et al. [22] and the agreement classification suggested by Landis and Koch [23] were used in our study. All statistical analyses used SPSS statistics ver. 20.0 (IBM Corp., Armonk, NY, USA) and MedCalc v17.9.7 (MedCalc Software, Mariakerke, Belgium) programs. Statistical significance was defined as p < 0.05.
RESULTS
The average age of the 4,460 workers in our study was 44.6 ± 5.9 years. The proportion of 41 and 50 years old was the highest (54.0%). Other workers' characteristics were as follows: 554 (12.4%) had total cholesterol ≥ 240 mg/dL, 891 (20.0%) had LDL-C ≥ 160 mg/dL, 1,341 (30.1%) had triglyceride ≥ 150 mg/dL, 482 (10.8%) had HDL-C < 40 mg/dL, 1,806 (40.5%) were obese, 994 (22.3%) had abdominal obesity, 3,222 (72.2%) were current smokers, 2,993 (67.1%) reported insufficient physical activity, 255 (5.7%) had diabetes, and 384 (8.6%) had hypertension (Table 1).
Table 1
General participant characteristics
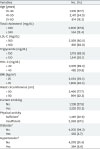
LDL-C: low-density lipoprotein cholesterol; HDL-C: high-density lipoprotein cholesterol; BMI: body mass index.
*Defined as ≥ 150 minutes of moderate and/or vigorous activity per week; †Defined as a fasting plasma glucose level ≥ 126 mg/dL, or a glycated hemoglobin level ≥ 6.5%, or the use of diabetes medications; ‡Defined as a systolic blood pressure ≥ 140 mmHg, or a diastolic blood pressure ≥ 90 mmHg, or the use of antihypertensive medications.
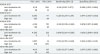
The proportion of workers in the high-risk group for CVDs using the FRS, KOSHA 2013, KOSHA 2017, KOSHA 2018, KOSHA 2018 (HRA), NHS HRA 2017, and NHS HRA 2018 were 5.7%, 3.2%, 6.9%, 4.2%, 10.7%, 0.1%, and 5.5%, respectively (Table 2).
Table 2
A comparison between CVD risk estimations using different risk-assessment tools

Data are expressed as the number of individuals included in each category unless otherwise stated.
CI: confidence interval; CVD: cardio-cerebrovascular diseases; FRS: Framingham risk score; KOSHA: Korea Occupational Safety and Health Agency; NHS HRA: National Health Screening Program health risk appraisal; KSH 2018: 2018 Korean Society of Hypertension guidelines for the management of hypertension.
*Classified by the KOSHA 2018; †Classified based on the risk group definition of the KSH 2018; ‡Spearman rank correlation coefficient; §Linearly weighted kappa coefficient; ‖p-value < 0.01.
Correlations between the FRS and each classification of the KOSHA 2013, KOSHA 2017, KOSHA 2018, KOSHA 2018 (HRA), NHS HRA 2017, and NHS HRA 2018 were statistically significant (p < 0.01). The FRS showed a low-positive correlation of 0.354 with the KOSHA 2013, 0.396 with the KOSHA 2017, and 0.386 with the KOSHA 2018, a negligible-positive correlation of 0.288 with the NHS HRA 2017, and a moderate-positive correlation of 0.505 with the KOSHA 2018 (HRA) and 0.622 with the NHS HRA 2018.
Kappa values, calculated to examine the agreement of classifications through the KOSHA 2013, KOSHA 2017, KOSHA 2018, KOSHA 2018 (HRA), NHS HRA 2017, and NHS HRA 2018 with the FRS, were 0.268, 0.322, 0.352, 0.136, 0.221, and 0.559, respectively. The KOSHA 2018 (HRA) had slight agreement, the NHS HRA 2018 had moderate agreement, and the remaining assessment tools had fair agreement (Table 2).
Using the FRS, the sensitivity of the risk assessments was highest in the KOSHA 2018 (HRA) and specificity was highest in the NHS HRA 2017 (Table 3).
Table 3
Sensitivity and specificity for CVD risk-assessment tools using the FRS
CI: confidence interval; CVD: cardio-cerebrovascular diseases; FRS: Framingham risk score; KOSHA: Korea Occupational Safety and Health Agency; NHS HRA: National Health Screening Program health risk appraisal; KSH 2018: 2018 Korean Society of Hypertension guidelines for the management of hypertension.
*Classified by the KOSHA 2018; †Classified based on the risk group definition of the KSH 2018.
DISCUSSION
We evaluated risk levels for CVDs in male shipyard workers based on the FRS, KOSHA 2013, KOSHA 2017, KOSHA 2018, KOSHA 2018 (HRA), NHS HRA 2017, and NHS HRA 2018, respectively. Also, we used the FRS, which is the most universally applied assessment tool, as the gold standard to analyze the sensitivity, specificity, correlation, and agreement of these risk assessments. We found that the correlation and agreement were highest in the NHS HRA 2018 (0.622 and 0.559, respectively), the sensitivity and correlation were lowest in the NHS HRA 2017 (0.8% and 0.288, respectively), and the sensitivity was highest and the agreement was lowest in the KOSHA 2018 (HRA) (78.4% and 0.136, respectively).
The risk assessment for CVDs in our study that followed the KOSHA 2017 had significantly higher sensitivity and agreement compared to the KOSHA 2013. Both the KOSHA 2013 and the KOSHA 2017 present a categorical risk-assessment tool for CVDs and assess risk based on blood pressure, the number of risk factors, organ damage, and comorbidities. Even though the KOSHA 2013 and the KOSHA 2017 are similar risk-assessment methods, our results showed a significant difference between them. This difference may be attributed to the specific content changes in the KOSHA 2017 that include the strengthening of standards for risk factors of CVDs and specification of blood pressure categorization. However, it appears that changes in blood pressure level items, which comprise the core component of the risk-prediction model for CVDs, have a greater effect. While the KOSHA 2013 categorizes participants into risk groups for CVDs only in the case of hypertension, the KOSHA 2017 categorizes participants into risk groups even in stage-2 prehypertension. Consequently, the incidences of categorizing participants into a healthy group despite an existence of other risk factors, which has been a criticized limitation [24], have decreased and significantly affected our results. It can be explained in the same context that the KOSHA 2018 had higher agreement compared to the KOSHA 2017, although the difference is not significant. KOSHA 2018 adopts the new blood pressure classification system proposed in the KSH 2018, classifying participants as risk groups if blood pressure is prehypertension level or above, which is wider than the range of blood pressure levels that KOSHA 2017 classifies as risk groups. That is, it is thought to be the result of the further reduction in the degree of misclassifications described above.
The risk assessment for CVDs through the NHS HRA 2017 in our study had significantly lower sensitivity and agreement compared to the remaining assessment tools except the KOSHA 2018 (HRA), and we consider there are several reasons for this. First, the exclusion of age in the calculation of risk, which is known to be an important risk factor for CVDs, is thought to have contributed to the decrease in predictive ability [2125]. Second, the NHS HRA 2017 presents the risk factors and risks of cardiovascular diseases and cerebrovascular diseases separately, unlike the other prediction models that combine both disease groups into CVDs. To compare with other risk-assessment tools for CVDs, the higher value of the 2 disease groups is set as the risk level of CVDs in our study. Consequently, the risk could be underestimated and may have affected our research results.
To ensure that a prevention policy for CVDs is efficiently implemented in the workplace, preferential selection and management of high-risk workers are required. Therefore, an accurate identification of high-risk groups is essential [26]. The NHS HRA 2018 has a limitation as an assessment tool for CVDs in the workplace as it does not present a standard for categorizing low, moderate, and high-risk groups. This is a common problem in assessment tools for CVDs that are developed from domestic data because of an insufficient basis to decide the risk-group classification standards for CVDs that apply to Koreans [27]. Therefore, this study used the same definition for low, moderate, and high-risk groups as the KSH 2018 to examine the NHS HRA 2018's ability to identify risk groups. The results of the analyses showed that the risk assessment for CVDs through the NHS HRA 2018 had significantly higher sensitivity and agreement compared to the remaining assessment tools except the KOSHA 2018 (HRA). We consider there to be several reasons for these results. First, the inclusion of age in the calculation, which is a well-known core risk factor of CVDs, contributed to the increase in predictive ability [2125]. Second, categorical risk-assessment tools for CVDs that assess risk using a risk table or chart generally have lower accuracy compared to a continuous risk-assessment tool for CVDs [2829]. Although the Cox proportional hazards regression model was not used, given the characteristics of a predictive model that calculates the absolute risk level in a similar method, this can have a higher accuracy level compared to other assessment tools that use risk tables and could have influenced our research results.
The risk assessment for CVDs through the KOSHA 2018 (HRA) in our study had significantly higher sensitivity and lower agreement compared to the remaining assessment tools. It means that the KOSHA 2018 (HRA) accurately identifies the high-risk group at a high rate, but its overall risk-group identification capability is poor. The distribution of risk groups based on the KOSHA 2018 (HRA) shows that, unlike other assessment tools, the majority are distributed in the moderate-risk group. This suggests that the KOSHA 2018 (HRA) criterion for dividing low-risk and moderate-risk groups is set too low, which may have had a significant impact on the result. According to the average 10-year absolute risk level for CVDs by gender and age group calculated by Cho et al. [21] using NHS HRA 2018 based on the sample cohort database of the NHIS, it exceeds 1% for males aged 35 and older, resulting in the majority being classified as moderate-risk when the KOSHA 2018 (HRA) criteria are applied. This can be seen as a basis to support the above interpretation of the result and suggests that there is a problem with the KOSHA 2018 (HRA) criteria. Both the KOSHA 2018 (HRA) and NHS HRA 2018 use the NHS HRA 2018 risk calculation method and differ only in the risk group classification criteria. That is, applying the classification criteria set in this study based on the risk group definition of the KSH 2018 appears to be able to identify the risk group more appropriately.
There are several points of caution and some limitations in the interpretation of our research. First, the risk-group definition in the NHS HRA 2018 was borrowed from a different risk-assessment tool for CVDs. The levels of sensitivity and agreement, which are considered the core content of this study, may differ depending on the accuracy of the assessment tool, but the standards of risk-group classification also act as an important factor. Incorporating risk-group definitions established in previous research was unavoidable to evaluate the risk-group identification capability, because the NHS HRA 2018 does not present a standard for risk-group classification; therefore, this may result in risk-group misclassification. We attempted to minimize the aforementioned challenges through using the risk-group definition of the KSH 2018 developed by the KSH, which is the most prominent Korean academic society related to hypertension. Second, the FRS was used as the gold standard. Although the FRS is the most universally applied method, it tends to overestimate the risk of CVDs when applied to Koreans [1930] because it was developed based on the non-Hispanic white population [31]. However, it is difficult to set the KSH 2018, which was developed based on Korean data, or the ESC/ESH guideline, which was proposed as the most appropriate assessment tool by Lee [32], as the gold standard in our study design. The KOSHA 2017 borrowed the KSH 2013 assessment tool, which can be considered the same as the KSH 2018 assessment tool for the following reasons: the KSH 2018 is all the same except that aged 65 and older is considered as 2 risk factors compared to the KSH 2013, and none of the subjects in our study are aged 65 or older. The KOSHA 2018 borrowed the ESC/ESH 2018 assessment tool. That is, if the KSH 2018 or ESC/ESH 2018 is set as the gold standard, the results will be biased toward corresponding assessment tools. Also, it is more important not to miss actual high-risk group even if the risk is somewhat overestimated in the high-risk strategies for the prevention of CVDs in the workplace. In the above situation, the FRS is the best objective assessment tool that can be set as the gold standard, and the results obtained using it are thought to be meaningful enough. Third, our study was conducted on male shipyard workers only in 1 region; therefore, there are limitations for generalization of the results of our study to all workers. Fourth, self-reported questionnaires were used to obtain data on lifestyle habits and medical history. Thus, there is a possibility that erroneous recall by the respondents and over- or under-reporting biases may have had an effect on our results. Despite the aforementioned limitations, our study is significant because it is the first to comparatively analyze the assessment tools for CVDs of the pre- and post-revision KOSHA guidelines and NHS HRA from the perspective of the capability to identify risk groups. Moreover, our study provides basic data for the selection of an assessment tool for CVDs suitable for health management in the workplace.
CONCLUSIONS
The results of this study indicate that the NHS HRA 2018 risk calculation method is a useful risk-assessment tool for CVDs, but only when appropriate classification criteria are applied. In order to enhance the risk-group identification capability of the KOSHA guideline, we propose to apply the classification criteria set in this study instead of the current classification criteria of the KOSHA 2018. We also suggest that there is a need to make an independent risk-assessment tool for CVDs by using big data to overcome the borrowing from other guidelines, which is the fundamental limitation of the KOSHA guideline.
 XML Download