

 PDF
PDF ePub
ePub Citation
 Print
Print


INTRODUCTION
Diabetes mellitus (DM) is a prevalent metabolic disease involving about 10% of the general population1. It impairs vascular supply in both large and small blood vessels, peripheral nerve sensation, wound healing process, and immune function, which results in a wide variety of medical and surgical complications2. For recovery from burn injury, however, sufficient circulatory support, satisfactory restoration of the wound site, and protection against infection are required to prevent complications involving various organ systems. Thus burn patients with DM, in particular, may be at increased risk of unfavorable outcomes or complications3.
Previous studies have shown that DM increases mortality, complications, and the duration of intensive care unit stay and ventilator support among trauma patients45. In addition, a study on 58 pediatric burn patients revealed that the group with poor glucose control showed higher frequencies of death and positive blood culture, and a lower frequency of skin graft take without adjustment for confounding factors6. However, the effects of DM on mortality and morbidities in burn patients have not been sufficiently elucidated. The present study aimed to investigate the effects of DM on the mortality, length of hospital stay, and number of operations in bur patients.
Go to : 
MATERIALS AND METHODS
Study population
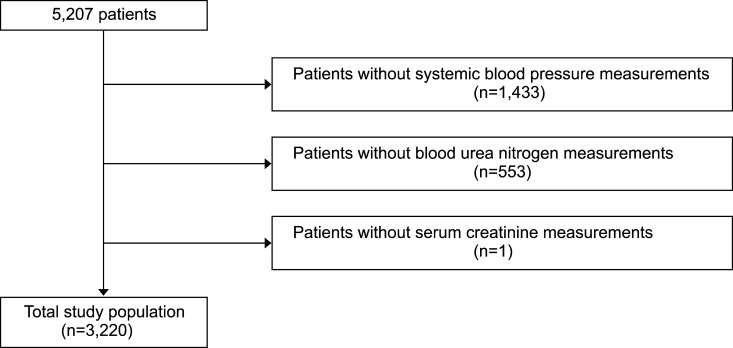
A retrospective cohort study was performed using medical records of all burn patients who were admitted to the Hangang Sacred Heart Hospital and discharged once between 1 January 2014 and 30 September 2016. During the period, a total of 5,207 patients were identified, and we sequentially excluded patients without systemic blood pressure measurement on the day of admission (n=0,433), those without blood urea nitrogen measurement on the day of admission (n=553), and those without serum creatinine measurement on the day of admission (n=1). Finally, a total of 3,220 patients were eligible for the study (Fig. 1). This study was approved by the institutional review board of the Hangang Sacred Heart Hospital (IRB number. 2017-064).
Outcomes of interest
Mortality was defined as death during hospital stay. Length of hospital stay was defined as the number of days from admission to discharge. The number of operation was determined as total number of operation during the admission period.
Variable definitions
The presence or absence of DM was determined based on the history of patients. The patients who were diagnosed as DM or treated for DM were defined as having DM. The season at admission was defined as spring (March to May), summer (June to August), autumn (September to November), and winter (December to February). Body surface area was determined as the percentage of surface area involved by burn, and divided into less than 10%, 10% to <20%, 20% to <30%, 30% to <50, 50% to <70, and 70% or more. Blood urea nitrogen (mg/dl), serum creatinine (mg/dl) and systolic blood pressure levels (mmHg) were based on the initial measurement results on the day of admission.
Statistical analyses
Demographic and clinical characteristics of the study population were summarized as mean±standard deviation and range for continuous variables including age, number of operation, length of hospital stay, blood urea nitrogen, and serum creatinine, and as number and proportion for categorical variables including sex, DM, season at admission, body surface area, and systolic blood pressure in both survival and death groups.
Simple and multiple logistic regression analyses were sequentially performed to determine whether DM increases mortality in burn patients or not after adjustment for potential confounders. Simple and multiple linear regression analyses were sequentially performed to determine whether DM prolongs length of hospital stay in burn survivors after adjustment for potential confounders. Based on the normality in a Q-Q plot, the log-transformed length of hospital stay was used for the analyses. Simple and multiple Poisson regression models with log link function were sequentially performed to determine whether DM increases the number of operations in burn survivors after adjustment for potential confounders.
All of statistical analyses were performed using the statistical software package R version 3.3.1 (The R Foundation for Statistical Computing, Vienna, Austria). Two-sided p-alues less than 0.05 were considered as statistically significant.
Go to :
RESULTS
Characteristics of the study population
Table 1 summarizes demographic and clinical characteristics of the study population. Compared to burn patients without DM, the those with DM showed significantly a higher mean age (p<0.001), higher mean blood urea nitrogen and serum creatinine levels (p<0.001 for both), more frequent death (p=0.005), longer mean hospital stay (p<0.001), higher mean number of operations (p<0.001), and different distribution pattern of season at admission (p=0.043), and systolic blood pressure (p<0.001).
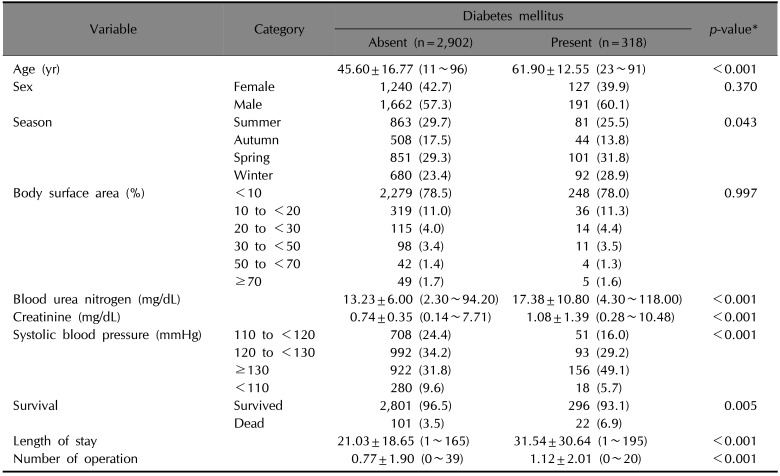
Table 1
Demographic and clinical characteristics of the study population
![]()
DM increases mortality in burn patients (Table 2)
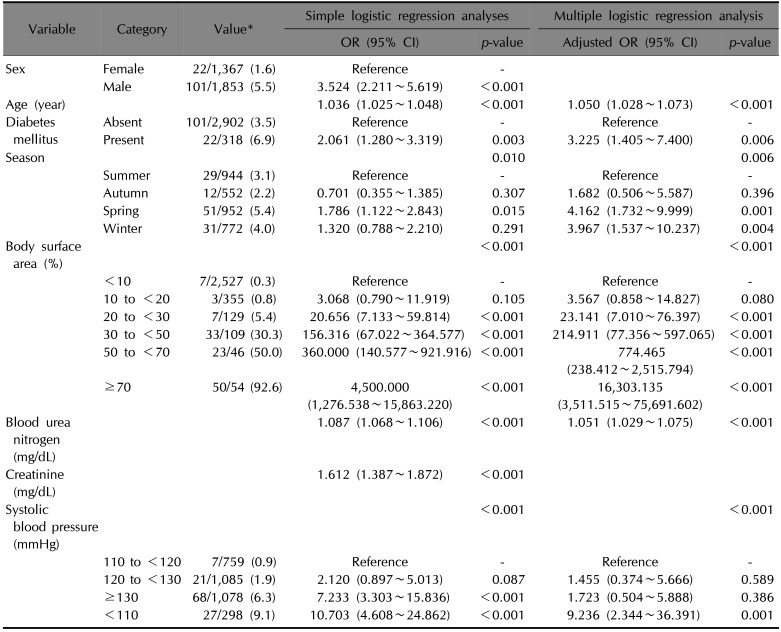
A simple logistic regression analysis showed that the odds of death was significantly higher in DM patients compared with those without DM (odds ratio 2.061 [95% confidence interval 1.280~3.319], p=0.003). However, other factors including sex, age, season at admission, body surface area, blood urea nitrogen, serum creatinine, and systolic blood pressure were also significantly associated with mortality in burn patients (p=0.010 for season at admission, and p<0.001 for the others). To adjust for the effect of these potential confounding factors, we conducted multiple logistic regression analyses, which confirmed that DM significantly increases odds of death in burn patients (adjusted odds ratio 3.225 [95% confidence interval 1.405~7.400], p=0.006).
Table 2
Effects of diabetes mellitus on the mortality in burn patients (n=3,220)
![]()
DM increases length of hospital stay in burn survivors (Table 3)
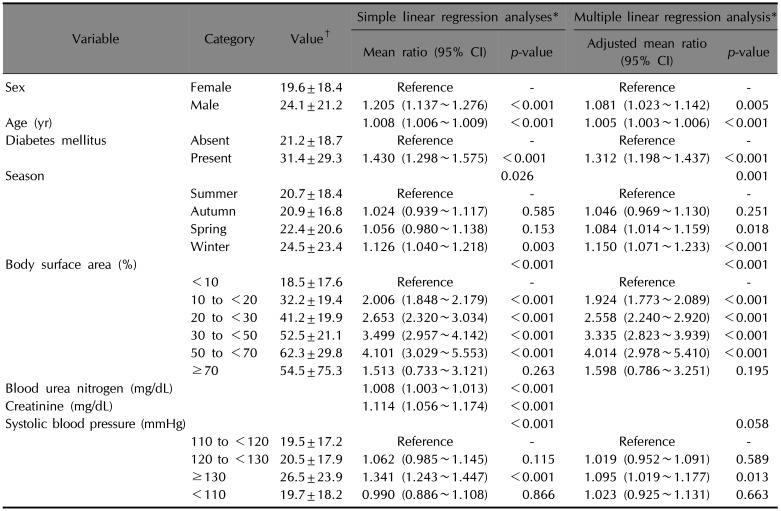
A simple linear regression analysis showed that the mean length of hospital stay in survived burn patients was significantly longer in those with DM compared with those without DM (mean ratio 1.430 [95% confidence interval 1.298~1.575], p<0.001). However, other factors including sex, age, season at admission, body surface area, blood urea nitrogen, serum creatinine, and systolic blood pressure were also significantly associated with the length of hospital stay in survived burn patients (p=0.026 for season at admission, and p<0.001 for the others). To adjust for the effect of these potential confounding factors, we performed multiple linear regression analyses, which showed that DM significantly increases the mean length of hospital stay in burn survivors (adjusted mean ratio 1.312 [95% confidence interval 1.198~1.437], p<0.001).
Table 3
Effects of diabetes mellitus on length of hospital stay in burn survivors (n=3,097)
![]()
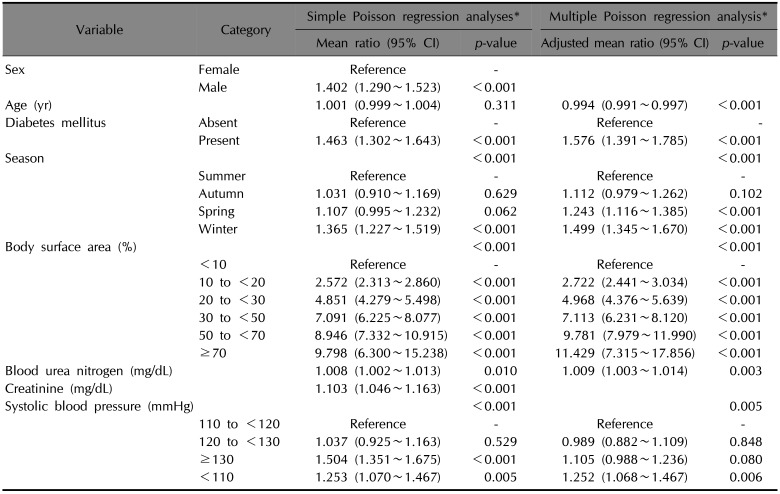
DM increases number of operations in burn survivors (Table 4)
A simple Poisson regression analysis showed that the mean number of operations in survived burn patients was significantly higher in those with DM compared with those without DM (mean ratio 1.463 [95% confidence interval 1.302~1.643], p<0.001). However, other factors including sex, season at admission, body surface area, blood urea nitrogen, serum creatinine, and systolic blood pressure were also significantly associated with the number of operations in survived burn patients (p=0.010 for blood urea nitrogen, and p<0.001 for the others). To adjust for the effect of these potential confounding factors, we did multiple Poisson regression analyses, which proved that DM significantly increases the mean number of operations in burn survivors (adjusted mean ratio 1.576 [95% confidence interval 1.391~1.785], p<0.001).
Table 4
Effects of diabetes mellitus on the number of operations in burn survivors (n=3,097)
![]()
Go to :
DISCUSSION
Previous studies have repeatedly failed to show the effect of DM on the mortality of burn patients2378. Several reports of increased morbidities in burn patients with DM were also based on the results of simple comparisons between those with and without DM without adjustment for confounding factors2378910. McCampbell et al.2 reported that diabetic burn patients have longer length of hospital stay and higher possibilities for skin graft, burn-related procedure, infection, partial graft slough, and regraft without adjustment for confounding factors. They showed no significant difference in mortality between diabetic and nondiabetic burn patients2. Memmel et al.8 also described that frequencies of sepsis, community-acquired burn wound cellulitis, or urinary tract infection were higher in diabetic burn patients. However, the results were not adjusted for confounders, and mortality was not significantly higher in diabetic burn patients. In a retrospective study on 207 patients with lower extremity burn injury, diabetic patients showed higher burn intensive care unit admission rates, a longer length of hospital stay, and a higher frequency of renal failure, but they did not consider effects of potential confounders. Furthermore, they also reported no significant mortality difference between diabetic and non-diabetic patients7. In a recent study on 586 burn patients, univariable analyses showed higher frequencies of wound infection, severe renal impairment, and unplanned readmission, a longer hospital stay, and more operations in the diabetic group. However, multivariable analyses disclosed that DM was associated with neither mortality nor unplanned readmission. DM was even associated with a significantly lower rate of admission to intensive care unit in the multivariable analysis3. Thourani et al.10 also described a lower success rate of split-thickness skin graft in diabetics based on a simple comparison between diabetic and nondiabetic burn patients, but the difference was abrogated by multivariable analyses adjusting for confounding factors.
In contrast, our retrospective cohort study involving more than 3,000 burn patients showed that DM significantly increases mortality of burn patients, and that, even in case of survival, DM also increases both the length of hospital stay and the number of operations through multivariable analyses adjusting for potential confounding factors. To the best of our knowledge, this is the first study to prove the confounder-adjusted effect of DM on the mortality and morbidities in patients with burn injury. Compared with previous studies, our present study included a considerably higher number of patients, who were all hospitalized. Such characteristics of the study population would have increased the power to detect the effects of DM.
The effects of other prognostic factors were also confirmed in this study. The age and body surface area are well-known prognostic factors for outcomes of patients with burn injury, and commonly included in many prognostic scoring systems11121314. Our study confirmed that the age and body surface area are significant prognostic factors for mortality, length of hospital stay, and the number of operation. Sex is included as a prognostic factor in the abbreviated burn severity index14, but not in more recently developed scoring systems111213. Our multivariable analyses showed that males had longer hospital stay than females, but sex was not associated with mortality and the number of operation. The present study showed that higher levels of blood urea nitrogen were associated with higher mortality, which is consistent with results of a previous cohort study which showed that acute renal injury independently predicts mortality in patients with major burns15. A study on 70 burn patients aged 60 years or more reported that hypertension impaired the probability of survival16. Our results also showed the trend of increase in mortality as the level of systolic blood pressure increased when it was higher than 110 mmHg, although it was not statistically significant. On the contrary, the low blood pressure was significantly associated with higher mortality, which seems to result from death from circulatory failure after burn injury. In addition, higher blood pressure was significantly associated with longer hospital stay.
An interesting result of this study was that the outcome of burn injury was significantly different according to season even after adjusting for potential confounders. In particular, all of the mortality, length of hospital stay, and number of operations were consistently higher in spring and winter. The reason for this seasonality is not clear. There have been studies which showed a significant difference in the incidence of burns according to season, but mortality was not different between seasons1718. A previous study in United States reported the seasonal variation in surgical outcomes, although it is not limited to burn patients19. The study showed that both postoperative morbidity and mortality were significantly higher in July to August compared with April to June. In United States, July to August is the period when there is a marked influx of new trainees in most medical centers. This is consistent with unfavorable outcomes in spring in this study, because new trainees start their roles in spring in Korea. In winter, there may be a relative shortage of manpower because male trainees are drafted into the army in Korea. The seasonal tendency of higher mortality during winter may also partially explain the worse outcomes in this study20. However, further studies are needed to elucidate the seasonal changes in burn outcomes because we cannot exclude the possibilities of effects of other seasonal factors including environmental changes.
This study has several limitations. First, the findings are based on the data of a single center. However, this weakness may have been redeemed by the status of our hospital as a referral burn center and the large scale of this study. The Hangang Sacred Heart Hospital is one of the largest burn centers in Korea, and this study analyzed the data of more than 3,000 patients. Second, all patients were not objectively assessed for the status of DM, and thus there may be a possibility of under-diagnosis of DM. If patients with mild DM were more selectively missed out, the effect of DM on clinical outcomes may have been overestimated. Third, this study does not provide the reason of the poor clinical outcomes in burn patients with DM. Further studies would be needed to compare the duration of antimicrobial therapy and frequencies of skin infection and sepsis between burn patients with and without DM.
In summary, the present study showed that DM increases mortality, elongates hospital stay and makes more operations required in patients with burn injury. These results mean that DM may be a useful prognostic factor to predict the outcome of burn patients, and suggest that more careful treatment and monitoring are required for burn patients with DM.
Go to :
 XML Download