Abstract
Plans converted using dose-volume-histogram-based plan conversion (DPC) were evaluated by comparing them to the original plans. Changes in the dose volumetric (DV) parameters of five volumetric modulated arc therapy (VMAT) plans for head and neck (HN) cancer and five VMAT plans for prostate cancer were analyzed. For the HN plans, the homogeneity indices (HIs) of the three planning target volumes (PTV) increased by 0.03, 0.02, and 0.03, respectively, after DPC. The maximum doses to the PTVs increased by 1.20, 1.87, and 0.92 Gy, respectively, after DPC. The maximum doses to the optic chiasm, optic nerves, spinal cord, brain stem, lenses, and parotid glands increased after DPC by approximately 4.39, 3.62, 7.55, 7.96, 1.77, and 6.40 Gy, respectively. For the prostate plans after DPC, the HIs for the primary and boost PTVs increased by 0.05 and 0.03, respectively, and the maximum doses to each PTV increased by 1.84 and 0.19 Gy, respectively. After DPC, the mean doses to the rectum and femoral heads increased by approximately 6.19 and 2.79 Gy, respectively, and those to the bladder decreased by 0.20 Gy when summing the primary and boost plans. Because clinically unacceptable changes were sometimes observed after DPC, plans converted by DPC should be carefully reviewed before actual patient treatment.
REFERENCES
1.Krishna GS., Srinivas V., Ayyangar K., Reddy PY. Comparative study of old and new versions of treatment planning system using dose volume histogram indices of clinical plans. J Med Phys. 2016. 41(3):192.

2.Hirata T., Kishi N., Imai Y, et al. Dose Volume Parameters as Predictors for Radiation-Induced Hypothyroidism After IMRT or VMAT for Head and Neck Squamous Cell Carcinoma: Comparison of the Availability Between Mean Thyroid Dose and Median Thyroid Dose. Int J Radiat Oncol Biol Phys. 2016. 96(2):E365.

3.Kim MY., Yu T., Wu H-G. Dose-volumetric parameters for predicting hypothyroidism after radiotherapy for head and neck cancer. Jpn J Clin Oncol. 2014. 44(4):331–37.

4.Park JM., Park S-Y., Choi CH., Chun M., Kim JH., Kim J-I. Treatment plan comparison between Tri-Co-60 magnetic-resonance image-guided radiation therapy and volumetric modulated arc therapy for prostate cancer. Oncotarget. 2017. 8(53):91174.

5.Treutwein M., Hipp M., Koelbl O., Dobler B. Searching standard parameters for volumetric modulated arc therapy (VMAT) of prostate cancer. Radiat Oncol. 2012. 7(1):108.

6.Zulkafal H., Khan M., Ahmad M., Akram M., Buzdar S., Iqbal K. Volumetric modulated arc therapy treatment planning assessment for low-risk prostate cancer in radiotherapy. Clin Cancer Investig J. 2017. 6(4):179–83.

7.Emami B., Lyman J., Brown A, et al. Tolerance of normal tissue to therapeutic irradiation. Int J Radiat Oncol Biol Phys. 1991. 21(1):109–22.

Fig. 1
A representative patient's dose distributions for the head and neck case are presented before (upper row) and after (lower row) dose volume histogram based plan conversion. Doses are shown in color wash from 40% of the prescription dose to the maximum dose. Axial (a and d), coronal (b and e), and sagittal (c and f) planes are shown.

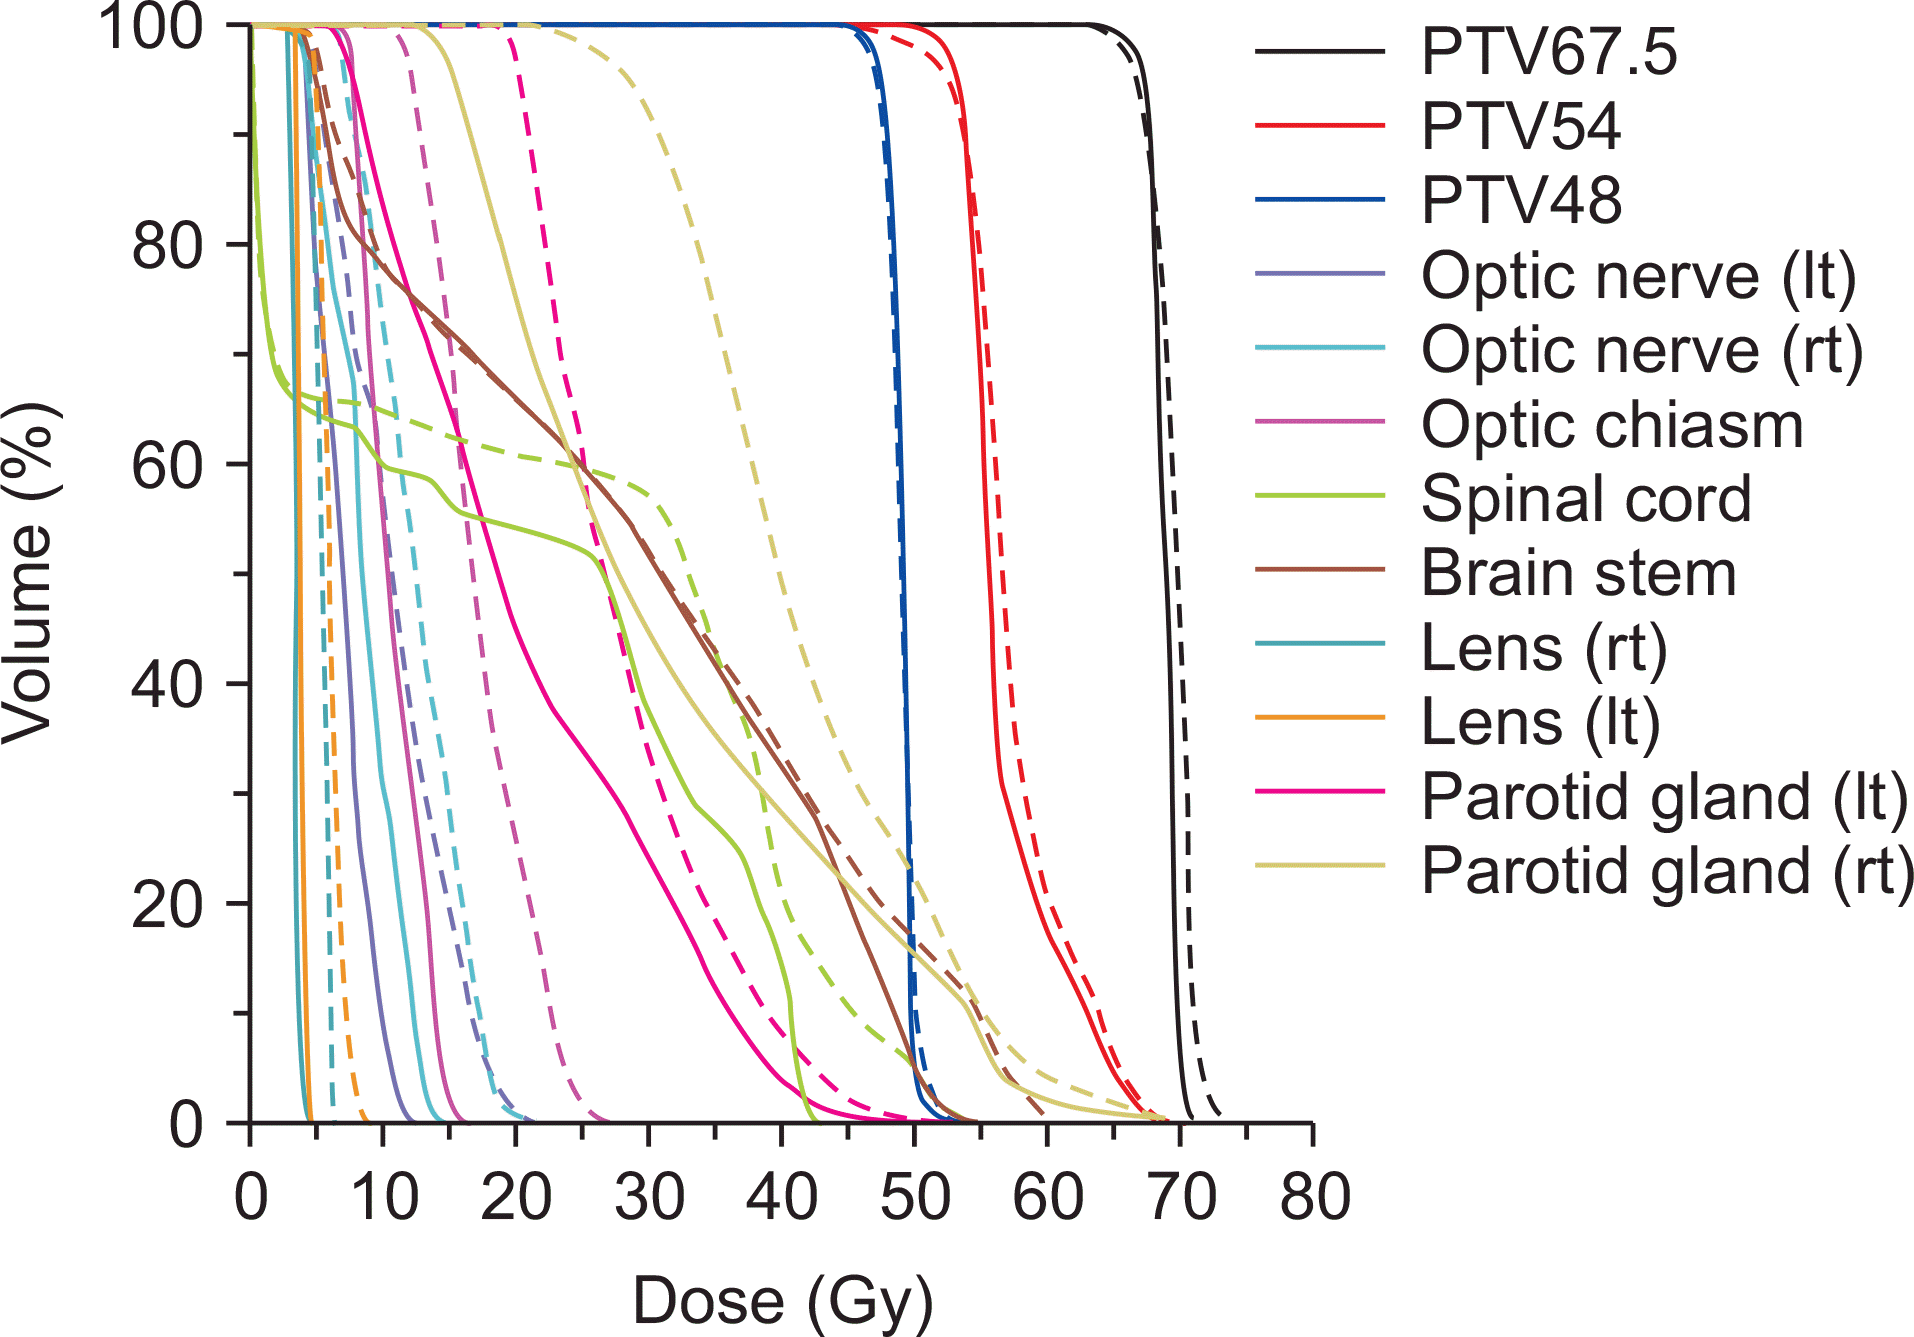
Fig. 2
A representative patient's dose volume histograms (DVHs) for the head and neck case are shown. DVHs from the original plan are plotted with solid lines, while those from the converted plan using the dose volume histogram based plan conversion are plotted with dashed lines.

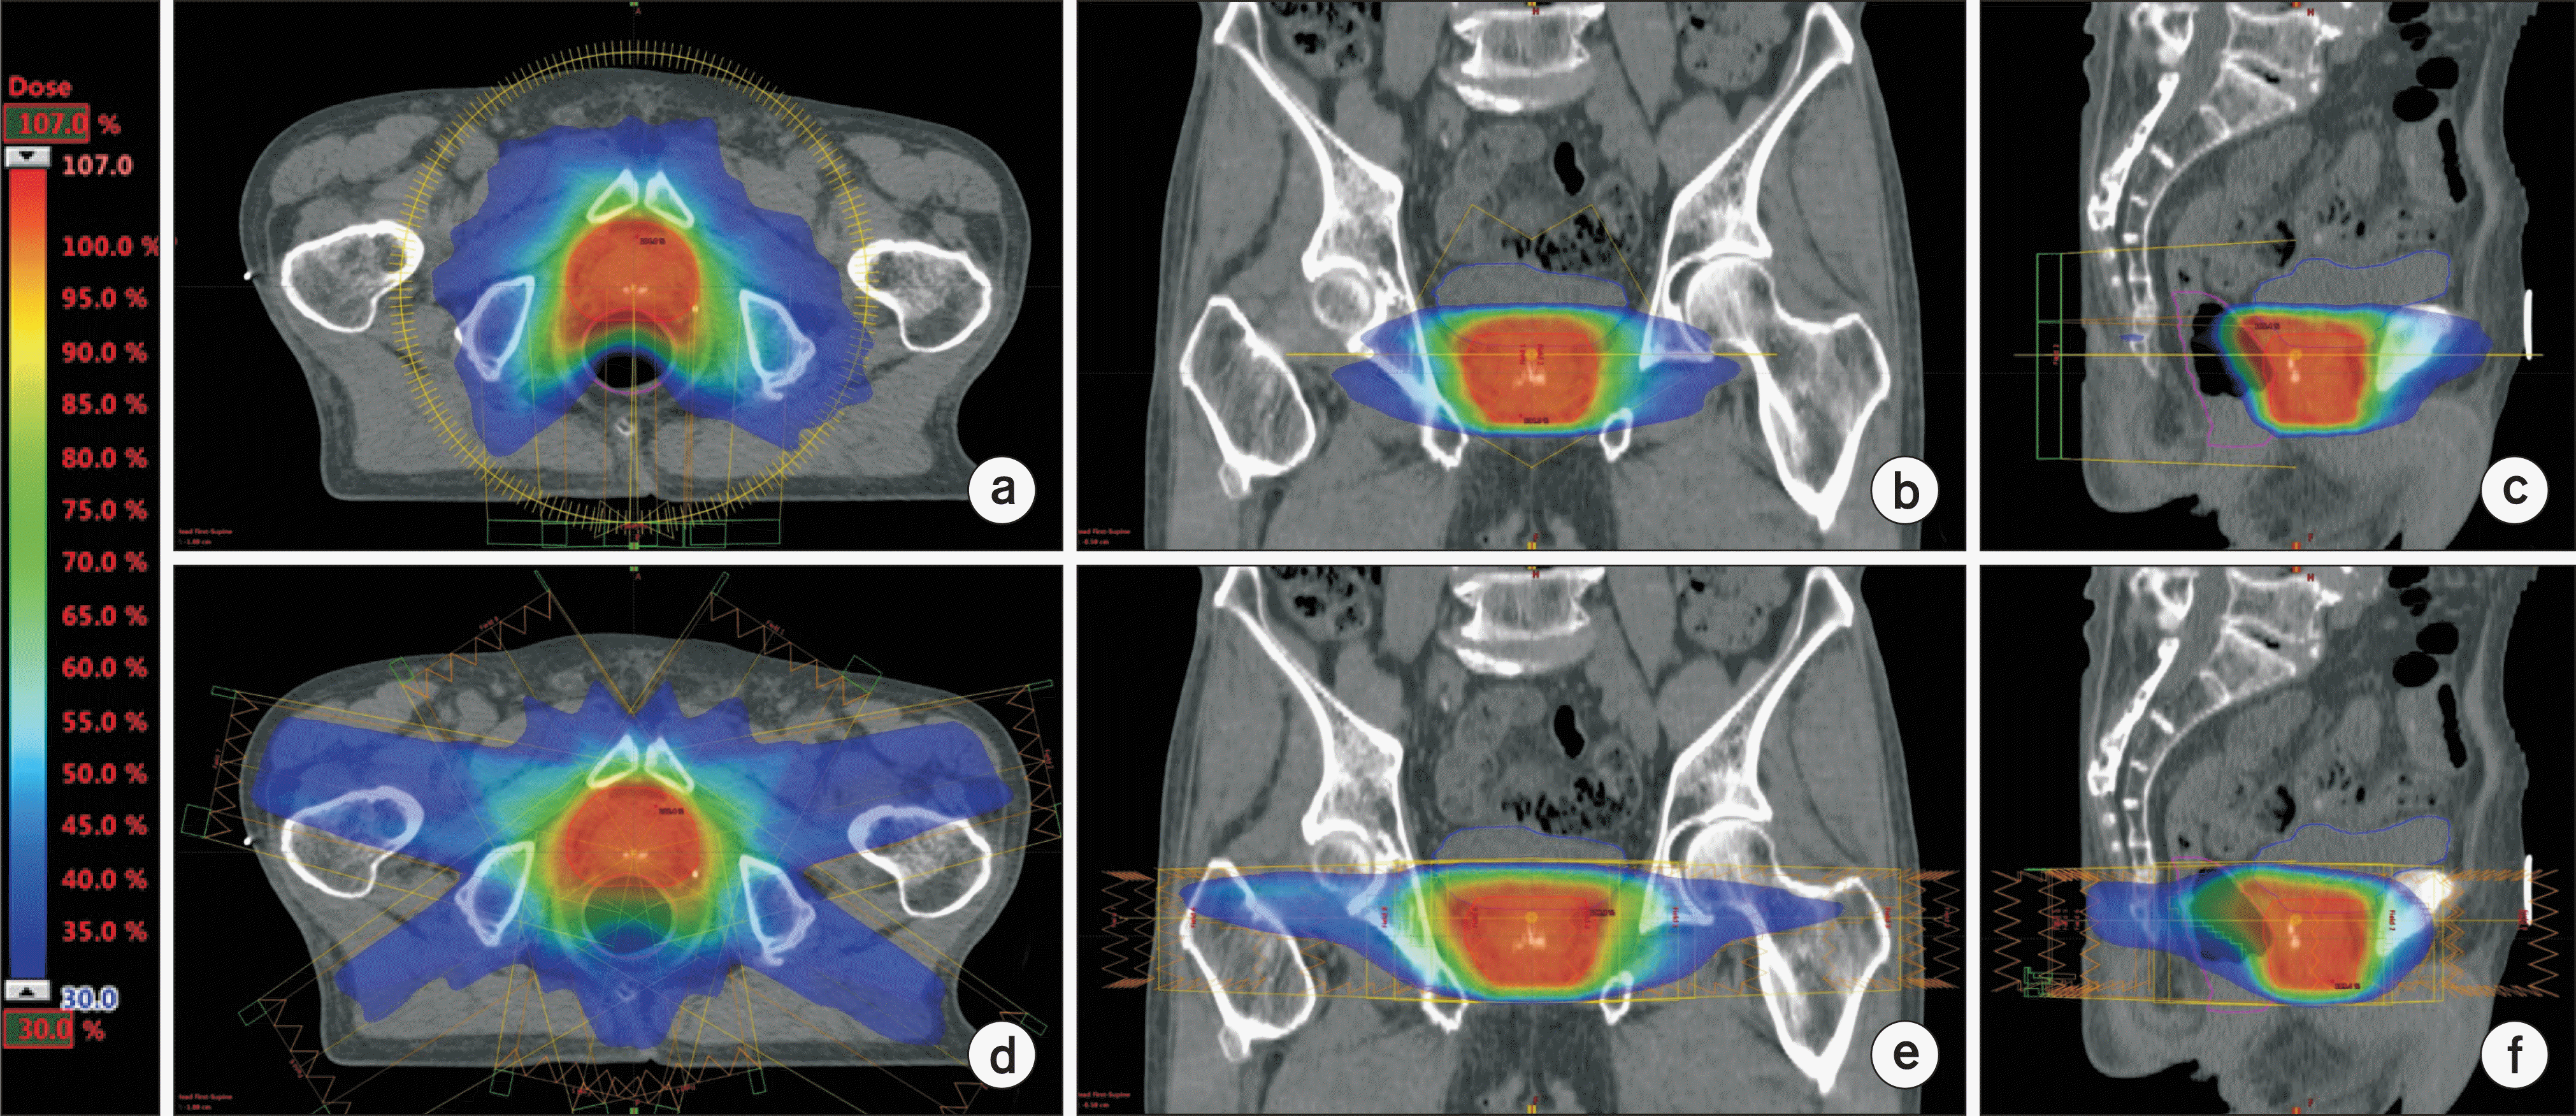
Fig. 3
A representative patient's dose distributions for the prostate case is presented before (upper row) and after (lower row) dose volume histogram based plan conversion. Doses are shown in color wash from 30% of the prescription dose to the maximum dose. Axial (a and d), coronal (b and e), and sagittal (c and f) planes are shown.

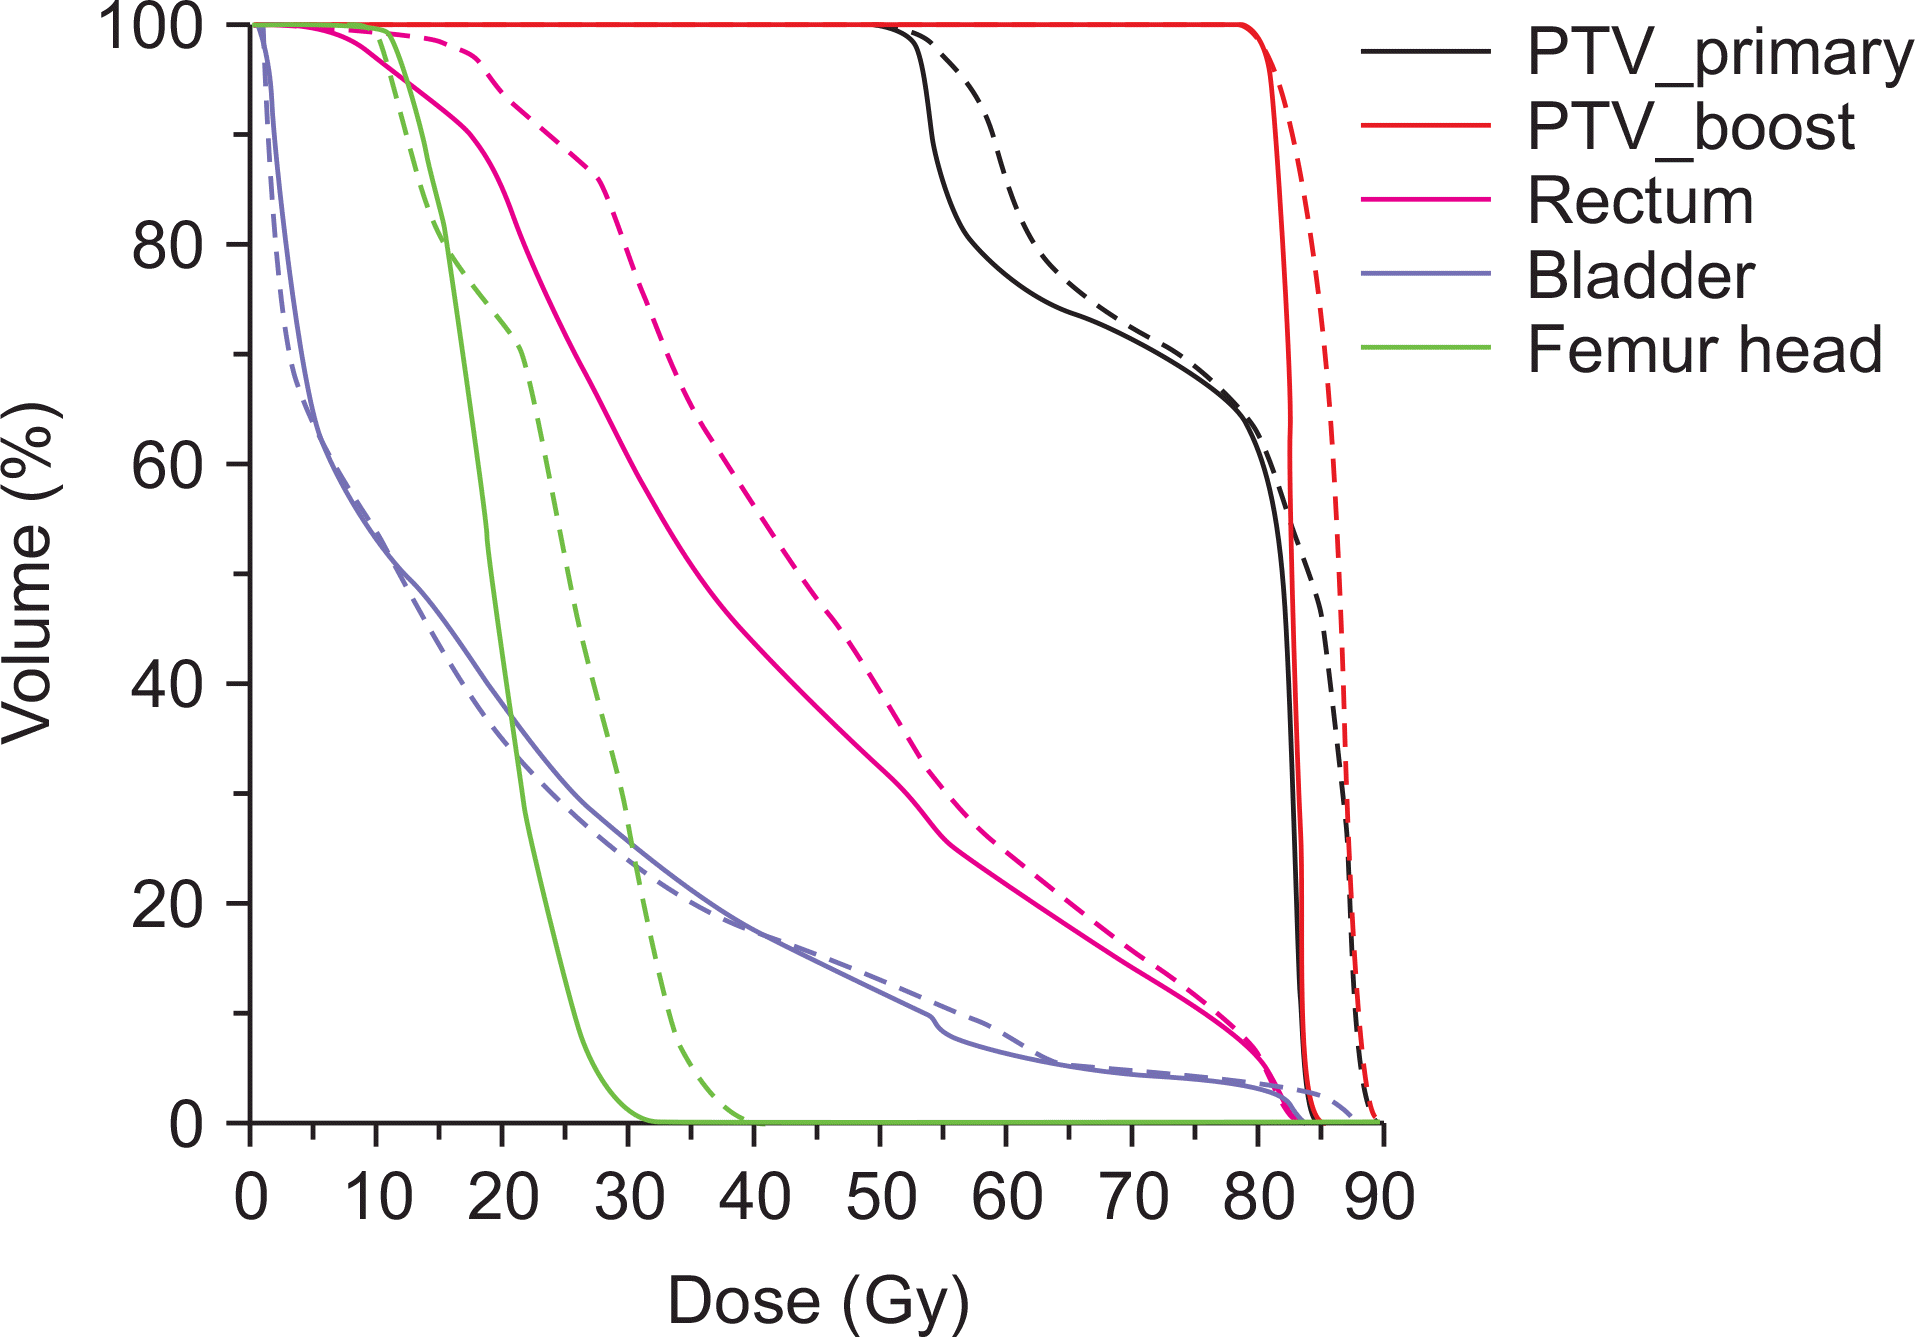
Fig. 4
A representative patient's dose volume histograms (DVHs) for the prostate case are shown. DVHs from the original plan are plotted with solid lines, while those from the converted plan using the dose volume histogram based plan conversion are plotted with dashed lines.

Table 1.
Treatment plan parameters before and after DPC.
| Treatment sites | Original plan | Converted plan | |
|---|---|---|---|
| Head and neck | Na | 5 | |
| Machine | TrueBeam STx | Trilogy | |
| Energy | 6 MV | 6 MV | |
| Treatment Technique | VMATb | SS-IMRTc | |
| d Input NFd | - | 8 | |
| Actual NF | 2 | 14.8±2.2 (13~18) | |
| Total MUe | 581.9±181.0 (467.1~889.7) | 730.4±60.9 (659.1~822.3) | |
| MU/Gy | 258.6±80.5 (207.6~395.4) | 324.6±27.1 (293.0~365.5) | |
| Beam-on time (minutes) | 1.98±0.01 (1.98~2.00) | 1.21±0.14 (1.1~1.5) | |
| Prostate | N | 10 (Primary: 5, Boost: 5) | |
| Machine | Trilogy | TrueBeam STx | |
| Energy | 15 MV | 15 MV | |
| Treatment Technique | VMAT | SS-IMRT | |
| b Input NF | - | 8 | |
| Actual NF | 2 | 8 | |
| Total MU | 490.8±158.8 (365.5~886.2) | 374.3±49.4 (326.6~470.5) | |
| MU/Gy | 272.6±88.2 (203.0~192.3) | 208.0±27.4 (181.4~261.4) | |
| Beam-on time (minutes) | 2.49±0.03 (2.48~2.56) | 0.63±0.08 (0.55~0.79) | |
Table 2.
The DV parameters before and after DPC for the HN VMAT plans.
| Original plan | Converted plan | |
|---|---|---|
| PTV67.5Gy a | ||
| b (Gy) D5% | 70.8±0.6 | 72.1±1.0 |
| D95% (Gy) | 66.9±0.1 | 66.4±0.3 |
| c (Gy) Dmax | 73.3±1.3 | 74.5±1.6 |
| d (Gy) Dmin | 52.0±11.8 | 55.2±61.7 |
| e (Gy) Dmean | 69.0±0.3 | 69.7±0.5 |
| CIf | 1.04±0.08 | 1.19±0.14 |
| HIg | 0.05±0.01 | 0.08±0.02 |
| PTV54Gy | ||
| D5% (Gy) | 65.1±1.3 | 65.6±1.2 |
| D95% (Gy) | 53.6±0.2 | 53.5±1.0 |
| Dmax (Gy) | 70.8±0.8 | 72.7±1.2 |
| Dmin (Gy) | 31.6±5.2 | 35.9±3.7 |
| Dmean (Gy) | 57.4±0.6 | 58.1±0.9 |
| HI | 0.25±0.02 | 0.27±0.03 |
| PTV48Gy | ||
| D5% (Gy) | 51.8±1.3 | 52.5±1.2 |
| D95% (Gy) | 47.7±0.5 | 47.6±0.5 |
| Dmax (Gy) | 57.4±2.9 | 58.4±3.6 |
| Dmin (Gy) | 39.1±3.7 | 41.5±2.9 |
| Dmean (Gy) | 49.7±0.6 | 50.0±0.7 |
| HI | 0.11±0.03 | 0.14±0.04 |
| Organs at risk | ||
| Dmax to optic chiasm (Gy) | 16.5±18.4 | 20.9±19.5 |
| Dmax to left optic nerve (Gy) | 14.9±13.2 | 19.3±16.1 |
| Dmax to right optic nerve (Gy) | 14.6±13.0 | 17.4±13.3 |
| Dmax to spinal cord (Gy) | 42.5±2.1 | 50.0±6.0 |
| Dmax to brain stem (Gy) | 44.7±12.8 | 52.7±12.7 |
| Dmax to left lens (Gy) | 3.8±1.7 | 5.5±3.9 |
| Dmax to right lens (Gy) | 3.5±1.6 | 5.3±3.1 |
| Dmean to left parotid gland (Gy) | 20.2±1.8 | 26.4±2.1 |
| Dmean to right parotid gland (Gy) | 21.0±7.8 | 27.6±10.7 |
Table 3.
The DV parameters before and after DPC for the prostate VMAT plans. Note that the DV parameters for the OARs were evaluated in the sum plan.
| Original plan | Converted plan | |
|---|---|---|
| Primary PTVa | ||
| b (Gy) D5% | 52.2±0.2 | 54.2±1.0 |
| D95% (Gy) | 49.9±0.1 | 49.5±0.1 |
| c (Gy) Dmax | 53.9±0.6 | 55.8±1.3 |
| d (Gy) Dmin | 40.0±10.2 | 42.7±1.3 |
| e (Gy) Dmean | 51.2±0.1 | 52.6±0.5 |
| CIf | 0.92±0.01 | 1.01±0.04 |
| HIg | 0.04±0.01 | 0.09±0.02 |
| Boost PTV | ||
| D5% (Gy) | 31.7±0.1 | 32.3±0.5 |
| D95% (Gy) | 30.3±0.0 | 30.1±0.1 |
| Dmax (Gy) | 32.5±0.2 | 32.7±0.5 |
| Dmin (Gy) | 27.8±0.4 | 27.2±0.6 |
| Dmean (Gy) | 31.1±0.1 | 31.5±0.3 |
| CI | 0.91±0.00 | 0.94±0.03 |
| HI | 0.04±0.00 | 0.07±0.02 |
| Organs at risk Rectum | ||
| D60% (Gy) | 32.1±2.3 | 42.0±4.7 |
| D20% (Gy) | 63.4±2.0 | 66.4±1.8 |
| Dmean (Gy) | 41.7±2.2 | 47.8±3.5 |
| h (cc) V70Gy | 11.0±6.3 | 12.1±7.3 |
| Bladder | ||
| D50% (Gy) | 20.0±11.6 | 20.2±11.3 |
| D20% (Gy) | 49.2±9.6 | 49.4±10.4 |
| Dmean (Gy) | 28.8±9.4 | 28.6±9.1 |
| V70Gy (cc) | 17.4±3.7 | 18.2±4.1 |
| Femur head | ||
| Dmax (Gy) | 31.3±4.4 | 39.3±4.6 |
| Dmean (Gy) | 14.0±4.4 | 16.8±5.3 |
| D50% (Gy) | 13.4±5.5 | 16.8±7.1 |
| D10% (Gy) | 21.9±3.2 | 27.6±3.7 |


 PDF
PDF ePub
ePub Citation
 Print
Print


 XML Download