Journal List > Korean J Ophthalmol > v.33(3) > 1126573

Oh and Ahn: Comparison of Retinal Layer Thickness and Vascular Density between Acute and Chronic Branch Retinal Vein Occlusion

Abstract

Purpose

To compare retinal layer thickness and chorioretinal vascular density (VD) between acute and chronic branch retinal vein occlusion (BRVO).

Methods

This study included patients with BRVO. The VD of the superficial capillary plexus (VDs), the VD of the deep capillary plexus (VDd), and VD of the choriocapillaris were obtained using optical coherence tomography angiography. Acute and chronic BRVO data were compared to assess differences between the involved and uninvolved areas.

Results

We included 17 eyes with acute BRVO and 23 eyes with chronic BRVO. The VDs in the involved area were not significantly different between the involved area and in the uninvolved area in acute BRVO (p = 0.551). However, the difference was significant in chronic BRVO (p = 0.013). The VDd in the involved area was lower than in the uninvolved area in both acute and chronic BRVO (p = 0.020, p = 0.003, respectively). In addition, the VD of the choriocapillaris values did not differ significantly between acute and chronic BRVO, or between involved and uninvolved areas. The VDs in the involved area in chronic BRVO were lower than in acute BRVO (p = 0.047), and the VDd did not differ between acute and chronic BRVO in all areas.

Conclusions

Vascular impaired patterns in the retinal layer differed between acute and chronic BRVO. These results may suggest that vascular change and remodeling develops differently in acute and chronic phases in BRVO.

Optical coherence tomography angiography (OCTA) is an imaging technique that has been recently studied and used to visualize blood vessels with depth resolution [1]. OCTA imaging characteristics in various diseases have been described previously [23456]. However, the majority of previous studies were qualitative, and only a few quantitative studies have been completed. The quantitative studies used imaging programs to measure vascular density (VD). However, these methods were time-consuming, had low reproducibility and potential for error. The software of some OCTA instruments provides data on the VD which is automatically measured; however, these measurements are limited to the retinal vessels. The viewer program of the commercially available swept source OCTA (DRI OCT Triton; Topcon, Tokyo, Japan) only provides the VD of the superficial capillary plexus (SCP). However, the reference layer can be changed freely. The VD values of the SCP, deep capillary plexus (DCP), and choriocapillaris (CC) can be obtained automatically, and the vascular and structural changes were observed using automated measurements. This method allows immediate judgments to be made in the clinical environment by analyzing the images quickly without image processing.
Branch retinal vein occlusion (BRVO) is a common disease that affects visual acuity [7]. BRVO only involves part of the retina, while the uninvolved area is nearly normal. This pathology allows researchers to compare the involved and uninvolved area using a single image. Therefore, the purpose of this study was to compare the retinal layer thickness and the chorioretinal VD between acute and chronic BRVO.

Materials and Methods

Ethics statement

This study was approved by the institutional review board of Korea University (2016AN0285). Informed consent was waived due to the retrospective nature of the study. The research and data collection were conducted in accordance with the tenets of the Declaration of Helsinki from the World Medical Association.

Patients

We reviewed the medical records of consecutive patients who had been diagnosed with BRVO, and who underwent OCTA between March 2016 and February 2018 at Korea University Medical Center. Patients were included if they had a diagnosis of BRVO that was made by retinal specialists. The exclusion criteria were as follows: (1) superonasal or inferonasal BRVO not affecting the macula; (2) the presence of macular edema on optical coherence tomography (OCT) imaging; (3) BRVO due to other causes such as uveitis or vasculitis; (4) BRVO accompanied by arterial occlusion or ocular ischemic syndrome; (5) other ocular diseases such as diabetic retinopathy or epiretinal membrane; (6) a history of intraocular treatment, such as intravitreal injection, laser photocoagulation or intraocular surgery within 6 months; (7) an axial length >26.5 mm; (8) OCTA images with artifacts that affected VD measurement, such as masking artifacts, blinking artifacts, or motion artifacts and (9) poor quality OCTA images (with a signal strength index of <50).
We defined acute BRVO when patients had fundus findings such as intraretinal hemorrhages, cotton wool spots, and vascular congestion [8]. Chronic BRVO was determined when patients had fundus findings such as collaterals, hard exudates, or ghost vessels. However, intraretinal hemorrhage, cotton wool spots, or vascular congestion were not necessarily present.

Optical coherence tomography

The OCT instrument (DRI OCT Triton) used in this study had a central wavelength of 1,050 nm, speed of 100,000 A-scans/second, horizontal resolution of 20 µm, and an axial resolution of 7 µm. The volume scan was performed in a 12 × 9 mm area that covered the macula and optic disc, and each scan consisted of 1024 A-scans centered between the fovea and optic disc. The retinal thickness was measured at the central 1 mm (foveal) and 3 mm (parafoveal) areas in the early treatment of diabetic retinopathy study chart [9]. The ganglion cell layer to inner plexiform layer (GC-IPL) thickness was also measured at the foveal and parafoveal areas. The outer retina layer (ORL) thickness of the macula was defined as the retinal thickness outside the inner plexiform layer. It was calculated in each patient by subtracting the GC-IPL thickness from the central macular thickness. The choroidal thickness was defined as the perpendicular distance from the inner surface of the retinal pigment epithelium to the choroidoscleral interface. All of the OCT parameters were automatically measured using an image viewer software (IMAGEnet 6 ver. 1.21, Topcon).

Optical coherence tomography angiography

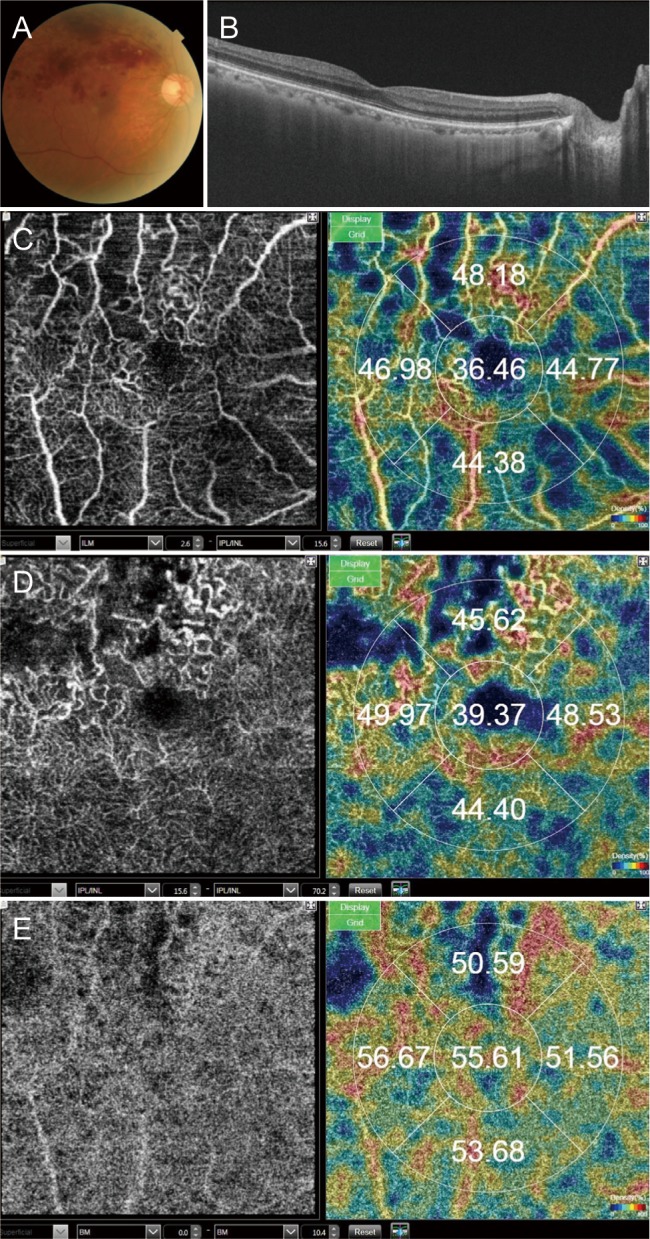
The OCTA images were obtained when the OCT images were acquired. The OCTA scans were taken in a 3 × 3-mm area centered on the macula. Each cube consisted of 320 A-scans of four repeated B-scans centered on the fovea. En face OCTA images of the SCP, DCP, and CC were generated based on automated layer segmentation. This segmentation was performed using image viewer software as follows: (1) SCP, from 2.6 µm posterior to the internal limiting membrane to 15.6 µm posterior to the junction of the inner plexiform layer and inner nuclear layer; (2) DCP, an 54.6-µm-thick slab from the 15.6 µm posterior to the junction of the inner plexiform layer and inner nuclear layer; and (3) CC, a 10.4-µm-thick slab from Bruch's membrane. The software provided a VD of the SCP at the foveal and parafoveal areas. The VD of the DCP (VDd) and CC were obtained by changing the reference layers (Fig. 1A–1E). The involved area was defined as the parafoveal area with vascular changes on the OCTA. All of the parameters in the involved area were calculated as the average parameters in each involved area.

Ocular perfusion pressure estimation

The mean ocular perfusion pressure (OPP) was calculated using the following formula: 23kjo-33-238-i005.jpg×mean arterial pressure-intraocular pressure [10]. The mean arterial pressure was calculated based on the systolic blood pressure (SBP) and diastolic blood pressure (DBP) as follows: 13kjo-33-238-i006.jpg×(SBP−DBP)+DBP. After at least 15 minutes of rest, the blood pressure was measured on the upper arm with the patient in a seated position, using an automated oscillometric machine (BPBIO320; InBody, Seoul, Korea).

Statistical analysis

Continuous variables were expressed as means ± standard deviations, and categorical variables as counts (%). The Kolmogorov-Smirnov test was used to test the variables' normality. The general characteristics and parameters of patients with acute and chronic BRVO were compared using Pearson's chi-squared test or Fisher's exact test for categorical variables. The independent t-test or Mann-Whitney U-test was used to compare continuous variables. The parameters in the parafoveal involved area and the uninvolved area were compared using the paired t-test and Wilcoxon signed-rank test.
Univariate linear regression or multiple linear regression analyses were used to assess the relationships among variables. The backward variable elimination method was used to select for important variables in multiple linear regression models. These variables only included covariates with p < 0.10 in the univariate linear regression models. Statistical analyses were performed using IBM SPSS Statistics ver. 24.0 (IBM Corp., Armonk, NY, USA). A p-values <0.05 was considered statistically significant.

Results

General characteristics

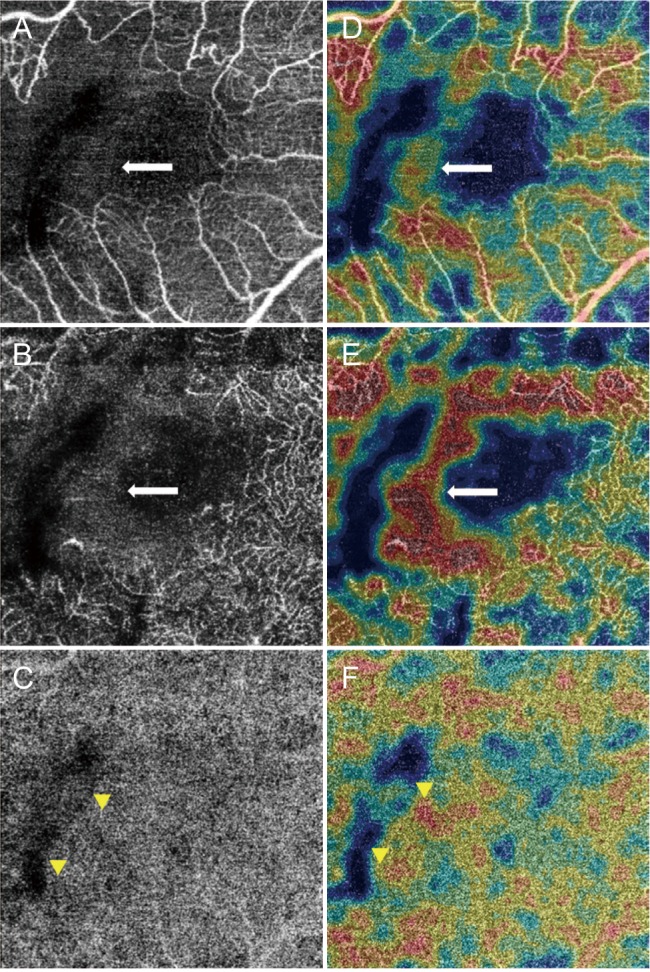
Forty-seven patients with BRVO, including 21 patients with acute BRVO and 26 patients with chronic BRVO, were included. A total of seven patients, including four with acute BRVO and three with chronic BRVO, had high stromal decorrelation signals in the OCTA images (Fig. 2A–2F) [11]. This high stromal decorrelation signal was detected in an area of wide capillary nonperfusion. The stromal decorrelation signal, which is higher than the signal from the surrounding capillary nonperfusion area, was measured as high as the VD (when it was measured automatically). The patients with high stromal decorrelation signal were excluded in the analysis because the VD was overestimated.
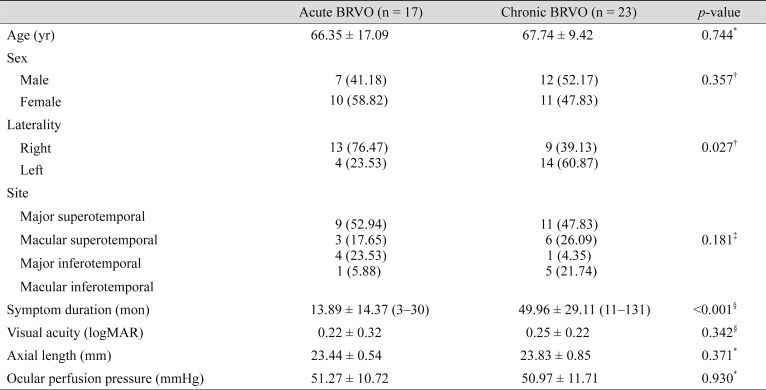
Table 1 shows the general characteristics of 40 patients, 17 of which had acute BRVO and 23 had chronic BRVO. The age, visual acuity, axial length, and OPP were not significantly different between patients with acute and chronic BRVO. The symptom duration was shorter in patients with acute BRVO (13.89 ± 14.37 months) than it was in patients with chronic BRVO (49.96 ± 29.11 months, p < 0.001).

Neuronal and vascular characteristics in acute BRVO

In 17 patients with acute BRVO, the retinal thickness, GC-IPL thickness, ORL thickness, and choroidal thickness did not differ between the involved and uninvolved areas (p = 0.246, p = 0.722, p = 0.136, p = 0.152, respectively) (Table 2 and Fig. 3A, 3B). The VD of SCP (VDs) did not differ in the involved and uninvolved areas (p = 0.551). However, the VDd in the involved area was lower than in the uninvolved area (p = 0.020). The VD of CC (VDc) did not differ between the involved and uninvolved areas (p = 0.309).

Neuronal and vascular characteristics in chronic BRVO

In 23 patients with chronic BRVO, the retinal thickness and GC-IPL thickness in the involved area (280.36 ± 39.83, 96.82 ± 24.34 µm, respectively) were thinner than in the uninvolved area (293.83 ± 32.01 µm, p = 0.008; 106.78 ± 24.02 µm, p = 0.024, respectively). The ORL and choroidal thicknesses did not differ between the involved and uninvolved areas (p = 0.114, p = 0.734, respectively). The VDs in the involved area were lower than in the uninvolved area (p = 0.013). The VDd in the involved area were lower than in the uninvolved area (p = 0.013). The VDc did not differ between the involved and uninvolved areas (p = 0.648).

Acute and chronic BRVO comparison

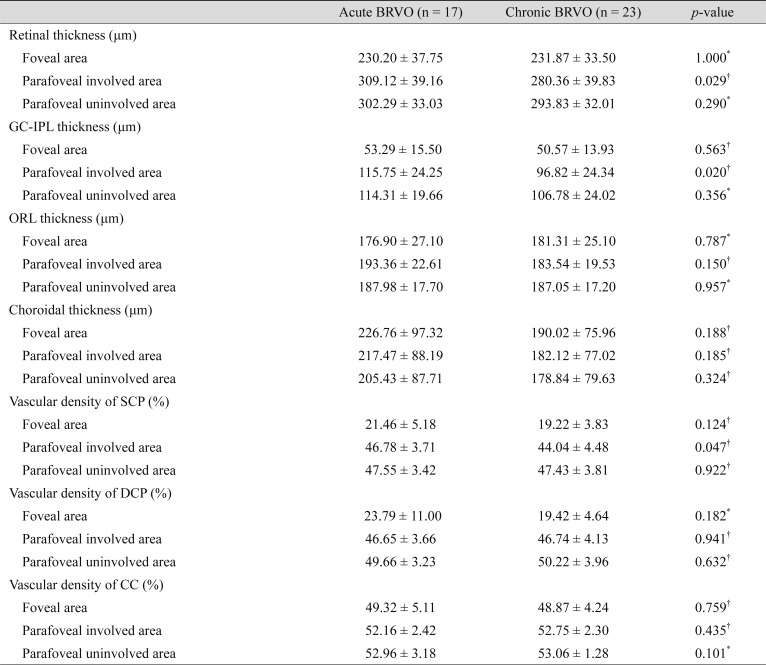
The retinal thickness in the involved area of chronic BRVO (280.36 ± 39.83 µm) was thinner than in acute BRVO (309.12 ± 39.16 µm, p = 0.029) (Table 3). The retinal thickness in the foveal area and uninvolved area in chronic BRVO did not vary, compared with acute BRVO (p = 1.000, p = 0.290, respectively). The GC-IPL thickness in the involved area of chronic BRVO (96.82 ± 24.34 µm) was thinner than for acute BRVO (115.75 ± 24.25 µm, p = 0.020). The GC-IPL thickness in the foveal area and uninvolved area in chronic BRVO did not vary compared with acute BRVO (p = 0.563, p = 0.356, respectively). The ORL thickness and choroidal thickness also did not differ between acute and chronic BRVO in all areas.
The VDs in the involved area of chronic BRVO (44.04 ± 4.48%) was lower than for acute BRVO (46.78 ± 3.71%, p = 0.047). The VDs in the foveal and uninvolved area in chronic BRVO did not vary, compared with acute BRVO (p = 0.124, p = 0.922, respectively). The VDd did not differ between acute and chronic BRVO in all areas, including the involved area. The VDc values did not differ between acute and chronic BRVO in all areas.

Visual acuity and symptom duration

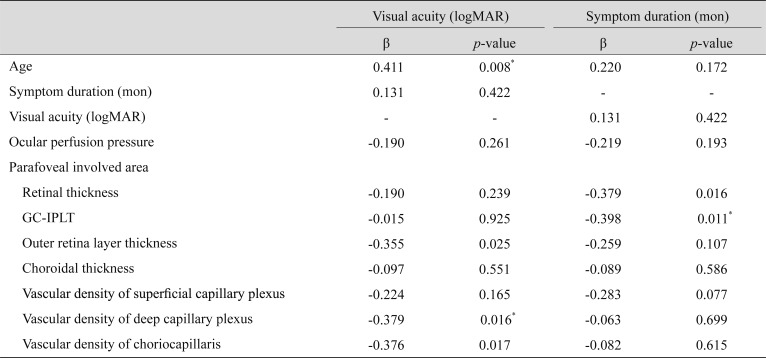
Univariate linear regression analysis indicated that visual acuity was correlated with the following parameters: age (p = 0.008); the ORL thickness in the involved area (p = 0.025); the VDd in the involved area (p = 0.016); and the VDc in the involved area (p = 0.017) (Table 4). Both the age (β = 0.326, p = 0.023) and VDd in the involved area (β = -0.291, p = 0.042) were significantly related to visual acuity on the multiple linear regression model. The ORL thickness in the involved area was considered as a confounder-adjusted factor and was not analyzed because of multicollinearity.
Univariate linear regression analysis indicated that symptom duration was correlated with retinal thickness in the involved area (β = −0.379, p = 0.016), and GC-IPL thickness in the involved area (β = −0.398, p = 0.011). The GC-IPL thickness in the involved area was statistically related to the symptom duration on the multiple linear regression model. The retinal thickness in the involved area and VDs in the involved area were considered to be confounder-adjusted factors. These were also not analyzed because of multicollinearity.

Discussion

In this study, we showed that structural and vascular changes did not differ between acute and chronic BRVO. Retinal layer thickness did not differ between involved and uninvolved layers in acute BRVO, however, VDd was significantly different between involved and uninvolved layers. Meanwhile, in chronic BRVO, inner retinal layer thickness was significantly thinner in the involved layers than in uninvolved layers. In addition, VD was also significantly lower in the involved layers in both SCP and DCP. These results may suggest that the mechanism of vascular change in DCP was different from SCP. In this study, the VDd was lower in the involved area than in the uninvolved area, in both acute and chronic BRVO. There was no significant difference between acute and chronic BRVO, and it has been hypothesized that BRVO mainly affects the DCP. This result is consistent with results from previous studies [121314]. Previous studies have suggested that the DCP was more vulnerable to ischemia than the SCP. However, the VDs in the involved area were lower in chronic BRVO than in acute BRVO. The VDs of the involved and uninvolved areas were comparable in acute BRVO. In contrast, in chronic BRVO, the VDs in the involved area were lower than in the uninvolved area. The VDs are thought to be preserved at the onset of BRVO, with gradual lowering over time. There is a moderate correlation between VDs and symptom duration. These results may suggest that damage to the inner retina decreases the oxygen demand, which ultimately decreases the blood flow to the SCP in chronic BRVO.
We also investigated CC, which is not typically reported in studies on BRVO. The VDc did not differ between cases of acute and chronic BRVO. Although this result was not statistically significant, the VDc was lower in the involved area than in the uninvolved area in both acute and chronic BRVO. In particular, the low VDc value was well observed in patients with high stromal decorrelation signals (Fig. 2). Further investigation is needed to determine if the oxygen demand of the inner retina affects the blood flow of the CC.
In multivariate linear regression analysis, the factors that affected visual acuity were age and VDd. These findings were consistent with those from previous studies, which found that VDd was an important factor for visual acuity during OCTA [8151617]. The DCP is thought to play an important role in oxygen supply to the photoreceptor [18]. We also found that age affected visual acuity. Previous studies have also found that age may affect vision, due to anatomical and neurological changes in the eye and visual pathway [1920212223]. However, only the visual performance, including reading speed or contrast sensitivity, deteriorates. Visual acuity is well-maintained in older adults without disease. Based on these results, if a disease affects the macula, the visual acuity may be impacted, particularly in older patients. This finding suggests that older individuals are more vulnerable to these types of diseases, because their peripheral vision declines with age [24].
The OCT parameters in this study were similar to those reported in a previous study [25]. In cases of chronic BRVO, the GC-IPL thickness in the involved area was lower than in the uninvolved area, however, the ORL thickness was preserved, regardless of the BRVO. Multivariate linear regression analysis showed that the GC-IPL thickness affected symptom duration. This result is similar to that of previous studies, which found that after BRVO development, there is progressive retinal nerve fiber layer thinning over time [26]. In acute BRVO, there was no difference between the GC-IPL thickness in the involved and uninvolved areas. In general, the retinal thickness in the involved area is thicker than in the uninvolved area due to edema. In this study, we specifically excluded subjects with retinal edema because retinal edema leads to underestimation of the VD in OCTA images, and especially the DCP [2728]. There were no differences in the choroidal thicknesses between the involved and uninvolved areas. The hypothesis that retinal ischemia leads to increased vascular endothelial growth factor (VEGF) production, and ultimately thickens the choroid, is now accepted [2930]. In cases of BRVO with macular edema, there is controversy and ongoing discussion about whether there is a difference in the choroidal thickness between the involved and uninvolved areas [3132]. The choroidal thickness in chronic BRVO does not differ from the corresponding eye, given the normalized VEGF level [33]. In this study, we analyzed the BRVO without macular edema. In cases of BRVO without macular edema, the VEGF level was lower than in BRVO with macular edema, which would not affect the choroidal thickness.
Previous OCT studies have employed spectral domain OCT, however spectral domain OCT has limited penetration. In addition, it is difficult to automatically measure choroidal thickness. Therefore, the studies only used the choroidal thickness of the subfoveal area, or of specific points. The swept source OCT used in this study clearly demonstrates the choroidoscleral junction without an averaging process. This allowed accurate automated measurement of choroidal thickness by specific region. The CC measurement using OCTA may also be advantageous because of swept source OCT, compared to the spectral domain OCT, for the same reason.
The OPP was determined using blood pressure and intraocular pressure. Hypertension is a risk factor for BRVO. Several prior studies have shown that the OPP affects choroidal disease [343536]. Therefore, it is important to consider the effect of OPP when studying OCTA. We measured whether OPP affects eyes with BRVO, however, there were no factors that were associated with OPP (Supplementary Table 1). These results are comparable to those previously reported by our research team, in which we found that there was no association between OPP and OCTA findings in retinal disease [37].
In the OCTA images, there was a high stromal decorrelation signal observed in wide capillary nonperfusion. This phenomenon leads to overestimation of the VD by automated measurement. Therefore, human judgment is required when using the automatically measured VD. This is one of the limitations of this study. Although it is more accurate to use the method of measuring VD through binarization, this approach is difficult to assess quickly in a clinical environment. This study confirms the utility of automated VD measurements in OCTA images.
There were some other limitations to this study. The first is the retrospective and cross-sectional design, which makes it vulnerable to inherent biases. The second is incorrect symptom duration. The symptom duration was based on the patient's statement; therefore, this could differ from the actual time of the disease progression. However, in patients with chronic BRVO, the symptom duration was longer than in patients with acute BRVO. The result indicated that the symptom duration experienced by the patient was related to the timing of actual disease. Third, the OCTA software provides a parafoveal area with a diameter of 2.5 mm, while the OCT software provides a diameter of 3 mm. Therefore, there is a discrepancy in the area of measurement. Finally, the OCTA software used in this study does not provide data on the foveal avascular zone, or the flow void area of the CC. The foveal avascular zone is known to be affected by BRVO and is provided by other OCTA software. The flow void area of the CC is a region where blood flow is depressed. This area provides additional information about the status of CC. Therefore, additional studies are needed to investigate the automatically measured foveal avascular zone and flow void area of the CC.
In conclusion, neuronal structural and vascular impaired patterns in the retinal layer differed between acute and chronic BRVO. These results suggest that neuronal structural and vascular change and remodeling develop differently in acute and chronic phases in BRVO, and that changes in the acute phase, such as the deep vascular layer could be important factors for visual prognosis.

Acknowledgements

This manuscript is based upon work supported by the Ministry of Trade, Industry & Energy (MOTIE, Korea) under Industrial Technology Innovation (10063364).

Notes

Conflict of Interest: Oh J is a consultant of Topcon Corporation, but he did not contribute to this work in any relationship with the company or its products. The other author does not have any competing interests to declare.

References

1. Huang Y, Zhang Q, Thorell MR, et al. Swept-source OCT angiography of the retinal vasculature using intensity differentiation-based optical microangiography algorithms. Ophthalmic Surg Lasers Imaging Retina. 2014; 45:382–389. PMID: 25230403.
crossref
2. Kuehlewein L, Bansal M, Lenis TL, et al. Optical coherence tomography angiography of type 1 neovascularization in age-related macular degeneration. Am J Ophthalmol. 2015; 160:739–748. PMID: 26164826.
3. El Ameen A, Cohen SY, Semoun O, et al. Type 2 neovascularization secondary to age-related macular degeneration imaged by optical coherence tomography angiography. Retina. 2015; 35:2212–2218. PMID: 26441269.
crossref
4. Miere A, Querques G, Semoun O, et al. Optical coherence tomography angiography in early type 3 neovascularization. Retina. 2015; 35:2236–2241. PMID: 26457399.
crossref
5. Hwang TS, Jia Y, Gao SS, et al. Optical coherence tomography angiography features of diabetic retinopathy. Retina. 2015; 35:2371–2376. PMID: 26308529.
crossref
6. Zhang Q, Wang RK, Chen CL, et al. Swept source optical coherence tomography angiography of neovascular macular telangiectasia type 2. Retina. 2015; 35:2285–2299. PMID: 26457402.
crossref
7. Jaulim A, Ahmed B, Khanam T, Chatziralli IP. Branch retinal vein occlusion: epidemiology, pathogenesis, risk factors, clinical features, diagnosis, and complications. An update of the literature. Retina. 2013; 33:901–910. PMID: 23609064.
8. Chung CY, Tang HH, Li SH, Li KK. Differential microvascular assessment of retinal vein occlusion with coherence tomography angiography and fluorescein angiography: a blinded comparative study. Int Ophthalmol. 2018; 38:1119–1128. PMID: 28550346.
crossref
9. Early Treatment Diabetic Retinopathy Study Research Group. Grading diabetic retinopathy from stereoscopic color fundus photographs: an extension of the modified Airlie House classification. ETDRS report number 10. Ophthalmology. 1991; 98(5 Suppl):786–806. PMID: 2062513.
10. Gherghel D, Orgul S, Gugleta K, et al. Relationship between ocular perfusion pressure and retrobulbar blood flow in patients with glaucoma with progressive damage. Am J Ophthalmol. 2000; 130:597–605. PMID: 11078838.
crossref
11. Chen FK, Viljoen RD, Bukowska DM. Classification of image artefacts in optical coherence tomography angiography of the choroid in macular diseases. Clin Exp Ophthalmol. 2016; 44:388–399. PMID: 26584465.
crossref
12. Coscas F, Glacet-Bernard A, Miere A, et al. Optical coherence tomography angiography in retinal vein occlusion: evaluation of superficial and deep capillary plexa. Am J Ophthalmol. 2016; 161:160–171. PMID: 26476211.
13. Kashani AH, Lee SY, Moshfeghi A, et al. Optical coherence tomography angiography of retinal venous occlusion. Retina. 2015; 35:2323–2331. PMID: 26457395.
crossref
14. Philippakis E, Dupas B, Bonnin P, et al. Optical coherence tomography angiography shows deep capillary plexus hypoperfusion in incomplete central retinal artery occlusion. Retin Cases Brief Rep. 2015; 9:333–338. PMID: 26355822.
crossref
15. Scarinci F, Nesper PL, Fawzi AA. Deep retinal capillary nonperfusion is associated with photoreceptor disruption in diabetic macular ischemia. Am J Ophthalmol. 2016; 168:129–138. PMID: 27173374.
crossref
16. Kang JW, Yoo R, Jo YH, Kim HC. Correlation of microvascular structures on optical coherence tomography angiography with visual acuity in retinal vein occlusion. Retina. 2017; 37:1700–1709. PMID: 27828907.
crossref
17. Wakabayashi T, Sato T, Hara-Ueno C, et al. Retinal microvasculature and visual acuity in eyes with branch retinal vein occlusion: imaging analysis by optical coherence tomography angiography. Invest Ophthalmol Vis Sci. 2017; 58:2087–2094. PMID: 28388705.
crossref
18. Birol G, Wang S, Budzynski E, et al. Oxygen distribution and consumption in the macaque retina. Am J Physiol Heart Circ Physiol. 2007; 293:H1696–H1704. PMID: 17557923.
crossref
19. Salthouse TA, Hancock HE, Meinz EJ, Hambrick DZ. Interrelations of age, visual acuity, and cognitive functioning. J Gerontol B Psychol Sci Soc Sci. 1996; 51:P317–P330. PMID: 8931619.
crossref
20. Pitts DG. Visual acuity as a function of age. J Am Optom Assoc. 1982; 53:117–124. PMID: 7069103.
21. Gittings NS, Fozard JL. Age related changes in visual acuity. Exp Gerontol. 1986; 21:423–433. PMID: 3493168.
crossref
22. Scialfa CT, Cordazzo S, Bubric K, Lyon J. Aging and visual crowding. J Gerontol B Psychol Sci Soc Sci. 2013; 68:522–528. PMID: 23009956.
crossref
23. Adams AJ, Wong LS, Wong L, Gould B. Visual acuity changes with age: some new perspectives. Am J Optom Physiol Opt. 1988; 65:403–406. PMID: 3407728.
24. Collins MJ, Brown B, Bowman KJ. Peripheral visual acuity and age. Ophthalmic Physiol Opt. 1989; 9:314–316. PMID: 2622675.
crossref
25. Lim HB, Kim MS, Jo YJ, Kim JY. Prediction of retinal ischemia in branch retinal vein occlusion: spectral-domain optical coherence tomography study. Invest Ophthalmol Vis Sci. 2015; 56:6622–6629. PMID: 26465891.
crossref
26. Kim CS, Shin KS, Lee HJ, et al. Sectoral retinal nerve fiber layer thinning in branch retinal vein occlusion. Retina. 2014; 34:525–530. PMID: 23958844.
crossref
27. Lee J, Moon BG, Cho AR, Yoon YH. Optical coherence tomography angiography of DME and its association with anti-VEGF treatment response. Ophthalmology. 2016; 123:2368–2375. PMID: 27613201.
crossref
28. Spaide RF. Retinal vascular cystoid macular edema: review and new theory. Retina. 2016; 36:1823–1842. PMID: 27328171.
29. Aiello LP, Northrup JM, Keyt BA, et al. Hypoxic regulation of vascular endothelial growth factor in retinal cells. Arch Ophthalmol. 1995; 113:1538–1544. PMID: 7487623.
crossref
30. Tilton RG, Chang KC, LeJeune WS, et al. Role for nitric oxide in the hyperpermeability and hemodynamic changes induced by intravenous VEGF. Invest Ophthalmol Vis Sci. 1999; 40:689–696. PMID: 10067972.
31. Kim KH, Lee DH, Lee JJ, et al. Regional choroidal thickness changes in branch retinal vein occlusion with macular edema. Ophthalmologica. 2015; 234:109–118. PMID: 26305536.
crossref
32. Shin YU, Lee MJ, Lee BR. Choroidal maps in different types of macular edema in branch retinal vein occlusion using swept-source optical coherence tomography. Am J Ophthalmol. 2015; 160:328–334. PMID: 25959899.
crossref
33. Du KF, Xu L, Shao L, et al. Subfoveal choroidal thickness in retinal vein occlusion. Ophthalmology. 2013; 120:2749–2750. PMID: 24246829.
crossref
34. Rishi P, Rishi E, Mathur G, Raval V. Ocular perfusion pressure and choroidal thickness in eyes with polypoidal choroidal vasculopathy, wet-age-related macular degeneration, and normals. Eye (Lond). 2013; 27:1038–1043. PMID: 23764988.
crossref
35. Yun C, Ahn J, Kim M, et al. Ocular perfusion pressure and choroidal thickness in early age-related macular degeneration patients with reticular pseudodrusen. Invest Ophthalmol Vis Sci. 2016; 57:6604–6609. PMID: 27926751.
crossref
36. Yun C, Han JY, Cho S, et al. Ocular perfusion pressure and choroidal thickness in central serous chorioretinopathy and pigment epitheliopathy. Retina. 2019; 39:143–149. PMID: 29095356.
crossref
37. Ahn J, Yoo G, Kim JT, et al. Choriocapillaris layer imaging with swept-source optical coherence tomography angiography in lamellar and full-thickness macular hole. Graefes Arch Clin Exp Ophthalmol. 2018; 256:11–21. PMID: 29032413.
crossref

Supplementary Material

Supplementary Table 1

Univariate linear regression analysis of ocular perfusion pressure factors in branch retinal vein occlusion
kjo-33-238-s001.pdf
Fig. 1

A branch retinal vein occlusion case. (A) Fundus photograph. (B) B-scan image of optical coherence tomography shows no edema. (C) En face image of optical coherence tomography angiography (OCTA) of the superficial capillary plexus and automatically measured vascular density. (D) En face image of OCTA of the deep capillary plexus and automatically measured vascular density. (E) En face image of OCTA of the choriocapillaris and automatically measured vascular density.

kjo-33-238-g001
Fig. 2

A branch retinal vein occlusion with high stromal decorrelation signal. The stromal decorrelation signal (arrows) in optical coherence tomography angiography images (A–C) of the superficial capillary plexus (A,D) and deep capillary plexus (B,E) was measured as high vascular density when measured automatically (D–F). The vascular density of the choriocapillaris (C,F) was low within the wide capillary nonperfusion area of the superficial and deep capillary plexus (arrowheads).

kjo-33-238-g002
Fig. 3

Chorioretinal thicknesses and vascular densities of parafoveal areas. (A) Chorioretinal thicknesses. The ganglion cell layer to inner plexiform layer (GC-IPL) thickness in the involved area of chronic branch retinal vein occlusion (BRVO) was thinner than that of the uninvolved area of chronic BRVO or the involved area of acute BRVO. (B) Vascular densities. The vascular density of the superficial capillary plexus (SCP) in the involved area of chronic BRVO was lower than that of the uninvolved area of chronic BRVO or the involved area of acute BRVO. The vascular density of the deep capillary plexus (DCP) in the involved area of acute and chronic BRVO was lower than that of the uninvolved area. The chorioretinal thicknesses and vascular densities that were statistically significantly different are denoted with asterisks. CC = choriocapillaris.

kjo-33-238-g003
Table 1

Patient characteristics: acute and chronic BRVO

kjo-33-238-i001

Values are presented as mean ± standard deviation, number (%), or mean ± standard deviation (range).

BRVO = branch retinal vein occlusion; logMAR = logarithm of the minimum angle of resolution.

*Independent t-test; Fisher's exact test; Pearson's chi-squared test; §Mann-Whitney U-test.

Table 2

Optical coherence tomography and optical coherence tomography angiography parameter comparisons between parafoveal involved and uninvolved areas

kjo-33-238-i002

Values are as mean ± standard deviation.

BRVO = branch retinal vein occlusion; GC-IPL = ganglion cell layer to inner plexiform layer; ORL = outer retina layer; SCP = superficial capillary plexus; DCP = deep capillary plexus; CC = choriocapillaris.

*Wilcoxon signed-rank test; Paired t-test.

Table 3

Optical coherence tomography and optical coherence tomography angiography parameter comparisons between acute and chronic BRVO

kjo-33-238-i003

Values are as mean ± standard deviation.

BRVO = branch retinal vein occlusion; GC-IPL = ganglion cell layer to inner plexiform layer; ORL = outer retina layer; SCP = superficial capillary plexus; DCP = deep capillary plexus; CC = choriocapillaris.

*Mann-Whitney U-test; Independent t-test.

Table 4

Univariate linear regression analysis of visual acuity and symptom duration factors in branch retinal vein occlusion

kjo-33-238-i004

logMAR = logarithm of the minimum angle of resolution; GC-IPLT = thickness between ganglion cell layer to inner plexiform layer.

*p < 0.05 by results using backward variable elimination in the multiple linear regression models including only the covariates with p < 0.10.

TOOLS
Similar articles