

 PDF
PDF ePub
ePub Citation
 Print
Print


Introduction
Alcohol-induced flushing syndrome (AFS) is the condition commonly found among Asian population groups. It triggers flushing reaction, redness in face and body, even after small volume of alcohol intake. There are numerous studies currently available, exploring the possible cause and mechanism for Asians to develop flushing reaction [123]. The ethanol metabolism pathway is composed of two distinct parts-first, alcohol particles are broken down into acetaldehyde, catalyzed by alcohol dehydrogenase (ADH) family, then acetaldehyde is further oxidized into acetate by aldehyde dehydrogenase (ALDH) [45]. However, for any reason, when ADH and ALDH acquire variants in their genes, they fail to break down the byproducts and cause the acetaldehyde to build up in blood. This, as a result, can lead to flushing reaction, which is recognized as one of the alcohol hypersensitivity responses [5678].
For people with variants in these genetic components often result in the buildup of acetaldehyde in blood, which triggers the facial flushing [5691011]. Furthermore, a comprehensive family study done regarding alcohol hypersensitivity responses suggested that flushing reaction was inherited as dominant trait [8910].
This study was designed in order to explore the specific markers associated with AFS in Korean population, hoping to find Korean specific AFS markers that be integrated into developing proper platforms and protocols to establish propensity prediction model. This prediction model is expected to provide supplementary investigative information, which can be utilized in real forensic applications to narrow down the investigative pool in crime scenes as well as mass disaster or even in finding missing persons.
Materials and Methods
1. Participants and sample collection
Subjects volunteered to participate in this study for sample collection. Blood samples were obtained from volunteers, after getting informed consent. The blood samples were extracted using the Maxwell 16 instrument (Promega, Madison, WI, USA), and reagents, following the manufacturer's protocols. Quantity of DNA was determined by the QuantStudio 5 Real-Time PCR System (Thermo Fisher, Waltham, MA, USA) using the Quantifiler Human DNA Quantification Kit (Thermo Fisher).
Along with blood samples, each participant filled out questionnaire regarding drinking habits, the amount and frequency of alcohol consumption and the presence of flushing and redness after alcohol intake. A drinking habits questionnaire was conducted to categorize those who showed flush even if they drank a little alcohol. Each subject was asked to provide the frequency and number of drinks per week and whether he/she has experienced flushing responses after alcohol intake. Based on the survey responses, 255 subjects for AFS positive, 215 for AFS negative and 100 control samples, grand total of 570 participants, were randomly selected for this experiment. A randomized selection was made for the control group representing the overall distribution of Koreans, regardless of the flushing questionnaires. The following experimental procedure and detailed informed consent process have been reviewed and approved by the Institutional Review Board of Seoul National University College of Medicine (IRB approval No. C-1501-078-641).
2. Marker selection
Genes known to be associated with alcohol metabolism pathways, alcohol dependence, alcohol related pathologic conditions, and drinking behaviors were found in various publications [51213141516]. Some of the popular alcohol metabolism related genes include ADH4, ADH7, ADH1B, ADH1C, and ALDH2 as well as various others. From the genes found to be related to alcohol metabolism and consumption, only the Tag SNPs have been searched and selected as potential candidates. Tag SNPs were chosen from tagger website provided by NIH (http://manticore.niehs.nih.gov/snpinfo/snp-tag.php) with linkage disequilibrium threshold set to r2≥0.8 and minor allele frequency (MAF) range of 0.05–0.5. Because there was no Korean exclusive population pool, Japanese (JPT) and Chinese-Beijing population groups (CHB) were selected; the two population groups assumed to present the highest resemblances to Koreans. Each gene was searched twice, once with Japanese and once with Chinese population pool to verify whether there were any discrepancies in search results. As a result, total of 24 candidate single nucleotide polymorphism (SNP) markers were selected for experiment.
3. Genotyping
DNA from 570 samples was extracted from 300 µL of blood and each extracted DNA was diluted to >50 ng/µL for reliable experimental results. SNP genotyping of 570 samples was performed using 192.24 Dynamic Array Integrated Fluidic Circuits (IFC) (Fluidigm, San Francisco, CA, USA), a platform that uses IFC is known to be capable of performing multiple real time polymerase chain reaction (PCR) reactions in a single run with high accuracy and call rates. “192” indicates the number of samples that can be loaded on a single batch and “24” corresponds to the number of markers used in this experiment. The array is mounted on a plastic interface containing 192 sample and 24 assay inlets on the left and right of the array. The array contains a network of fluid lines (IFC) and chambers that are controlled by elastomeric valves. These valves deflect under pressure to create a tight seal, thereby regulating the flow of liquids into the IFC.
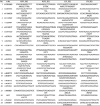
The complete primer sequences for all 24 markers are provided in Table 1. Primers were designed for each SNP including two allele-specific primers (ASP), one locus specific primer (LSP), and one specific target amplification (STA) primer through Fluidigm's DeltaGene assay design service. 10× SNP type STA Primer Pools were prepared comprised 2 µL SNP type Assay STA Primer (100 µM) for each assay, 2 µL SNP type assay LSP (100 µM) for each assay, and 304 µL DNA suspension buffer. STA was performed using 2.5 µL 2× Multiplex PCR Master Mix (Qiagen, Hilden, Germany), 0.5 µL 10× SNP type STA Primer Pool, 0.75 µL PCR-certified water, and 1.25 µL of each genomic DNA sample. GeneAmp PCR System 9700 (Applied Biosystems, Foster City, CA, USA) was used to thermal cycle according to the following protocol: 95℃ for 15 minutes followed by 14 cycles of 95℃ for 15 seconds and 60℃ for 4 minutes. STA products were diluted 1:100 in DNA suspension buffer. SNP type assay mixes were prepared for each SNP type assay combining 3 µL of each 100 µM SNP type assay ASP1/ASP2, 8 µL 100 µM SNP type assay LSP, and 29 µL DNA suspension buffer. To create 10× assay mixes, 2 µL 2× Assay Loading Reagent (Fluidigm) and 1.2 µL PCR-certified water were blended and then combined with 0.8 µL of each SNP type assay mix. The sample mixes were created as follows: 2.25 µL Biotium 2× Fast Probe Master Mix (Biotium, Fremont, CA, USA), 0.225 µL 20× SNP type Sample Loading Reagent (Fluidigm), 0.075 µL 60x SNP type Reagent (Fluidigm), 0.027 µL ROX (Life Technologies, Carlsbad, CA, USA), and 0.048 µL PCR-certified water were blended and then combined with 1.9 µL of each genomic DNA. Each of the assays and samples was pipetted into separate inlets on the frame of the chip according to the manufacturer's instructions. The assays and samples were loaded into the reaction chambers and mixed using the IFC Controller MX. Arrays should be run immediately after assays, with samples pipetted into wells. The array was analyzed in the BioMark real-time PCR system (Fluidigm) using a thermal protocol of a hot-start step (95℃, 5 minutes), touchdown step (95℃ for 15 seconds, from 64.0℃ to 61.0℃ dropping 1℃ per cycle for 45 seconds, 72℃ for 15 seconds), additional PCR step (34 cycles of 95℃, 15 seconds; 54℃, 45 seconds; 72℃, 15 seconds) and cooling step (25℃ for 10 seconds). The experimental data was collected using SNP Genotyping Analysis Software and Fluidigm Data Collection Software as indicated in user guide (Fluidigm).
4. Statistical analysis
We tested for the efficacy of associated markers to predict AFS in our samples. The associations of each markers were observed using chi-square test, P-value of <0.05. All experimental data analysis was performed using PLINK software version 1.07 [17].
For further assessment, the experiment data was divided into three groups; AFS positive-AFS negative pair, AFS positive-control pair, AFS negative-control pair. In order to examine the markers significantly associated with flushing conditions, intergroup comparisons were performed; association analysis for each pair was done.
Results
1. Final candidate markers
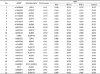
The list of final candidate markers, located genes and MAF is provided in Table 2. The candidate markers were found mostly in chromosome 4, 9 and 12, except one, rs4909801, found in chromosome 8, with the MAF ranging from 0.049 to 0.441. The average MAF was 0.240458±0.11933. MAF values for all markers were obtained via Haploview [18].
2. Association analysis of the candidate markers
Chi-square test was performed to observe the associations among the tested samples. According to initial association analysis, combining all samples from three groups, five were found to show possible association with flushing syndrome: rs671, rs2074356, rs4646776, rs10849915, rs4767035 with P-values ranging from 1.39×10⁻¹⁴ to 0.01886 (Table 3). According to this analysis, rs671 was found to be the most significantly associated with AFS in our sample population (odds ratio AA vs. GG, 12.37; 95% confidence interval [CI], 5.651 to 27.09). The highest odds ratio was seen with rs2074356 (odds ratio AA vs. GG, 14.65; 95% CI, 0.4701 to 0.9351).
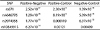
Followed by the combined association analysis, the samples were divided into grouped pairs and intergroup comparisons were performed for each pair. In AFS positive-AFS negative group, total of 10 SNP markers showed statistically significant P-value (P<0.05), and both AFS positive-control and AFS negative-control pairs showed statistically significant (P<0.05) markers that may have significant association with flushing. Of those markers with significant P-values, four SNP markers were commonly found in all grouped pairs: rs671, rs4646776, rs2074356, and rs10849915 (Table 4). Although each pair showed those mentioned four markers with statistically significant P-values, each group showed slight variations in markers with the strongest association; AFS positive-AFS negative presented and AFS negative-control group showed rs671 as the marker with the strongest possible association, the lowest P-value, while AFS positive-control group pair had rs4646776 as the candidate marker with the highest statistical significance (Table 5).
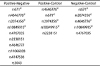
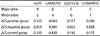
Moreover, the major and minor alleles with frequency values for each candidate SNPs are indicated in Table 6. The risk allele for rs671 is A, for rs207436 is also A, rs4646776 and rs10849915 are both C. Major and minor frequency among AFS negative and control show relatively clear distinction, while the frequency for AFS positive group presents rather ambiguous values for definite prediction. This may be due to the fact that even one allele carriers in AFS positive group exhibited flushing responses. For instance, rs671 has risk allele of ‘A’ and both subjects with ‘AA’ and ‘AG’ genotype would present flushing reactions.
3. Sensitivity, specificity, and accuracy
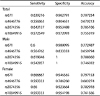
In order to evaluate differential power for the candidate SNPs, sensitivity, specificity and accuracy for each marker were calculated (Table 7). The average values for sensitivity, specificity, and accuracy were 0.602941±0.03866, 0.923256±0.079434, and 0.749468±0054809, respectively. rs4646776 presented the highest sensitivity, while the highest specificity value was observed in rs2074356, a marker in which also presented the largest gap between sensitivity and specificity. The highest accuracy was found in rs671. rs10849915 had the lowest values for all sensitivity, specificity and accuracy among those four markers.
Meanwhile, in order to examine whether the sex difference could act as another factor for provoking AFS incidence, additional statistical assessment analysis was done assigning the sex as possible covariant. According to analysis data, no statistically significant sex effect was found (P<0.05). Knowing that difference in sex does not affect the association within our samples, the sensitivity, specificity and accuracy were recalculated, dividing the samples into male and female groups (Table 7). The sample size for male subject group was 264 (105 subjects for AFS positive, 93 for AFS negative, and 66 control samples) and the female group was 306 (150 subjects for AFS positive, 122 for AFS negative, and 34 control samples). The average sensitivity, specificity, and accuracy for male group were 0.566667±0.052453, 0.955357±0.081543, and 0.739418±0.061609, respectively. rs4646776 showed the highest sensitivity, 0.619048; specificity, 1; and accuracy, 0.78836, in male group. Notice that both rs4646776 and rs2074356 had specificity of 1, however, this is only due to extremely small sample number thus may not be signified as a reliable index. Moreover, within female group, rs671 showed the highest sensitivity, 0.66667; specificity, 0.94656; and accuracy, 0.797153 while the lowest values for all three criteria were observed in rs10849915. The other three markers, other than rs10849915, showed relatively similar rates of specificity; however, rs10849915 showed considerably low specificity within female sample group. rs2074356 showed the lowest sensitivity with the greatest gap between sensitivity and specificity value. The overall average sensitivity for female group was 0.628333±0.040506, 0.902672±0.078685 for specificity, and 0.756228±0.050787 for accuracy.
Discussion
Through this study, the potential SNP markers that are highly associated with AFS in Koreans were investigated and also examined whether these candidate SNPs can be used to construct a propensity prediction model to be applied in real forensic cases. We have selected 24 SNP testable markers and assessed their association with AFS in our samples. The statistical analysis showed four candidate SNP markers that can possibly be used to predict the expression of AFS.
Considering the fact that the world-wide trend of externally visible characteristics prediction model cannot fit into Korean society due to limited phenotypic characteristics, it is inevitable that propensities must be taken into account in order to increase the differential power and efficacy of the prediction model targeting Korean population. Therefore, it is extremely important to find and isolate the markers that not only hold the sufficient power to differentiate individuals but also have the ability to distinguish Koreans from other populations under any circumstances; in this case, genetic variants causing AFS being the East Asian specific target markers for differentiating individuals.
There has been reported study demonstrating that chromosome 4 and 9 are related to drinking behaviors in Korean male, and that chromosome 12 includes markers pertinent to alcohol dependence [2]. With regards to such information, interesting finding from our study was that all of our four significant markers in this experiment were located in chromosome 4, 9, and 12. This can indicate that, somewhere on or near those chromosomal locations, there may be markers that can represent the presence of flushing reaction, distinctively in East Asians or may even be exclusive in Koreans. Moreover, other studies also declared that rs11066280 located in gene C12orf51, also noted as HECTD4, may be associated with facial flushing in Korean men and also have discovered that SNP markers around CCDC63 gene, known to be associated with alcohol consumption behavior, can be Korean distinctive association indicator [23]. Although C12orf51 (HECTD4) and CCDC63 may not be the typically cited genes in alcohol metabolism and their exact function and mechanism for alcohol elimination is yet to be revealed, several studies have begun to depict their roles after alcohol intake as well as drinking behavior, especially in Asian population [219]. Additionally, because these two genes are also located in chromosome12, in which all of our significant SNP markers were found, it may be adequate to presume that the neighboring genes and proteins are engaged in ethanol clearance pathways by influencing one another.
All four candidate SNPs were located in chromosome 12. rs671 and rs4646776 are located in ALDH2, which is one of the highest polymorphic regions in Asian population as well as the main gene responsible for acetaldehyde oxidation [8910]. rs2074356 is found in HECTD4 (also noted as C12orf51), a gene related to ubiquitin-protein transferase activity; combination of ubiquitin and alcohol is known to stimulate the proliferative activity of hepatocytes and recent researches have shown its possible association to alcohol related behaviors in Korean men [2]. A study revealed that SNP located in C12orf51 (HECTD4) was identified to be strongly associated with drinking behavior in Han Chinese [19]. A notable remark was that our data also presented a marker located at C12orf51 (HECTD4) to be significantly associated with AFS among our samples. This may indicate that variants found in or near C12orf51 (HECTD4) can be East Asian specific characteristic that can be used as prediction marker. Also, rs10849915 from CCDC63 gene, a protein coding gene associated with drinking behavior as well as the amount and/or frequency of alcohol consumption, was found to be significant [2]. According to a study, CCDC63 gene was noted to be associated with drinking behavior in Japanese population. This may indicate that CCDC63 could exhibit similar effects among Korean population due to genetic resemblances and biogeographic similarities between the two population groups [20].
Of those markers, rs671 showed the highest statistical significance, P-value of 1.39×10⁻¹⁴, and accuracy. The highest specificity value was observed with rs2074356, and rs4646776 presented the highest sensitivity rate within this sample pool. However, this result may be exclusive trend only found among our sample population. Because this research was conducted involving relatively small number of subjects, with uneven sex ratio, to represent the entire Korean population, additional experiment performed with larger sample sizes may generate outcomes that are different from current reports.
AFS is known to occur mostly among Asians, especially East Asians, due to variants found in genes responsible for alcohol metabolism pathways [9102122]. The possible reasons for such incident to be commonly found in Asians, especially in large proportions of Korean, Japanese and Chinese populations, are due to genetic polymorphisms found in ADH and ALDH cause the accumulation of acetaldehyde, affecting the rates of alcohol metabolism and clearance rates [48910122324]. There are different types of ALDH variants; however, the one that needs to be focused is ALDH2*2. The normal allele is termed ALDH2*1 and the polymorphic ALDH2*2 is caused by a single substitution of amino acid, ALDH2 487lys. The variant causes structural change, which eventually result in inactivation of ALDH2 that slows down the removal of acetaldehyde in blood [248910]. This ‘inactive’ form of ALDH2 is commonly found in East Asians; up to 50% of Asians are carriers of ALDH 487lys variant, attributing to high prevalence of hypersensitive flushing reaction after alcohol intake, while ALDH2 487lys is hardly found among Caucasian populations [10]. Another study reported that about 40% of Japanese population lack ALDH2 activity and people with homozygous variant in ALDH2 show profoundly more frequent occurrences of facial flushing with far higher acetaldehyde level in blood compared to people with heterozygous variants [92526]. In addition, studies done with Taiwanese male and Han Chinese have found that subjects with heterozygote ALDH2*2 also exhibited slower alcohol elimination and flushing responses after alcohol intake, suggesting that people with either homo and heterozygotes for ALDH2 variants demonstrate decrease in enzymatic activity and thus are susceptible to alcohol metabolism [71127].
This is the very first study solely dedicated to explore Korean-specific traits and that highlighted AFS as potential criminal investigation propensity prediction marker to explore the occurrences of AFS in broad range of population group, regardless of sex and age differences. After thorough future studies and validation to test for its capability and operability as FDP factor, it is expected to be a valuable supplementary tool in criminal investigation. This research can be the foundation to construct an operable Korean specific phenotypic and trait prediction model; research data only pertaining to Korean phenotypic trait studies are very scarce as of now and this exclusive data may aid in creating physical appearance inference guidelines.
The potential candidate SNP markers for predicting AFS in Koreans were selected and the efficacy of significant markers were examined in this study. Albeit this experiment has discovered four candidate markers significantly associated with AFS, larger set of appropriate markers and improved efficacy of current markers are crucial through further assessment in order for to create robust experimental platform as well as the prediction model that holds sufficient discrimination power to be applied in practical forensic cases. Moreover, even if there are adequate markers with satisfactory results for predicting AFS in Koreans, experiment wise, there also are administrative and procedural complications that we must overcome in order to implement phenotypic prediction model in criminal investigation. Unlike some countries that currently allow FDP in criminal investigation [28], Korean legislature and law enforcements rather hold conservative views about implementing FDP and propensity prediction model into real criminal investigation due to various reasons. In order for this prediction system to be introduced, these disputes must first be settled as well as any other possible ethical or legal concerns. Also, exceptionally cautious approach is required when selecting the candidate markers; all markers, the ones that we have already found and also the ones that we might discover in near future, should absolutely be free from any controversial ethical or legal concerns. For instance, if any of the markers are known to be associated with any kinds of medical conditions or diseases, then those must shall be completely eliminated from any further inferences usages [2829]. The establishment of proper guidelines and further research, accompanied by Korean population exclusive marker sets with strong differential powers, would tremendously contribute to the construction of effective platforms for FDP and propensity prediction model as supplementary investigative tool.
Consequently, these findings of AFS associated markers are expected to be meaningful foundation for constructing Korean specific propensity prediction model for future forensic applications.

 XML Download