

 PDF
PDF Citation
 Print
Print


INTRODUCTION
Stroke is the second leading cause of death worldwide and the third one in Korea, and stroke mortality steeply increases with an advance of age, particularly after age 70.12 A fracture occurs frequently in elderly stroke survivors and increases their risk of death and disability. Up to a 4-fold increase in the risk of fractures has been reported in stroke population compared to healthy controls.345 About 73% of stroke survivors with mild to moderate disability have experienced a fall during the first 6 months after discharge.6 About 30% of patients with a femoral neck fracture died within one year after the acute fracture.78 As we would expect, post-stroke fractures increase suffering of stroke survivors and put additional burden to their families and society.9
Regarding the incidence of fractures in general population, Asians and Caucasians differ in bone fragility,10 and Asians are more likely to develop hip fractures than Caucasians.1112 Stroke patients take up a large portion of fracture cases, and an estimated cumulative incidence of fracture at 2 years after stroke is as high as 2.8%–5.7%.3131415 Furthermore, stroke is a major societal burden in terms of death and disability in Asian countries.116 Therefore, it is quite reasonable to establish the post-stroke fracture rates and develop the preventive strategies at a national level. However, until recently, information on post-stroke fracture is lacking in most of Asian countries including Korea.
This study aimed to investigate the incidence of fractures after acute ischemic stroke in Korea by a linkage between a nation-wide, prospective, multicenter stroke registry database and the National Health Insurance Service (NHIS) claim database.
METHODS
Study population and data collection
Acute ischemic stroke patients 1) who were admitted to 14 participating university hospitals or regional stroke centers from January 2011 to November 2013, 2) who were registered in the Clinical Research Collaboration for Stroke in Korea (CRCS-K) registry database,17 and 3) who gave their consent to linking their registry data to other secondary databases including the NHIS claim database or the National Death Certificates for stroke research were identified. Among these 15,114 patients, 1) patients who were not matched using the claim serial number between the CRCS-K registry database and the NHIS claim database (n = 384), 2) who had no claim record in the NHIS claim database (n = 102), or 3) whose identification numbers were duplicated (n = 4) were excluded. We also excluded all the patients registered in one participating hospital because of serious mismatching in dates of death between the CRCS-K outcome database and the NHIS claim database (n = 1,422). The patients without acute infarction on brain imaging (n = 1,361) and who died during hospitalization (n = 319) were excluded further from the study population. Finally, 11,522 patients were analyzed for this study.
Information on baseline demographics, medical history and risk factors, laboratory findings, stroke characteristics, prescribed medication, and post-stroke cardiovascular events were obtained from the registry database. The CRCS-K registry prospectively captured vascular events during hospitalization and up to one year after index stroke by review of medical records and telephone interview by experienced stroke coordinators in each center.18 The NHIS is a mandatory universal health insurance service providing comprehensive medical care coverage since 1989 and 97.1% of the Korean population is covered by it.19 The NHIS claim database contains information on beneficiaries' demographic characteristics, diagnostic codes, procedures, and prescription records for hospitalization and outpatient care separately. The claim database was linked with the CRCS-K database using the claim serial number which was generated in each claim at each hospital for reimbursement.
Definitions of fractures and other variables
The primary outcome was any fracture that occurred within 4 years after index stroke. Diagnosis in the NIHS claim database is coded by International Classification of Disease, 10th Revision-Clinical Modification (ICD-10-CM). We captured 3 types of fractures after discharge from index stroke: hip fracture (ICD-10 S720*, S721*), spine fracture (ICD-10 S220*, S221*, S320*, M484*, M485*), and other fractures including leg (patella, tibia, fibula and lateral/medial malleolus; ICD-10 S82*), forearm (ICD-10 S525*, S526*) and arm (ICD-10 S422*, S423*) fractures.20 We counted only the first occurrence of a fracture in each patient, but captured the following fractures if the type of fracture was different from the previous one. Age was categorized into less than 55, 55–64, 65–74, 75–84, 85 or more. Disability at discharge was categorized according into no (0–1), mild to moderate (2–3) and severe (4–5) according to patients' modified Rankin Scale (mRS) scores at discharge. Osteoporosis was defined as diagnostic codes of ICD M80* to M82*. Estimated glomerular filtration rates (eGFR) were calculated by Modification of Diet in Renal Disease (MDRD) equation (GFR [mL/min/1.73 m2] = 175 × [serum creatinine]−1.154 × [age]−0.203 [× 0.742, if women]) and were categorized 90 or more, 60–89, 30–59, 15–29 and less than 15. Chronic kidney disease (CKD) was defined as eGFR < 60 mL/min/1.73 m2.
Statistical analysis
Baseline characteristics were demonstrated as a frequency and a percentage for a categorical variable, and a mean ± standard deviation (SD) or median (interquartile range [IQR]) for a continuous variable. For each individual, time intervals in days from index stroke to a fracture event, an end of follow-up, or a death were calculated. Cumulative incidence functions (CIFs) were used to estimate the probability of the occurrence of each type of fractures in order to take into account the competing risk of mortality. They were reported at 6 months, 1 year, 2 years and 4 years after index stroke, and was compared according to age, gender, disability at discharge and osteoporosis, which are known to influence the risk of fracture31521 using Gray's test. Regarding all other covariates, only 4-year CIF was compared. Adjusted hazard ratios (HRs) with 95% confidence intervals (CIs) were estimated to explore risk factors of post-stroke fracture using Fine and Gray model for competing risk22 regarding any fracture as a dependent variable. The incidence rate of hip fracture was separately calculated over 10-year interval of age in both gender. Statistical analyses were performed using SAS version 9.4 (SAS Institute Inc., Cary, NC, USA). A two-sided P value of < 0.01 was declared as statistically significant.
Ethics statement
The collection of clinical information and the linkage of this collected information with secondary databases for the purpose of stroke research with informed consent were approved by the local ethic committees of all the participating centers. The use of the CRCS-K database and its linkage with the NHIS claim database for this study was approved further by Institutional Review Board (IRB) in Seoul National University Bundang Hospital (No. B-1511/322-106).
RESULTS
Of 11,522 patients, 59% were men (n = 6,770) and mean age was 67.4 ± 13.0 years. The median follow-up duration was 3.8 (IQR, 2.4–4.7) years. A total of 1,616 fractures were observed during the follow-up period. The baseline characteristics of study population and the number of fracture events according to them were demonstrated in Supplementary Table 1.
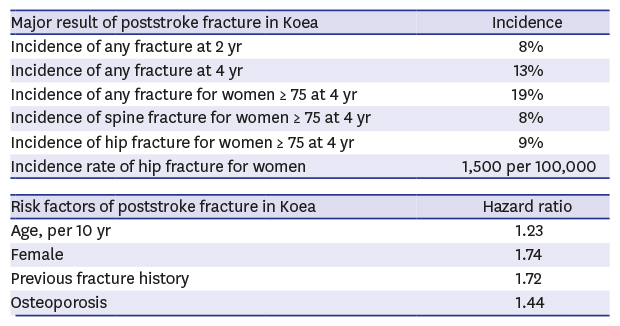
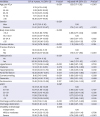
The CIFs of any fractures was 2.63% at 6 months, 4.43% at 1 year, 8.09% at 2 years and 13.00% at 4 years (Table 1). The most common type of fracture was spine fracture, the frequency of which was about as twice as that of hip fracture, the second common type. The incidence was highest in the first year and decreased gradually after then.
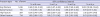
Table 1
The cumulative incidence functions of each type of fracture for 4 years after acute ischemic stroke
![]()
The CIFs of any fracture and two most common types of fractures, spine and hip fractures, was depicted by subgroups of age, gender, disability at discharge and osteoporosis (Table 2 and Fig. 1). The CIFs of any fracture was 8.47% at 4 years in men and 19.51% at 4 years in women, nearly 2.5-fold in women than men, and the difference by gender was consistent across the 4 years. With ageing, the CIFs of fractures were increasing; 5.79% at 4 years in aged less than 55 years and 16.38% in aged 85 years or more; this tendency was more evident for hip and spine fractures compared to any fracture. Higher incidence of any fracture was observed in those with mild to moderate disability at discharge, compared to no disability or severe disability, and in those with osteoporosis, compared to no osteoporosis. The patients with CKD (eGFR < 60) had a higher incidence of post-stroke fractures than those with eGFR ≥ 60.
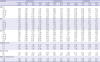
Table 2
Comparison of the cumulative incidence functions between spine and hip fractures
![]()
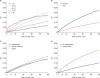 | Fig. 1CIF estimates of any fracture for each subgroup. (A) Age over 10-year interval, (B) gender, (C) disability at discharge, and (D) osteoporosis.CIF = cumulative incidence function.
|
Four-year CIFs of spine fracture was 3.07% in men while 9.73% in women (Table 2). That of hip fracture was 1.87% in men while 5.00% in women. The gender difference was more marked for spine fracture than hip fracture. The 4-year CIFs of spine fracture increased steeply over 65 years in women, but more steadily with aging in men. Regarding hip fracture, a similar pattern was observed also. Women aged 85 years or more may be the highest risk group; the 4-year CIF of spine and hip fractures in this group was 11-fold and 28-fold greater than that in men aged less than 55 years, respectively. It should be noted that approximately one third of spine and hip fractures during the first 4 years after stroke occurred within 6 months in this group.
For any fracture including spine, the 4-year CIF was highest in patients with mild to moderate disability followed by that in those with severe disability and then by that in those with no disability. The CIF of spine fractures was marked between mild to moderate disability and severe disability. According to the presence of osteoporosis, the 4-year cumulative incidence of fracture differed more than 3 times for spine and hip fractures.
Older age, women, previous fracture and osteoporosis were independently associated with higher risk of any fracture (Table 3). Previous stroke had a tendency to increase the risk of fracture. However, atrial fibrillation, antithrombotic medication and severe disability decreased the risk of fracture. Body mass index, most of major vascular risk factors and discharge destination were not associated with any fracture. Diagnosis of Parkinsonism/dementia and mild to moderate disability at discharge were not significant either, although they were included in the models due to their associations with post-stroke fracture in Gray's test.
Table 3
Predictors of any fracture at 4 years after acute ischemic stroke
CIF = cumulative incidence function, CI = confidence interval, HR = hazard ratio, eGFR = estimated glomerular filtration rates.
aP value by Gray's test for competing risk data; bP value by Fine and Gray model for competing risk data.
![]()
The incidence rate of hip fracture was 566.8 (481.7–667.0) per 100,000 for men and 1,495.2 (1,321.5–1,691.7) per 100,000 for women. For men, it was 27.8 (3.9–197.0) per 100,000 in aged less than 50 years, 199.7 (113.4–351.7) per 100,000 in 50–59 years, 464.6 (330.3–653.5) per 100,000 in 60–69 years, 950.4 (746.7–1,209.8) per 100,000 in 70–79 years, 1,627.5 (1,138.0–2,327.8) per 100,000 in 80–89 years and 3,735.1 (1,204.6–11,580.8) per 100,000 in aged 90 years or more. While for women, it was 75.7 (10.7–537.4) per 100,000 in aged less than 50 years, 152.2 (49.1–472.0) per 100,000 in 50–59 years, 770.6 (538.8–1,102.1) per 100,000 in 60–69 years, 1,867.3 (1,562.6–2,231.5) per 100,000 in 70–79 years, 2,834.5 (2,288.8–3,510.4) per 100,000 in 80–89 years and 5,771.6 (3,351.3–9,939.8) per 100,000 in aged 90 years or more.
DISCUSSION
In this study the CIF of fracture in survivors from acute ischemic stroke was as frequent as about 8% at 2 years and 13% at 4 years after index stroke. It is noteworthy that spine and hip fractures usually leading to severe disability and death accounted for almost three-quarters. As expected, the fracture incidence was higher in women, and increased exponentially with aging. Stroke survivors with mild to moderate disability were at higher risk of fracture than those severely disabled, which means that the former should be cared for more cautiously regarding preventing falls than the latter. Older age, previous fracture and osteoporosis heightened the risk of post-stroke fractures.
In our study, the crude incidence rate of hip fracture was 566.8 per 100,000 for men and 1,495.2 per 100,000 for women. In Korea, however, the age-adjusted incidence rate of hip fracture in the general population was 206 per 100,000 for men and 310 per 100,000 for women in 2012.2324 When this population was standardized with the age distribution of our stroke population, the incidence rate was calculated as 196.6 per 100,000 for men and 531.9 per 100,000 for women. Therefore, the fracture risk in our ischemic stroke population would be expected to be 3 times higher than an age-adjusted reference population in Korea. Furthermore, the fracture incidence of 8.09% at 2 years in this study was higher than those estimated from other Caucasian stroke populations. An analysis of Sottish routine hospital discharge data identified 4% of any fracture rate within 2 years.3 A study based on administrative claims data of a medium-sized university hospital in the US with median follow-up of 1.4 years revealed the fracture rate of 3.1% at 1 year.5 Fracture rates after stroke in two large US veteran cohorts were 6.1% and 4.7% at 2 years, respectively.13 Of 1,104 stroke patients in New Zealand, 31 (3%) experienced a fracture during 2 years.14 Recently, 2-year risk of any low-trauma fracture after stroke was reported as 5.7% from the Ontario Stroke Registry.15
It is not well known that Asians are more vulnerable to post-stroke fracture than Caucasians. A low dietary calcium intake is ubiquitous among adults in Asia,2526 which may be more distinct in Asian stroke patients.27 The relationship between load-bearing activities and the risk of hip fracture was investigated in Asia.2829 Low visual acuity and slow narrow walking speed were proposed as significant factors for non-vertebral fracture irrespective of osteoporosis.30 More research is warranted in the Asian stroke population. A world-wide projection indicated the number of hip fractures in Europe and North America will fall to around one quarter in 2050, by which time steep increases will be observed throughout Asia and Latin America.31 Although previous studies focused on the predominance of hip fractures,3432 recent ones identified other fractures including rib and lower legs required more attention than before.521 Our study also found that fractures other than hip were more prevalent in Korean stroke population, suggesting different mechanisms of fractures after stroke. Ethnicity may explain a difference in bone fragility10 and the different distribution of fracture location.21 The causes of post-stroke fractures in Korean stroke population should be explored further.
Spine and hip fractures leading to severe disability and death frequently occurred in 5.79% and 3.15% of stroke survivors during the first 4 years in this study. In the Swedish and Scottish studies, the hip fracture rate showed similar patterns; highest in older women and in the first year.333 In addition, we found the incidence of spine and hip fractures increased steeply in individuals over 65 years of age, especially in women. Moreover, old women with hip fractures experienced half of them within 1 year whereas old men with hip fractures experienced most of them after 1 year from index stroke. It is unclear whether our findings resulted from different distribution of individual risk factors (obesity, osteoporosis, or stroke severity) or environmental factors (socioeconomic culture, medication, the status of rehabilitation, or care facility) in Korean population from Caucasian population. A focused program for preventing falls and screening osteoporosis in old women is required in the early stage of ischemic stroke.
Gender difference in our study is predictable and in keeping with the published results315 given the higher prevalence of osteoporosis20 and poor functional recovery34 in women. Previous studies provided little information about the association of fracture risk with stroke severity or ambulatory status.314 In a surveillance study in Texas, individuals with intermediate stroke severity defined by an National Institute of Health Stroke Scale (NIHSS) score of 3–6 had a higher risk of fracture than the lower NIHSS (0–2) or higher NIHSS (7–) subgroups.21 In our study, the highest fracture rate was observed in mild to moderate disability group (mRS 2–3) than independent (mRS 0–1) and severely disabled (mRS 4–5) groups, which is consistent with the previously reported U-shape relationship between physical disability and falls in chronic stroke patients.1435 The association between stroke and osteoporosis leads to increased risk of fracture in stroke survivors through a possible link of bone density changes due to immobility and decreased dietary supplements after stroke.3637 In general population, osteoporosis is present in approximately 20% of people over 50 years of age in Korea.20 However, our stroke patients had a higher proportion of osteoporosis which ranges from 32% to 43% among the participating centers. Interestingly, the patients with CKD had a higher CIFs in our study although adjusted HRs of decreased eGFR was not significant. Kidney function, as assessed by serum cystatin-C is associated with a more rapid loss of spine/femur bone mineral density.3839 Gait imbalance by uremic nephropathy as well as reduced skeletal muscle mass in hemodialysis patients would be correlated with frequent falling.40 Lower fracture risk in atrial fibrillation and antithrombotic medication in our study would result from the characteristics of relatively healthy population with good adherence in these subgroups.
Limitations of this study should be noted. First, while we captured fracture events using claims data, we had no information about the cause of fracture which may nest clues for the mechanisms to prevent them. Information on the presence of osteoarthritis and external trauma including motor vehicle accidents or falls from height was not collected. We also could not ascertain whether fractures occurred preferentially in hemiparetic extremities or the visually defected side. Second, the severity of fracture was not counted on. The events identified in this study could include some minor fractures which were not clinically significant. On the contrary, we could underestimate the incidence of fracture which was frequently asymptomatic, such as vertebral fracture. Open or closed fracture was not differentiated too. Third, greater risk of fracture was usually seen in patients with intracranial hemorrhage compared to ischemic stroke,21 but our stroke registry database comprised ischemic stroke mostly. Fourth, we had no data on mineral bone density, vitamin D deficiency and medication for osteoporosis. The detection and treatment status against osteoporosis could be important confounders relating to the fracture risk. Center disparity in diagnosis of osteoporosis was not considered in statistical analysis either. Furthermore, concomitant medications such as corticosteroid,4142 thyroid drug,43 antiparkinson drug,44 benzodiazepine,4546 antacid47 and chemotherapeutic agents48 which affect fracture risk were not gathered in this study. Finally, data on some important factors related to risk of fracture and fall including level of socioeconomic status, residential area and living alone were not available. Further epidemiologic study for identifying vulnerable social groups should be conducted. Despite these limitations, our study could provide the first valid data on post-stroke fracture in Korea using a large stroke cohort linked with representative nation-wide administrative data.
In conclusion, this study shows that survivors from acute ischemic stroke in Korea are at high risk of fracture with its CIFs of roughly 8% at 2 years and 13% at 4 years after stroke. The current findings suggest that older age, women, pre-stroke fracture and osteoporosis increase the risk of post-stroke fracture. We should focus on developing the strategies to screen and prevent them.
 XML Download